Update 5/12/2017: XRT rose steadily beyond my position’s zone of profitability and then, in last five trading days, retreated, allowing me to exit at $1.46, or 25.1% of maximum potential profit, almost precisely at my target.
Shares showed a net rise of 2.7% over 46 days, or a +21% annual rate. The options position produced a 33.6% yield on debit for a +266% annual rate
XRT has sufficiently high volatility to qualify for trading.
I shall use the MAY series of options, which trades for the last time 53 days hence, on May 19.
Implied volatility stands at 20%, which is 1.5 times the VIX, a measure of the volatility of the S&P 500 index.
XRT’s IV stands in the 43rd percentile of its annual range and the 47th percentile of its most recent broad movement.
Update 5/10/2017: KRE swung in the zig-zag pattern characteristic of a sideways correction, with time decay eventually bringing it to profitability I exited at 25% of maximum potential profit.
Shares produced a net rise of 3.0% over 44 days, or a 25% annual rate. The options position produced a 33.3% yield on debit for a 277% annual rate.
KRE’s implied volatility stands sufficiently high for me to meet my standards for trading.
I shall use the MAY series of options, which trades for the last time 53 days hence, on May 19.
Implied volatility stands at 26%, which is double the VIX, a measure of the volatility of the S&P 500 index.
KRE’s IV stands in the 43rd percentile of its annual range and the 52nd percentile of its most recent broad movement.
A third and final estimate of 4th quarter gross domestic product will be published on Thursday. Other major reports: International trade in goods on Tuesday and personal income and outlays on Friday.
All three reports will be released at 8:30 a.m. New York time.
Federal Reserve Chair Janet Yellen addresses the National Community Reinvestment Coalition’s annual conference in Washington, D.C. on Tuesday at 12:50 p.m. Her topic: Addressing Workforce Development Challenges in Low-Income Communities.
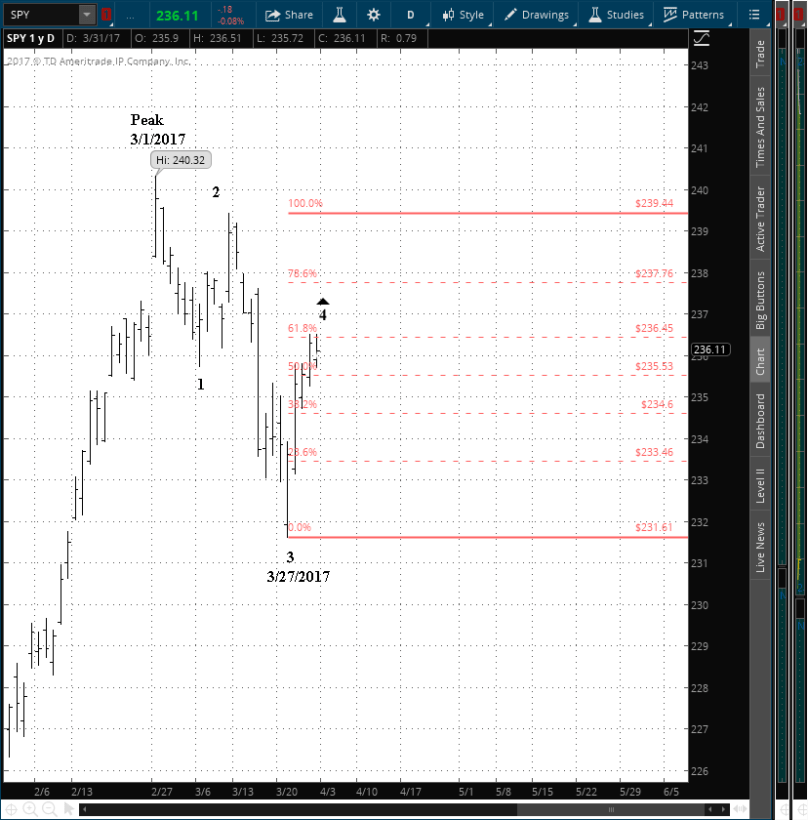
Update 3/31/2017: SPY rose continually after I entered the position. I exited with 21 days before expiration and with the profit at 6% of its maximum potential. Further upward movement will make the position unprofitable.
My goal was 25% of the maximum, but I decided to eliminate the risk of a loss for two reasons.
First, the spread I constructed had quite a narrow profit zone. That’s what the options grid allowed. In retrospect, it might have been better to have simply passed on the trade.
Second, the Elliott wave analysis of short-term movements presents an uncertain view of the future. I count the price as having being in an A wave upward retracement of a 3rd wave to the downside within a higher-level downward movement that began on March 1. The upward thrust has retraced a Fibonoacci 61.8% of the 3rd wave, reaching a common reversal point.
SPY 3/31/2017
Fibonacci retracements come with no guarantees. Moreover, a 4th wave like as not will take a sideways form, such as a Flat. Rather than risk the loss, it made more sense to me to take what profits I could and come back another day with a structure more likely to succeed.
Shares rose by 1.2% over seven days, or a +64% annual rate. The options position produced a 6.4% yield on debit for a +336% annual rate.
SPY’s implied volatility has risen to a relatively high level within a very narrow range.
I shall use the apr series of options, which trades for the last time 28 days hence, on April 21.
Implied volatility stands at 13% and, by definition, is nearly identical with the VIX, a measure of the volatility of the S&P 500 index.
SPY’s IV stands in the 21st percentile of its annual range and the 79th percentile of its most recent broad movement.
I entered positIon on SPY based on a high position within a very narrow range and exited COST for a loss.
I am attempting to exit NKE but it has not yet been filled. If the order should be filled, I shall update the live feed and add results to the analysis after the market close.
Update 4/4/2017: MU gapped upward after earnings were published and then fluctuated within a narrow sideways band. I considered the pattern to be unlikely to return to profitability prior to expiration and I exited.
At the close shares were up 8.2% over 12 days, or a +249% annual rate. The options position produced an 11.8% loss on debit for a -360% annual rate.
MU publishes earnings on Thursday after the closing bell.
I shall use the APR series of options, which trades for the last time 29 days hence, on April 21.
Implied volatility stands at 49%, which is 3.9 times the VIX, a measure of the volatility of the S&P 500 index.
MU’s IV stands in the 37th percentile of its annual range and the 56th percentile of its most recent broad movement.
Update 4/10/2017: GME gapped sharply to the downside after earnings were published and never returned to profitability. I exited for a loss 12 days before the position expired.
Shares declined b6 8.4% over 18 days, or a -170% annual rate. The options position produced a -9.1% loss on debit for a -183% annual rate.
GME publishes earnings on Thursday after the closing bell.
I shall use the APR series of options, which trades for the last time 29 days hence, on April 21.
Implied volatility stands at 43%, which is 3.4 times the VIX, a measure of the volatility of the S&P 500 index.
GME’s IV stands in the 62nd percentile of its annual range and the 60th percentile of its most recent broad movement.

You must be logged in to post a comment.