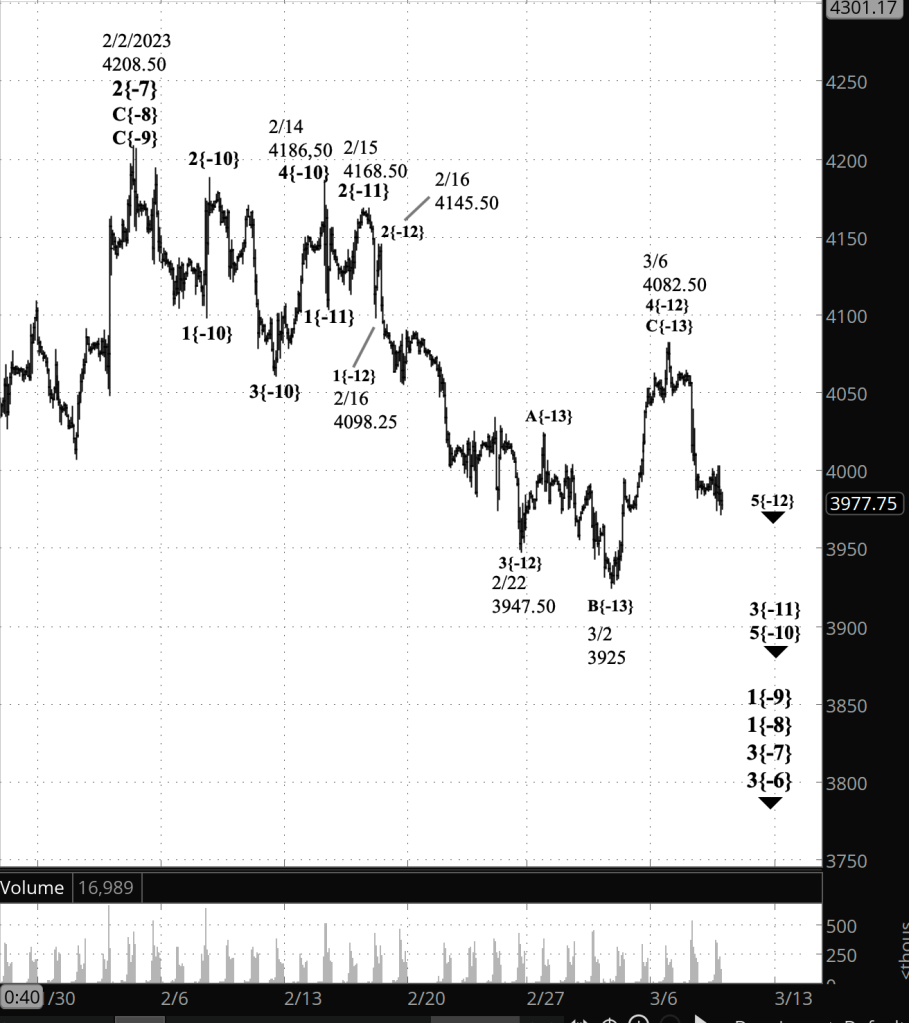
3:30 p.m. New York time
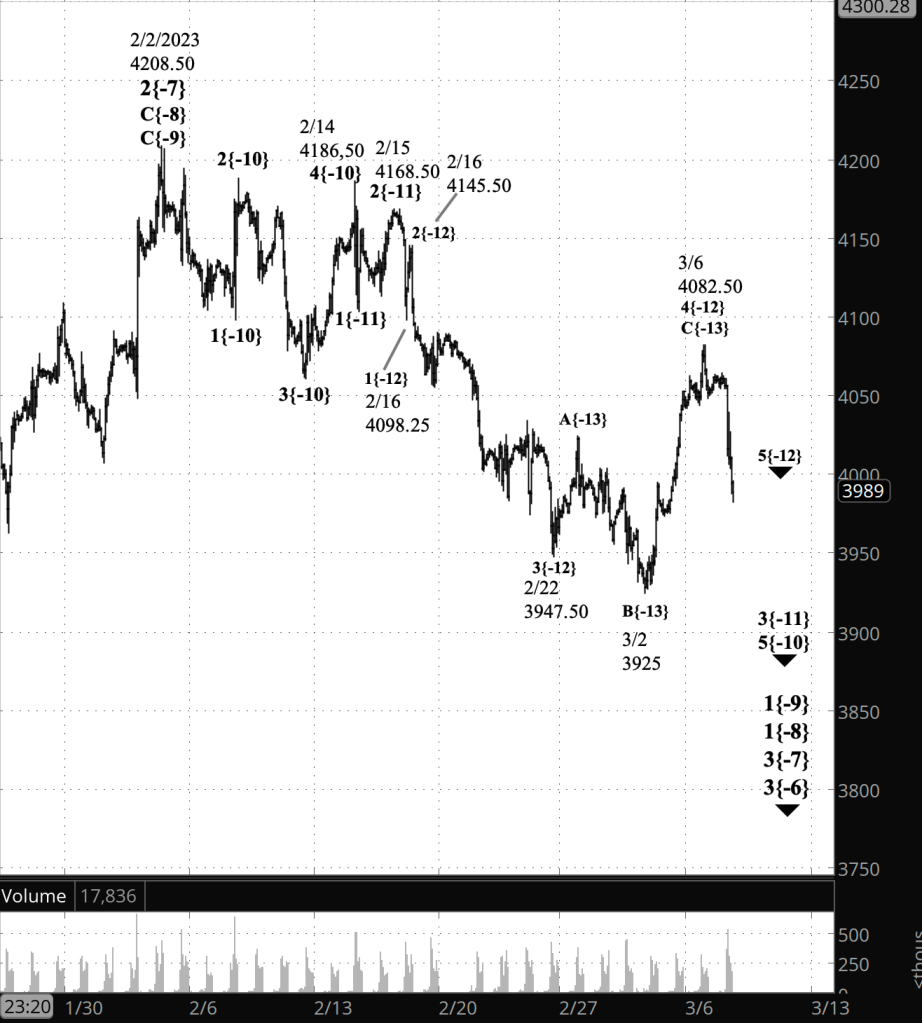
Half an hour before the closing bell. Once again we’re fishing for a top, a reversal point that will mean the upward correction has ended and a downtrend has begun. The rise that is the final wave of the 4th wave correction began on March 2 from 3925 and has completed five waves internally. The high so far, and possibly the reversal point, is at 4082.50, about 16 points below the end of the preceding 1st wave, which meets the requirement of Elliott wave analysis that a 4th wave not move into the territory of the preceding 1st wave.
So all of the Elliott wave requirements have been met. Does this mean that it’s 100% certain that downtrend has begun? Not at all. The price can still rise a bit more and be within the rules. However, there’s not much space remaining on the upside, and so I’ve marked the new chart on the assumption that the upward correction, wave 4{-12}, is complete, and the downtrend, wave 5{-12}, has begun.
Wave 5{-12}, if it is typical of 5th waves, will move below the starting point of the preceding 4th wave, 3947.50, and most likely significantly below that level. When wave 5{-12} is complete, it will also be the end of its parent, downtrending wave 3{-11}, which began on February 15 from 4168.50, and the beginning of a larger upward correction, wave 4{-11}, which will take back a portion of that downtrending 3rd wave.
[This afternoon’s analysis]
[S&P 500 E-mini futures at 3:30 p.m., 80-minute bars, with volume]
10:25 a.m. New York time
Two losing earning play exits. I exited two earnings earnings plays where the share price moved opposite the trades’ expectations.
NVDA was a forced exit, to avoid assignment when the stock went ex-dividend the next day. The loss, while significant, was within the position’s maximum rsk.
DELL also headed up when I had expected a negative response to earnings. Rather than hope things improved, I chose to take the money out and apply to the chance of profitable trades.
I’ve updated the trade analyses with full information on the exits: NVDA and DELL.
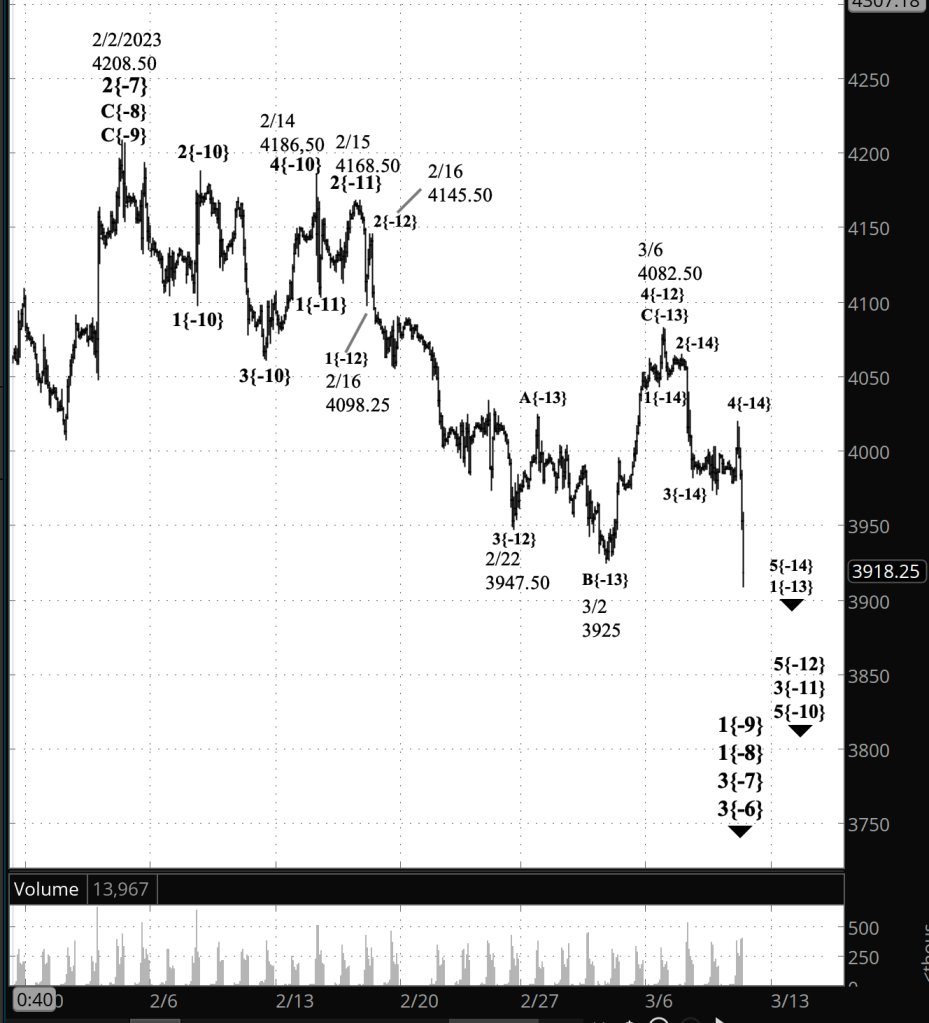
9:35 a.m. New York time
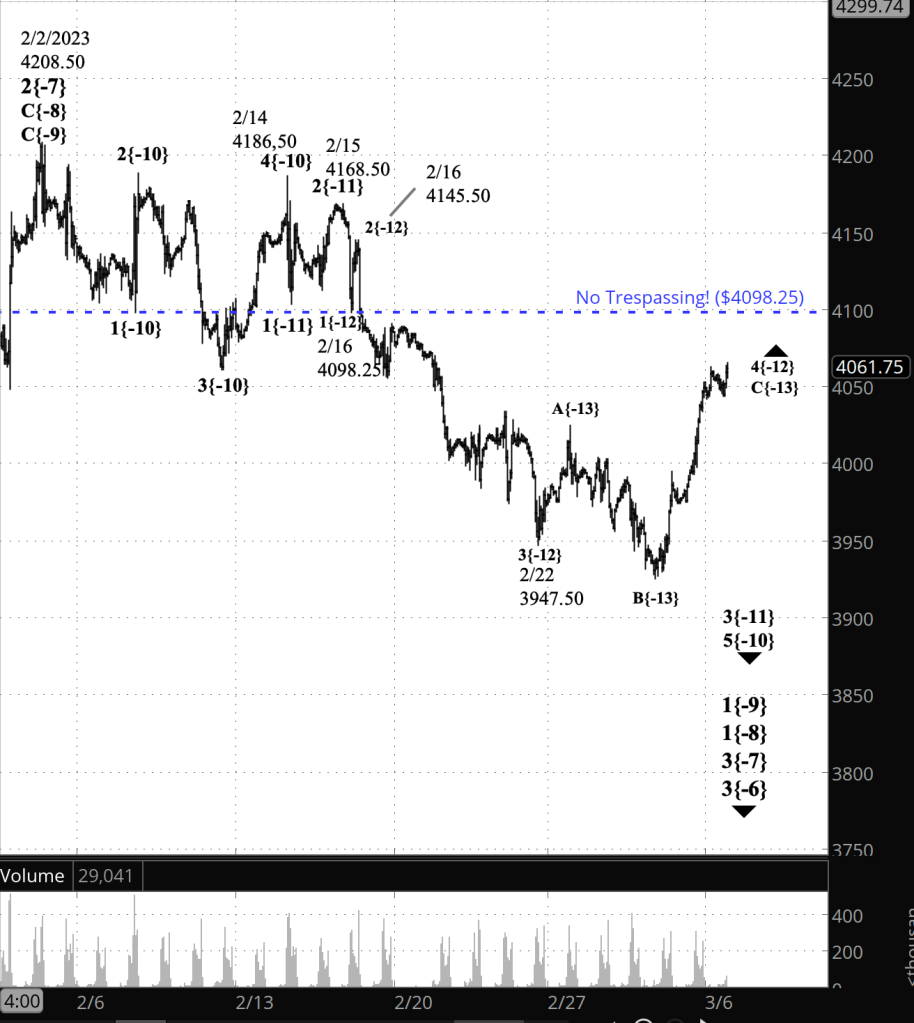
What’s happening now? The S&P 500 E-mini futures rose overnight into 4060s, pulled back slightly, and then resumed its rise.
What does it mean? The upward correction that began on February 22 is nearing it’s upper limit. The correction is the 4th wave of five within a larger downtrend that began on February 15. Under the rules of Elliott wave analysis, a 4th wave cannot move into the range of the preceding 1st wave. In this case, the “No Trespassing!” sign is at 4098.25, the end of the 1st wave, That level is shown on the chart as a blue dotted line.
The present upward correction should have five subwaves within its final wave. I count four, with the final wave perhaps about to begin.
What are the alternatives? There are no viable alternatives at this point, but there are two points of ambiguity.
One is the relationship between the S&P 500 futures and the S&P 500 index. The index moves in one-cent increments. The futures are priced in 25-cent increments. A 25:1 ratio is a huge difference, and it’s quite possible for the futures to exceed the uppwer boundary wile the index remains below. The “No Trespassing!” sign for the index is at 4095.01 (was incorrectly written as 4049.14). Since the futures and the index are in based on the same collection of blue-chip stocks, I find it unthinkable for the two products to have different analyses. If it happens, it will have to be resolved. One way is through a re-analysis of the chart. Another way is through the passage of time, since I’ve found such ambiguities will resolve themselves, as the two charts move back into alignnment.
The other point of ambiguity is where the correction should be placed in relation to the much larger downtrend that began on February 2. The relative size between waves is called the wave’s degree. I show the upward correction to be five degrees below the February 2 downtrend, but it could be a larger degree. While wave counts tend to be obvious, the degree placement is always somewhat ambiguous, especially in the early stages of the larger wave, which is the case on this chart.
Reading the chart. Elliott wave analysis views the chart as a complex structure of smaller waves nested within larger waves, which in turn are nested within still larger waves. My labeling system assigns numbers to the subwaves of trending waves, and letters to the subwaves of corrections. Each number or letter is followed by a subscript, in curly brackets, showing the waves position within the complex structure, called its “degree” in Elliott wave parlance. The smaller the number, the lower the degree. On this chart we’re dealing with relatively small waves, so the degree numbers are negative.
[This morning’s analysis]
[S&P 500 E-mini futures at 9:35 a.m., hourly bars, with volume]
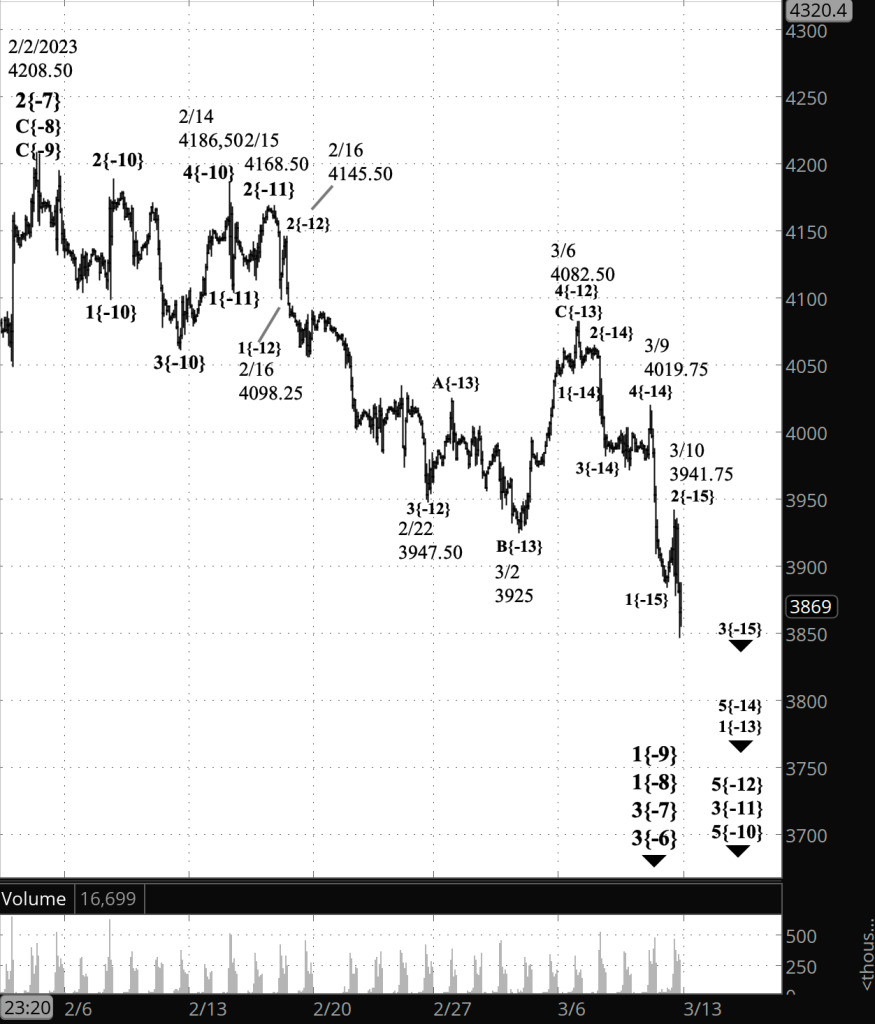
What does Elliott wave theory say? [This morning’s analysis] These are the waves that are I’m keeping a close eye on.
Principal analysis:
- The downward correction that began on February 2, wave 3{-7}, continues.
- It is in the first of five subwaves, wave 1{-8}.
- Within wave 1{-8}, wave 1{-9} is underway and is in the final subwave within a five-wave structure, downtrending wave 5{-10}.
- Wave 5{-10}, in turn, is in its middle wave, 3{-11}.
- Wave 3{-11}’s middle wave, wave 3{-12}, ended on February 22, and the next-to-the-last wave, an upward correction, wave 4{-12}, is now underway.
- Internally, wave 4{-12} is in its final wave of three, C{-13}.
- Wave C{-13} will have five waves internally, appears to have just completed wave C{-14} and may have completed wave D{-14} and to have launched its final wave, E{-14}, which will complete the parent wave, C{-13}.
- The end of wave C{-13} will be the end of the correction, wave 4{-12}, which will be followed by wave 5{-12}, which will mark the end of wave 3{-11}, a subwave of downtrending wave 5{-10}.
- The end of wave 5{-12} will also be the end of wave 3{-11}, a subwave of downtrending wave 5{-10}.
- When wave 5{-10} is complete, it will also mark the end of wave 1{-9} and the beginning of a low-degree upward correction, wave 2{-9}.
- Wave 3{-7} is still taking its tentative first steps and will develop into a powerful downtrend that will carry the price below 3502, the starting point of the preceding upward correction, wave 2{-7}, and most likely significantly below that level.
How high can it go: Here’s the Elliott wave nomenclature for the possible endpoints of wave 4{-12}.
- At the most, 4098.25, the “No Trespssing!” level that marks the end of wave 1{-12} within wave 3{-11} within wave 5{-10}.
- Possibly in the vicinity of 4023.14, the 38.2% Fibonacci retracement level.
- Typically, no higher than 4034.25, the peak of the wave 4{-13} within wave 3{-12} within wave 3{-11}.
We Are Here.
These are the waves currently in progress under my principal analysis. Each line on the list shows the wave number, with the subscript in curly brackets, the traditional degree name, the starting date, the starting price of the S&P 500 E-mini futures, and the direction of the wave.
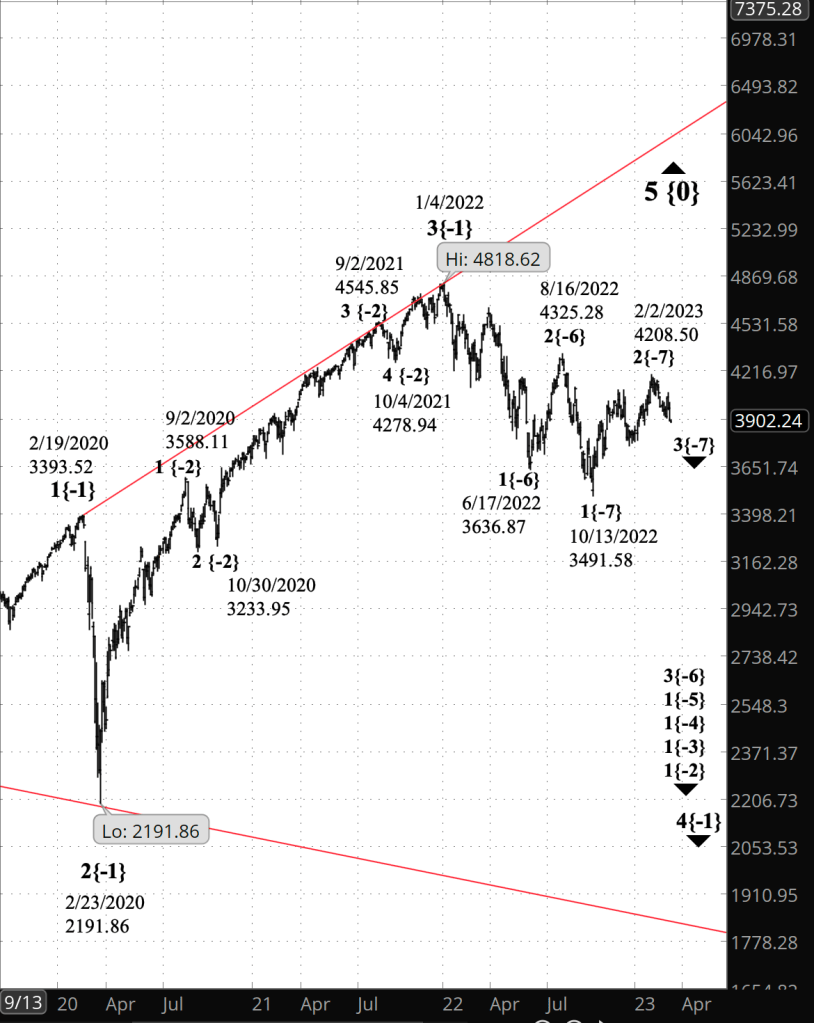
- S&P 500 Index:
- 5{+3} Supercycle, 7/8/1932, 4.40 (up)
- 5{+2} Cycle, 12/9/1974, 60.96 (up)
- 5{+1} Primary, 3/6/2009, 666.79 (up)
- 5{0} Intermediate, 12/26/2018, 2346.58 (up)
- S&P 500 Futures and index:
- 4{-1} Minor, 1/4/2022, 4808.25 (down) (futures), 4818.62 (down) (index)
- S&P 500 Futures:
- 1{-2} Minute, 1/4/2022, 4808.25 (down)
- 1{-3} Minuette, 1/4/2022, 4808.25 (down)
- 1{-4} Subminuette, 1/4/2022, 4808.25 (down)
- 1{-5} Micro, 1/4/2022, 4808.25 (down)
- 3{-6} Submicro, 8/16/2022, 4327.50 (down)
- 3{-7} Minuscule, 2/2/2023, 4208.50 (down)
Learning and other resources. Elliott wave analysis provides context, not prophecy. As the 20th century semanticist Alfred Korzybski put it in his book Science and Sanity (1933), “The map is not the territory … The only usefulness of a map depends on similarity of structure between the empirical world and the map.” And I would add, in the ever-changing markets, we can judge that similarity of structure only after the fact.
See the menu page Analytical Methods for a rundown on where to go for information on Elliott wave analysis.
By Tim Bovee, Portland, Oregon, March 6, 2023
Disclaimer
Tim Bovee, Private Trader tracks the analysis and trades of a private trader for his own accounts. Nothing in this blog constitutes a recommendation to buy or sell stocks, options or any other financial instrument. The only purpose of this blog is to provide education and entertainment.
No trader is ever 100 percent successful in his or her trades. Trading in the stock and option markets is risky and uncertain. Each trader must make trading decisions for his or her own account, and take responsibility for the consequences.
License

All content on Tim Bovee, Private Trader by Timothy K. Bovee is licensed under a Creative Commons Attribution-ShareAlike 4.0 International License.
Based on a work at www.timbovee.com.


You must be logged in to post a comment.