Trader’s Notebook

3:30 p.m. New York time

Half an hour before the closing bell. So far during the session, the S&P 500 futures have dropped into the 4020s and risen back in the 4060s. The ups and downs of the last few days have centered on the 61.8% Fibonacci retracement level, meaning that the upward correction has taken back about that much of the downtrend that preceded it. In Elliott wave terminology, wave 2{-9} — the upward correction — has retraced +/- 61.8% of wave 1{-9} — the preceding downtrend.

I’ve drawn a Fibonacci ladder on the chart in read, showing the retracement levels. A 61.8% retracement is a common reversal point for corrections, and the fact that the retracement has reached that level and stalled lends credence to Alternative Analysis #2, that the correction is reaching an end.

I’m not yet ready to buy into that interpretation of the chart. Nonetheless, it’s a strong competitor with my principal analysis, which has the uptrend still underway and in its first leg.

I’ve updated the chart.

9:35 a.m. New York time

What’s happening now? The S&P 500 E-mini futures whipsawed after the 4th quarter GDP was released, ending by rising into the 4060s, to a new high for January.

What does it mean? The inflation metric in the GDP report came in at +3.2% compared to the consensus expectation of +4.3%. The chart analysis remains unchanged: An upward correction that began on December 22, 2022 continues and is in its first segment.

What are the alternatives? Also unchanged.

Alternative #1: The first segment ended at today’s high.

Alternative #2: The third and final segment ended at today’s high, and with it the entire upward correction. 

[S&P 500 E-mini futures at 3:30 p.m., 4-hour bars, with volume]

What does Elliott wave theory say? The upward correction is wave 2{-9}. The three scenarios in today’s principal analysis plus the two alternatives differ in their wave labeling within waver 2{-9}.

  • Principal analysis: Upward wave A{-10} is still underway.
  • Alternative #1: Wave A{-10} ended today and downward wave B{-10} has begun.
  • Alternative #2: Rising wave C{-10}, the final wave in the corrective pattern, ended today, also bringing wave 2{-9} to an end. Downtrending wave 3{-9} has begun and will carry the price below 3785.50 — the starting point of wave 2{-9} — and potentially much lower.

We Are Here.

These are the waves currently in progress under my principal analysis. Each line on the list shows the wave number, with the subscript in curly brackets, the traditional degree name, the starting date, the starting price of the S&P 500 E-mini futures, and the direction of the wave.

  • S&P 500 Index:
  • 5{+3} Supercycle, 7/8/1932, 4.40 (up)
  • 5{+2} Cycle, 12/9/1974, 60.96 (up)
  • 5{+1} Primary, 3/6/2009, 666.79 (up)
  • 5{0} Intermediate, 12/26/2018, 2346.58 (up)
  • 4{-1} Minor, 1/4/2022 4818.62 (down)
  • 1{-2} Minute, 1/4/2022 4818.62 (down)
  • S&P 500 Futures and index:
  • 1{-3} Minuette, 1/4/2022, 4808.25 (down) (futures), 4818.62 (down) (index)
  • S&P 500 Futures:
  • 1{-4} Subminuette, 1/4/2022, 4808.25 (down)
  • 1{-5} Micro, 1/4/2022, 4808.25 (down)
  • 3{-6} Submicro, 8/16/2022, 4327.50 (down)
  • 3{-7} Minuscule, 12/13/2022, 4110 (down)
  • 1{-8} Subminuscule, 12/13/2022, 4110 (down)

Learning and other resources. Elliott wave analysis provides context, not prophecy. As the 20th century semanticist Alfred Korzybski put it in his book Science and Sanity (1933), “The map is not the territory … The only usefulness of a map depends on similarity of structure between the empirical world and the map.” And I would add, in the ever-changing markets, we can judge that similarity of structure only after the fact.

See the menu page Analytical Methods for a rundown on where to go for information on Elliott wave analysis.

By Tim Bovee, Portland, Oregon, January 26, 2023

Disclaimer

Tim Bovee, Private Trader tracks the analysis and trades of a private trader for his own accounts. Nothing in this blog constitutes a recommendation to buy or sell stocks, options or any other financial instrument. The only purpose of this blog is to provide education and entertainment.

No trader is ever 100 percent successful in his or her trades. Trading in the stock and option markets is risky and uncertain. Each trader must make trading decisions for his or her own account, and take responsibility for the consequences.

License
Creative Commons License

All content on Tim Bovee, Private Trader by Timothy K. Bovee is licensed under a Creative Commons Attribution-ShareAlike 4.0 International License.

Based on a work at www.timbovee.com.

Trader’s Notebook

3:30 p.m. New York time

Half an hour before the closing bell. The S&P futures price continued to fall early in the session, to 3963.25, and the reversed, rising so far into the 4030s. No change in the analysis. I’ve updated the chart.

9:35 a.m. New York time

What’s happening now? The S&P 500 E-mini futures fell in overnight trading, reaching 3980.

What does it mean? An upward correction that began on December 22, 2022 is underway and is in its first of three segments. When the present first segment is complete, it will be followed by a declining second segment, and then by a third segment that once again pushes to the upside.

This principal analysis is based on a count that sees the first segment as having completed three of five subwaves.

What are the alternatives? I’m finding a lot of ambiguity in this chart, which has led to a several alternatives. The lower the price goes, the more likely one of the alternatives becomes.

Alternative #1: The first segment ended at the January 23 high, 4056.75. This scenario is based on a count of five complete subwaves, the expected count within the first wave within a Zigzag corrective pattern. This alternative requires that the price remain above 3785.50, the starting point of the upward correction.

Alternative #2: The third and final segment ended at the January 23 high, and with it the entire upward correction. The internal count since the correction began can be viewed as three complete subwaves. This scenario will be confirmed if the price moves below 3785.50, the starting point of the upward correction.

Chart notes. Segments, called “waves” in Elliott wave analysis, are labeled on the chart with numbers if they occur within trending waves and letters if they’re within corrective waves. The analysis is based on an understanding that no wave stands alone. Each wave is part of a larger wave and in turn contains smaller waves, all of which form the same sorts of patterns and follow the same rules. Each wave has a place within the hierarchy of nested waves, called a fractal hierarchy. I show the relative position of each wave with a subscript, contained within curly brackets, following the wave number. The smaller the subscript number, the lower in the hierarchy the wave.

The chart shows the S&P 500 futures from September 15, 2022 to the present.

[S&P 500 E-mini futures at 3:30 p.m., 4-hour bars, with volume]

What does Elliott wave theory say? Here are the waves of the principal analysis and each alternative.

For all analyses, the upward correction is wave 2{-9}.

Principal analysis:

  • Wave 2{-9} is in its first subwave, rising wave A{-10}. When complete, it will be followed by declining wave B{-10}.

Alternative #1:

  • Wave A{-10} ended on January 23 at 4056.75 and declining wave B{-10} is underway. It will be followed by rising wave C{-10}, which will complete the wave 2{-9} upward correction.

Alternative #2:

  • Wave C{-10} ended on January 23, and with it, the upward correction, wave 2{-9}. The decline that followed is downtrending wave 3{-9}, which will carry the price below 3785.50, the beginning of the upward correction, and most likely significantly below that level.

All scenarios are part of a larger set of waves:

  • The upward correction, wave 2{-9}, is a subwave of downtrending wave 1{-8}, which began on December 13, 2022 from 4110.
  • Wave 1{-8} is in turn a subwave of a series of declining waves, up to wave 4{-1}, which began on January 4, 2022 from 4808.25, the point where the present long-running bear market began.
  • Wave 4{-1} is the next to the last wave within an expanding Diagonal Triangle that began on December 26, 2018. When the wave 4{-1} decline is complete, it will be followed by rising wave 5{-1}, which will carry the price above the January 4 high, 4808.25, and perhaps significantly above that level.

We Are Here.

These are the waves currently in progress under my principal analysis. Each line on the list shows the wave number, with the subscript in curly brackets, the traditional degree name, the starting date, the starting price of the S&P 500 E-mini futures, and the direction of the wave.

  • S&P 500 Index:
  • 5{+3} Supercycle, 7/8/1932, 4.40 (up)
  • 5{+2} Cycle, 12/9/1974, 60.96 (up)
  • 5{+1} Primary, 3/6/2009, 666.79 (up)
  • 5{0} Intermediate, 12/26/2018, 2346.58 (up)
  • 4{-1} Minor, 1/4/2022 4818.62 (down)
  • 1{-2} Minute, 1/4/2022 4818.62 (down)
  • S&P 500 Futures and index:
  • 1{-3} Minuette, 1/4/2022, 4808.25 (down) (futures), 4818.62 (down) (index)
  • S&P 500 Futures:
  • 1{-4} Subminuette, 1/4/2022, 4808.25 (down)
  • 1{-5} Micro, 1/4/2022, 4808.25 (down)
  • 3{-6} Submicro, 8/16/2022, 4327.50 (down)
  • 3{-7} Minuscule, 12/13/2022, 4110 (down)
  • 1{-8} Subminuscule, 12/13/2022, 4110 (down)

Learning and other resources. Elliott wave analysis provides context, not prophecy. As the 20th century semanticist Alfred Korzybski put it in his book Science and Sanity (1933), “The map is not the territory … The only usefulness of a map depends on similarity of structure between the empirical world and the map.” And I would add, in the ever-changing markets, we can judge that similarity of structure only after the fact.

See the menu page Analytical Methods for a rundown on where to go for information on Elliott wave analysis.

By Tim Bovee, Portland, Oregon, January 25, 2023

Disclaimer

Tim Bovee, Private Trader tracks the analysis and trades of a private trader for his own accounts. Nothing in this blog constitutes a recommendation to buy or sell stocks, options or any other financial instrument. The only purpose of this blog is to provide education and entertainment.

No trader is ever 100 percent successful in his or her trades. Trading in the stock and option markets is risky and uncertain. Each trader must make trading decisions for his or her own account, and take responsibility for the consequences.

License
Creative Commons License

All content on Tim Bovee, Private Trader by Timothy K. Bovee is licensed under a Creative Commons Attribution-ShareAlike 4.0 International License.

Based on a work at www.timbovee.com.

Trader’s Notebook

3:30 p.m. New York time

Half an hour before the closing bell. The S&P500 has traded in a narrow range during the session, with the futures rising from the early session low, 4005.25, back into the 4040s. The upward correction that began on December 22, 2022 continues, and the price has remained below the correction’s high, 4056.75, attained on January 23. I’ve updated the chart below

9:35 a.m. New York time

What’s happening now? The S&P 500 E-mini futures continued to fall in overnight trading, reaching a low so far of 4012.25.

What does it mean? An upward correction that began on December 22, 2022 from 3785.50 continues and is in its first leg.

What are the alternatives?

Alternative #1: The first leg of the correction ended on the January 23 high, 4056.75, and the second leg has begun.

Alternative #2: The first leg ended on the January 17 high, the second leg on the January 18 low. Under this scenario, the final leg of the correction is either underway or ended today.

[S&P 500 E-mini futures at 3:30 p.m., 4-hour bars, with volume]

What does Elliott wave theory say? Here are the waves I’m tracking today for the principal analysis.

  • The upward correction that began on December 22, 2022 is wave 2{-9}.
  • That wave is in its first subwave, wave A{-10}.

Under Alternative #1,

  • Downward wave B{-10} within the upward correction, wave 2{-9}, is underway.

Under Alternative #2,

  • Wave B{-10} within the upward correction ended at the January 18 low.
  • The final wave of the correction, upward wave C{-10}, is underway.

Under all three analyses,

  • All of that is happening within downtrending wav 1{-8}.
  • The downtrend is a subwave of a series of larger downtrends, reaching in size up to wave 4{-1}, which began on January 4, 2022 from 4808.25.

We Are Here.

These are the waves currently in progress under my principal analysis. Each line on the list shows the wave number, with the subscript in curly brackets, the traditional degree name, the starting date, the starting price of the S&P 500 E-mini futures, and the direction of the wave.

  • S&P 500 Index:
  • 5{+3} Supercycle, 7/8/1932, 4.40 (up)
  • 5{+2} Cycle, 12/9/1974, 60.96 (up)
  • 5{+1} Primary, 3/6/2009, 666.79 (up)
  • 5{0} Intermediate, 12/26/2018, 2346.58 (up)
  • 4{-1} Minor, 1/4/2022 4818.62 (down)
  • 1{-2} Minute, 1/4/2022 4818.62 (down)
  • S&P 500 Futures and index:
  • 1{-3} Minuette, 1/4/2022, 4808.25 (down) (futures), 4818.62 (down) (index)
  • S&P 500 Futures:
  • 1{-4} Subminuette, 1/4/2022, 4808.25 (down)
  • 1{-5} Micro, 1/4/2022, 4808.25 (down)
  • 3{-6} Submicro, 8/16/2022, 4327.50 (down)
  • 3{-7} Minuscule, 12/13/2022, 4110 (down)
  • 1{-8} Subminuscule, 12/13/2022, 4110 (down)

Learning and other resources. Elliott wave analysis provides context, not prophecy. As the 20th century semanticist Alfred Korzybski put it in his book Science and Sanity (1933), “The map is not the territory … The only usefulness of a map depends on similarity of structure between the empirical world and the map.” And I would add, in the ever-changing markets, we can judge that similarity of structure only after the fact.

See the menu page Analytical Methods for a rundown on where to go for information on Elliott wave analysis.

By Tim Bovee, Portland, Oregon, January 24, 2023

Disclaimer

Tim Bovee, Private Trader tracks the analysis and trades of a private trader for his own accounts. Nothing in this blog constitutes a recommendation to buy or sell stocks, options or any other financial instrument. The only purpose of this blog is to provide education and entertainment.

No trader is ever 100 percent successful in his or her trades. Trading in the stock and option markets is risky and uncertain. Each trader must make trading decisions for his or her own account, and take responsibility for the consequences.

License
Creative Commons License

All content on Tim Bovee, Private Trader by Timothy K. Bovee is licensed under a Creative Commons Attribution-ShareAlike 4.0 International License.

Based on a work at www.timbovee.com.

Trader’s Notebook

3:30 p.m. New York time

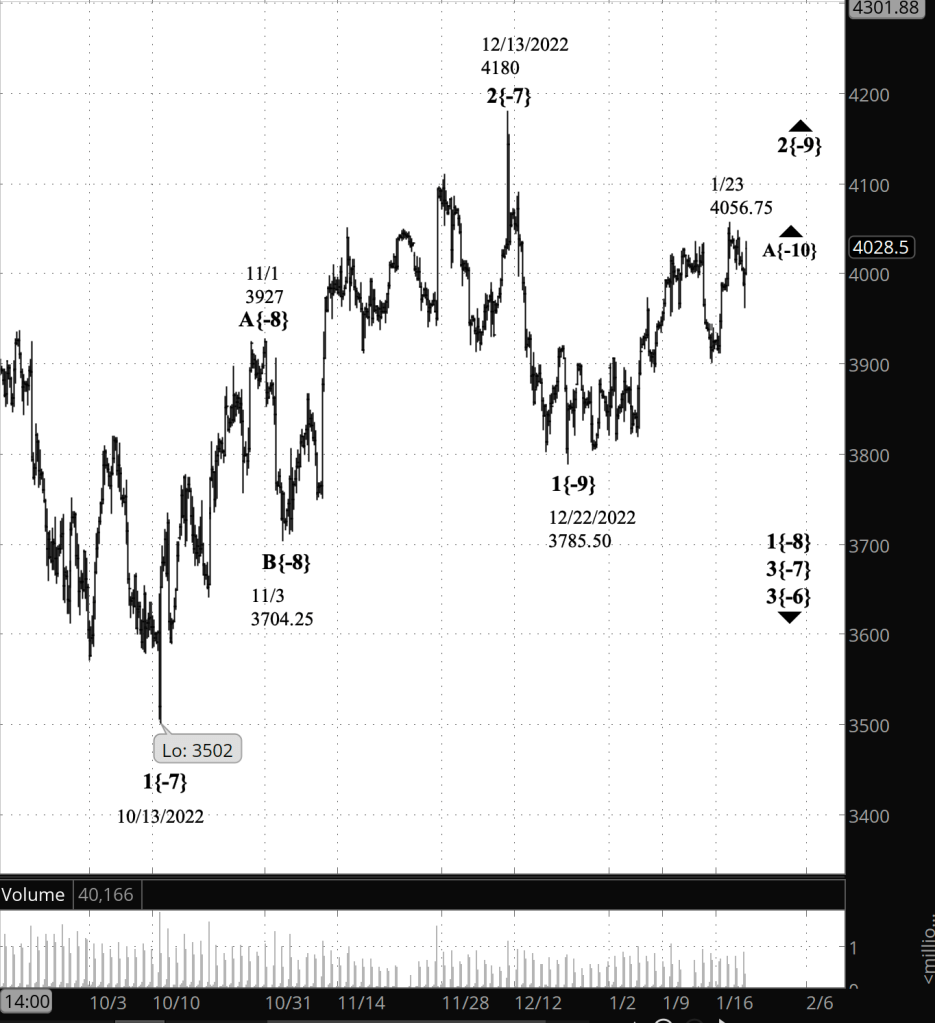
Half an hour before the closing bell. The futures moved a few points higher after my 1:20 p.m. reanalysis, peaking at 4056.75 and then declining sharply, back into the 4020s. It’s possible, although not a certainty, that the peak marked the end of wave A{-10}, the first segment of an upward correction, wave 2{-9}, that began on January 22.

An alternative reading sees today’s peak as being the end of wave 2{-9}, the entire upward correction.

If wave 2{-9} is still underway, then we’ll see more upward movement, followed by a downward retracement, and then a final push to the upside.

If wave 2{-9} ended at today’s peak, then downtrending wave 3{-9} is underway and will carry the price below 3778.50, the starting point of wave 2{-9}, and most likely significantly below that level.

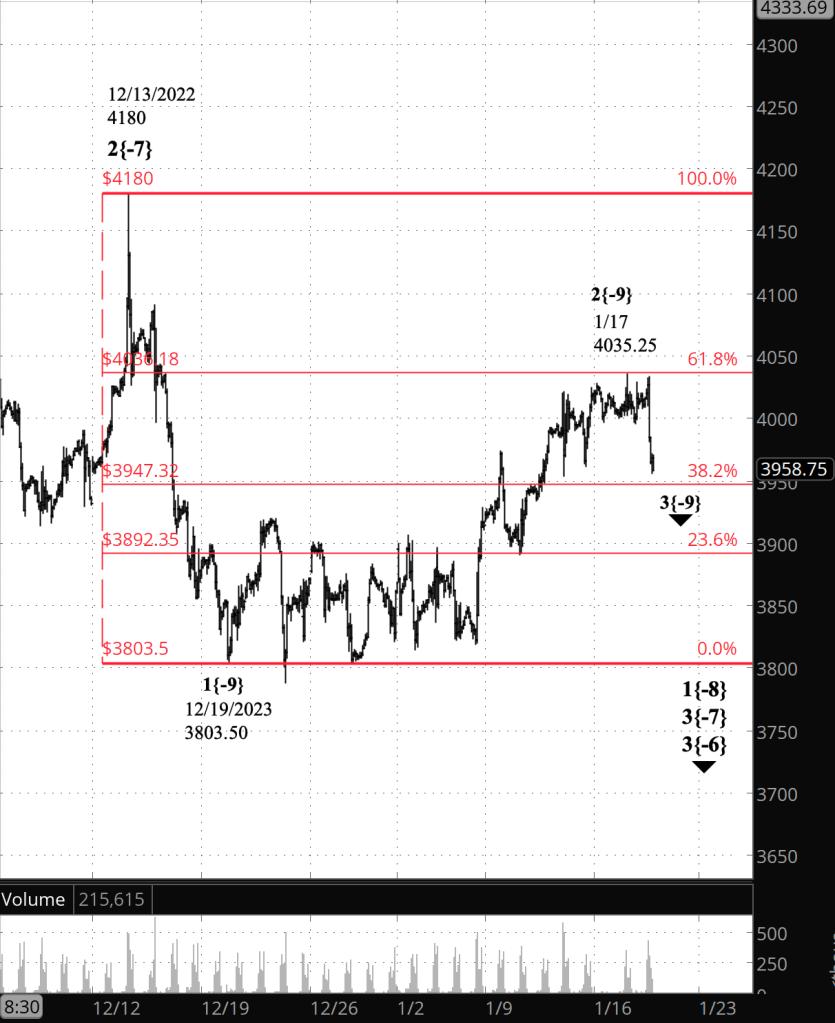
No change in the afternoon reanalysis. I’ve updated the upper chart.

1:20 p.m. New York time

This morning’s analysis? Invalidated. The S&P 500 futures, in an upward correction, has risen sharply during the session, reaching into the 4050s. The rapid movement breezed beyond the starting point of the downtrend that began on January 17 on 4035.25.

The upward correction is a 2nd wave within the five waves that make up a downtrend.

Under the rules Elliott wave analysis, if a rise marked as the 2nd wave on a chart moves above the start point of preceding 1st wave, then it’s not a 2nd wave and the analysis must be redone. And that’s the chore than I’m undertaking now.

All of this is happening within a larger downtrend, wave 3{-7}, which began on December 13 from 4180. If the price moves above 4180, then this analysis will also be invalidated.

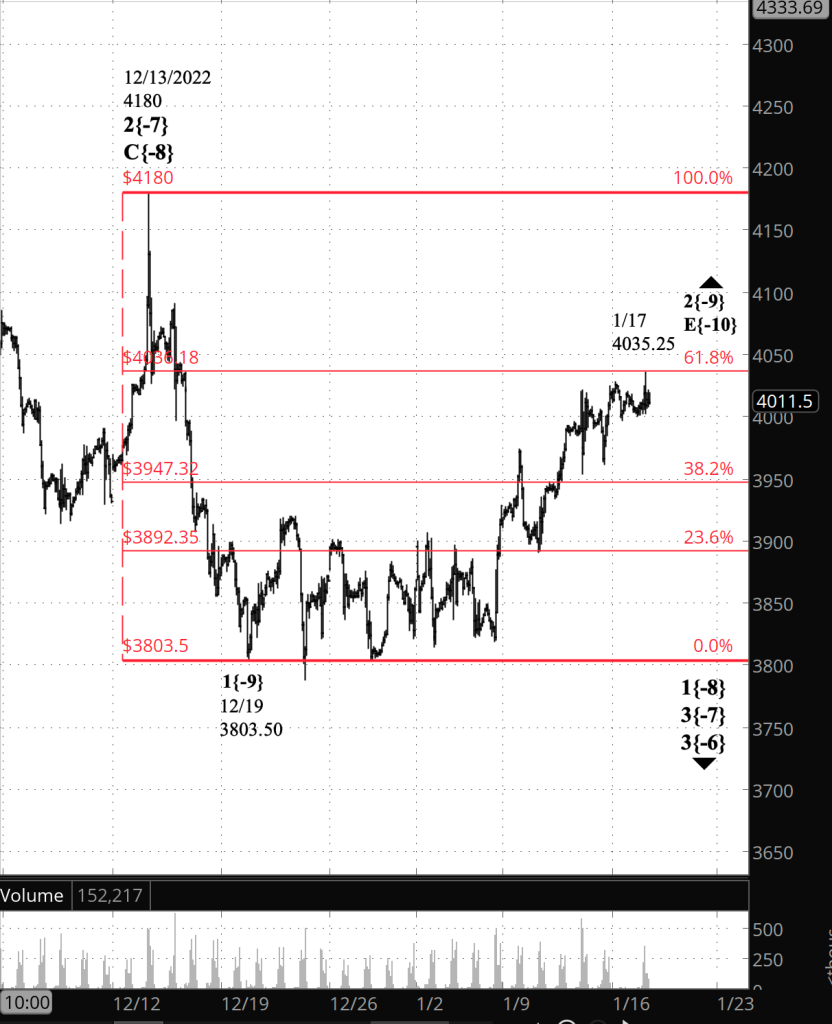
From this point I’ll use Elliott wave terminology. See this morning’s Chart Note below for a brief explanation. First, the new chart. I’ll retain the old chart from this morning for comparison.

[S&P 500 E-mini futures at 3:30 p.m., 4-hour bars, with volume]

The upward correction under the new analysis is wave 2{-9}. That’s one degree higher than the label on this morning’s chart, which was 2{-10}.

Wave 2{-9} is correcting the preceding wave 1{-9], which began at the same point as the parent wave, 1{-8}, at 4180. Under the rules and patterns of Elliott wave analysis, wave 2{-9} can be expected to stay below 4180, the 1st wave’s starting point.

Internally, wave 2{-9} commonly can take the form of a Zigzag, with five subwaves in the first wave of the correction, waved A{-10}, or of a Flat, with three subewaves in the correction’s first subwave. The wave count within wave 2{-9} is a bit messy, but I think wave A{-10} is in its 5th wave, which would make the pattern a Zigzag, the form most office seen within 2nd waves.

A note on the analysis.

This is the first time I’ve had to change analyses twice in a single day. It’s a stern reminder of an important truth about Elliott wave analysis: It doesn’t predict the future. It places context around the present so that we can understand the possible futures.

9:35 a.m. New York time

Note: The following analysis has been invalidated by later events. The revised analysis can be read above, at the 1:20 p.m. update.

What’s happening now? The S&P 500 E-mini futures hit 4000 in overnight trading.

What does it mean? The rise invalidated Friday’s analysis and I’ve redone the chart. Under the revised principal analysis, the first wave within a downtrend that began on January 17 ended on January 19 at 3901.75. The price then rose in the first of two upward corrections within the trend. The correction is in its first wave.

See the Elliott wave theory section below for more on why Friday’s analysis is no longer valid.

What are the alternatives? The two alternative analyses listed on on Friday remain possibilities.

  • Alternative #1: The final wave of the upward correction continues, and the decline that began on January 17 is a downward movement within the correction.
  • Alternative #2: The correction is taking a compound form, containing two or three corrective patterns. The first corrective pattern ended on January 17, and a second pattern will begin once the present decline, linking the two patterns, is complete.

Chart note. R.N. Elliott, as he was doing the research in the 1930s that became Elliott wave analysis, called directional price movements “waves”. As he studied the charts, he realized that he wasn’t just seeing a simple meandering of prices, a walk, random or purposeful, but that the waves formed patterns within a complex structure. He came to understand that smaller waves were contained within larger ones, which in turn were contained within still larger ones. And the smaller waves contained still smaller ones. Such a nested structure today is called a fractal structure.

In labeling a chart, the analyst must show two items: The number of the wave, or its letter if its within a correction, and the placement of that wave within the fractal hierarchy, called its “degree”. Elliott chose to give names to degrees. I find that there’s greater clarity to be had if the degrees are numbered, using subscripts which, for greater visibility, I’ve placed within curly brackets.

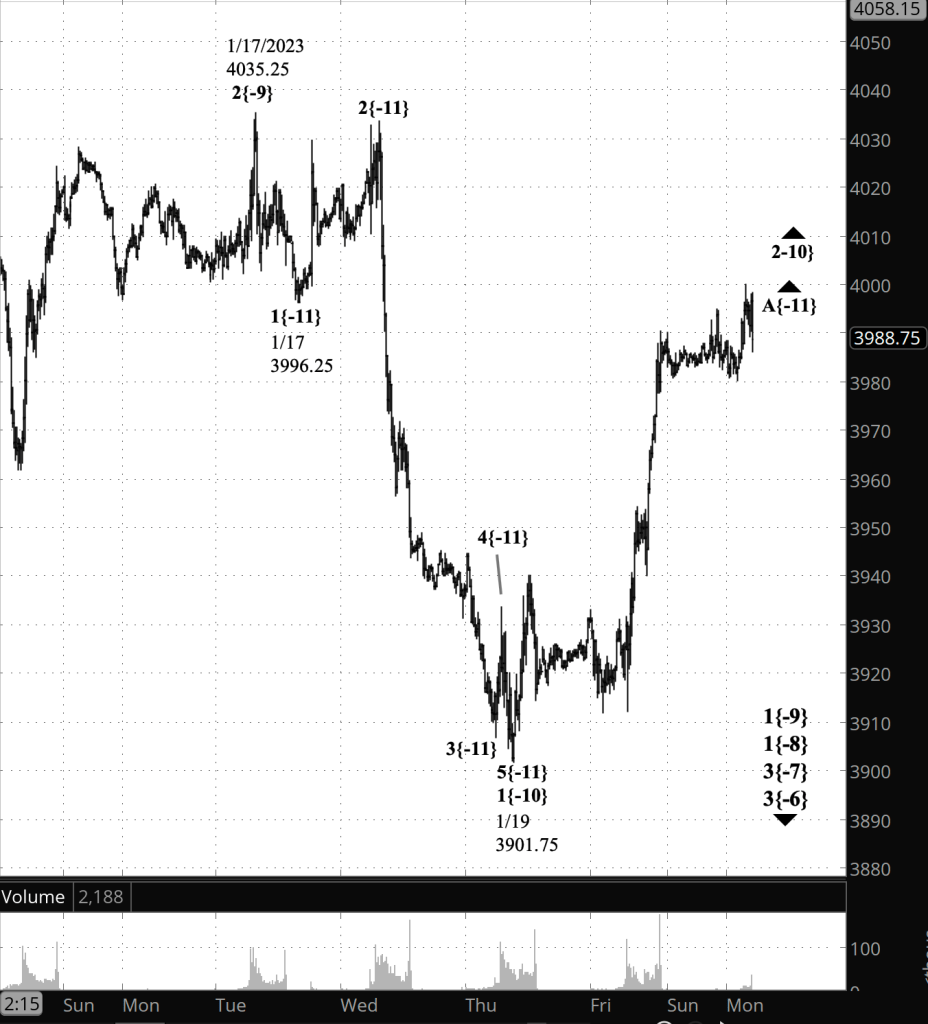
The chart below covers the S&P 500 futures from January 13 to the present, a span of 10 days.

[INVALIDATED: S&P 500 E-mini futures at 9:35 a.m., 15-minute bars, with volume]

What does Elliott wave theory say? An attractive characteristic of Elliott wave analysis is that, although it has rules, there aren’t a lot of them. And when later events on the chart invalidate an analysis by breaking it a rule, it must be taken seriously.

The rule that invalidated Friday’s analysis is that a 4th wave correction cannot move beyond the end of the preceding wave. That is, it can’t enter the territory of the preceding 2nd wave.

The 1st wave in question, wave 1{-11}, ended on January 17 at 3996.25, and subsequent prices above that point are part of wave 2{-11}.

Wave 4{-11}, in overnight trading on January 23, move above that price. That violates a rule of Elliott wave analysis: If wave 4 moves beyond the end of wave 1, then it’s not a 4th wave.

In reanalyzing the chart, I saw that wave 3{-11} could well have ended prior to the January 19 low. On Friday I labeled that low point as the end of wave 3{-11}. I changed the analysis to show wave 3{-11} ending earlier, and labeled the low point as the end of wave 5{-11}.

That change brought to an end wave 1{-10}, the first wave of the downtrend that began on January 17. The rise that followed is wave 2{-10}, which isn’t bound by the rule violated by events after the earlier analysis.

Here are the waves under the principal analysis that I’m following today:

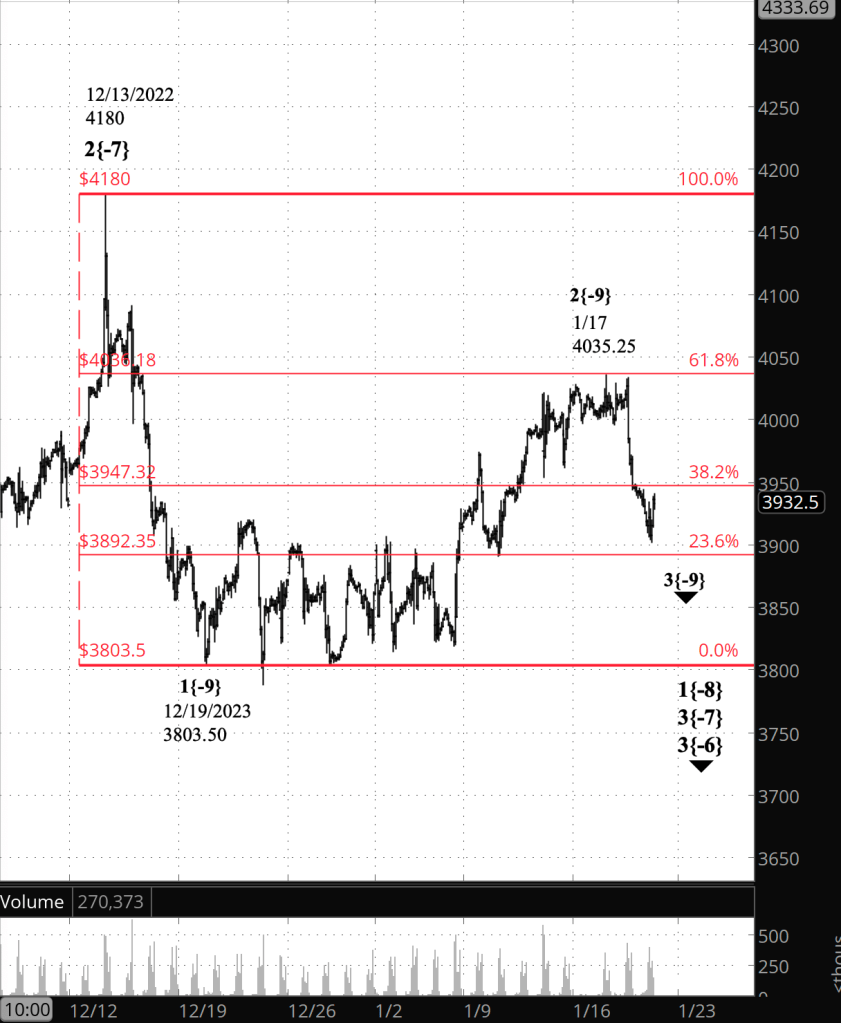
  • A downtrend that encompasses everything I’ve described so far is wave 3{-9}, which began on January 17 from 4035.25.
  • Wave 3{-9}, like all trending waves, will have five waves internally — three in the direction of the trend and two corrections.
  • Wave 2{-10}, the first upward correction, began on January 19 from 3901.75.
  • Internally, wave 2{-10} is in its first subwave, wave A{-11}.

For both alternatives, wave 3{-9} has not yet begun. The upward correction preceding it is still underway, wave 2{-9}, which began on December 19, 2022.

  • In Alternative #1, the decline is a downward wave within wave E{-10}, the final subwave within wave 2{-9}.
  • In Alternative #2, the decline is wave X{-10}, connecting the first corrective pattern within wave 2{-9} with a second corrective pattern that will follow.

For both the principal analysis and the alternatives.

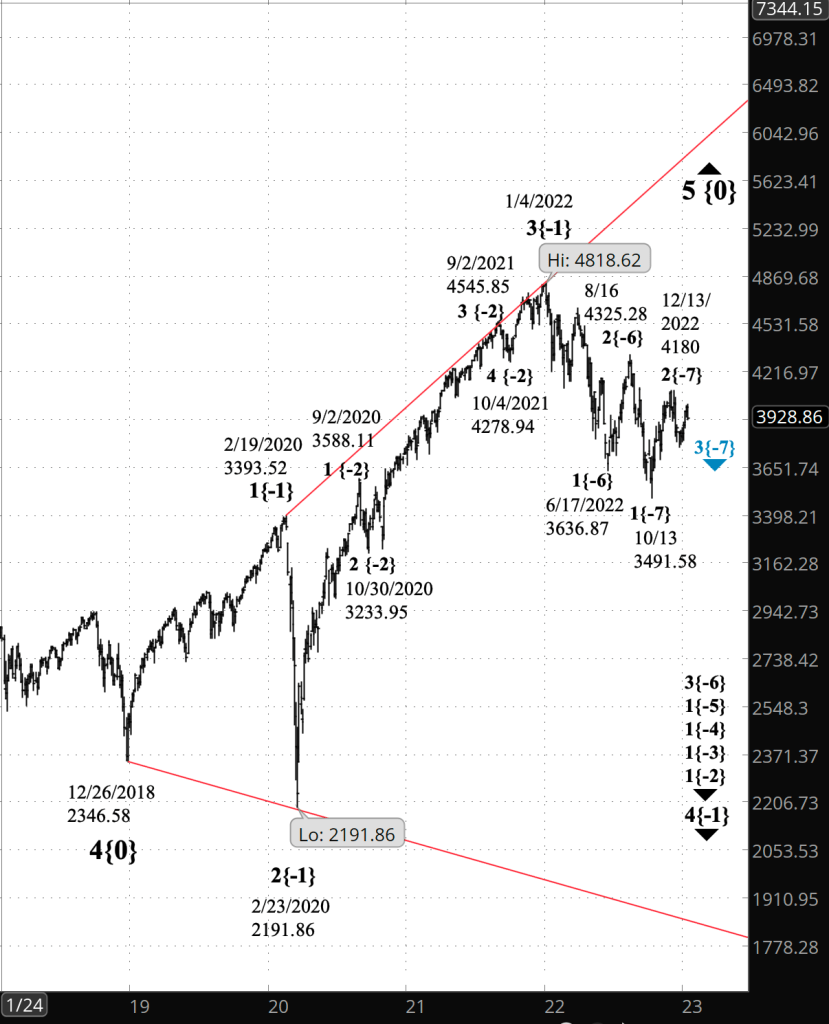
  • Waves 3{-9} and 2{-9} are subwaves of downtrending wave 1{-8}, which began on December 13, 2022 from 4110.
  • Wave 1{-8} is a subwave of a series of nested downtrending waves reaching up seven levels to wave 4{-1}, which began on January 4, 2022 from 4808.25.

We Are Here.

These are the waves currently in progress under my principal analysis. Each line on the list shows the wave number, with the subscript in curly brackets, the traditional degree name, the starting date, the starting price of the S&P 500 E-mini futures, and the direction of the wave.

  • S&P 500 Index:
  • 5{+3} Supercycle, 7/8/1932, 4.40 (up)
  • 5{+2} Cycle, 12/9/1974, 60.96 (up)
  • 5{+1} Primary, 3/6/2009, 666.79 (up)
  • 5{0} Intermediate, 12/26/2018, 2346.58 (up)
  • 4{-1} Minor, 1/4/2022 4818.62 (down)
  • 1{-2} Minute, 1/4/2022 4818.62 (down)
  • S&P 500 Futures and index:
  • 1{-3} Minuette, 1/4/2022, 4808.25 (down) (futures), 4818.62 (down) (index)
  • S&P 500 Futures:
  • 1{-4} Subminuette, 1/4/2022, 4808.25 (down)
  • 1{-5} Micro, 1/4/2022, 4808.25 (down)
  • 3{-6} Submicro, 8/16/2022, 4327.50 (down)
  • 3{-7} Minuscule, 12/13/2022, 4110 (down)
  • 1{-8} Subminuscule, 12/13/2022, 4110 (down)

Learning and other resources. Elliott wave analysis provides context, not prophecy. As the 20th century semanticist Alfred Korzybski put it in his book Science and Sanity (1933), “The map is not the territory … The only usefulness of a map depends on similarity of structure between the empirical world and the map.” And I would add, in the ever-changing markets, we can judge that similarity of structure only after the fact.

See the menu page Analytical Methods for a rundown on where to go for information on Elliott wave analysis.

By Tim Bovee, Portland, Oregon, January 23, 2023

Disclaimer

Tim Bovee, Private Trader tracks the analysis and trades of a private trader for his own accounts. Nothing in this blog constitutes a recommendation to buy or sell stocks, options or any other financial instrument. The only purpose of this blog is to provide education and entertainment.

No trader is ever 100 percent successful in his or her trades. Trading in the stock and option markets is risky and uncertain. Each trader must make trading decisions for his or her own account, and take responsibility for the consequences.

License
Creative Commons License

All content on Tim Bovee, Private Trader by Timothy K. Bovee is licensed under a Creative Commons Attribution-ShareAlike 4.0 International License.

Based on a work at www.timbovee.com.

Trader’s Notebook

3:30 p.m. New York time

Half an hour before the closing bell. The S&P 500 has pushed higher during the session, reaching the 3980s on the futures as the closing bell approached. No change in the analysis. A downtrend, wave 3{-9}, began on January 17 and internally is in the midst of an upward correction.

The alternative analyses have the larger upward correction, waved 2{-9}, as still underway, and the higher the prices rises, the more likely one of the alternatives is correct.

I’ve updated the chart.

9:35 a.m. New York time

What’s happening now? The S&P 500 E-mini futures traded in a narrow range overnight, from the 3910s to the 3930s

What does it mean? Internally, the downtrend that began on January 17 is in a small upward correction, which will soon be complete and will be followed by further decline.

What are the alternatives? Unchanged from yesterday, both alternatives assume that the upward correction that began on December 19, 2022 is still underway.

  • Alternative #1: The final wave of the upward correction continues, and the decline that began on January 17 is a downward movement within the correction.
  • Alternative #2: The correction is taking a compound form, containing two or three corrective patterns. The first corrective pattern ended on January 17, and a second pattern will begin once the present decline, linking the two patterns, is complete.

[S&P 500 E-mini futures at 3:30 p.m., 90-minute bars, with volume]

What does Elliott wave theory say? Directional movements in Elliott wave analysis are called “waves”. The placement of a wave within the fractal hierarchy of a stock chart is the wave’s “degree” and is shown after the wave number or letter as a subscript, in curly brackets, showing degree number.

Here are the waves associated with the principle analysis and the alternatives.

Principle analysis:

  • The downtrend that began on January 27 is wave 3{-9}.
  • Internally it is in wave 1{-10}, which in turn is in an upward correction of smaller degree.

For both alternatives, the upward correction still underway is wave 2{-9}, which began on December 19, 2022.

  • In Alternative #1, the decline is a downward wave within wave E{-10}, the final subwave within wave 2{-9}.
  • In Alternative #2, the decline is wave X{-10}, connecting the first corrective pattern within wave 2{-9} with a second corrective pattern that will follow.

Both the principle analysis and the alternatives are subwaves of wave 1{-8}, which began on December 13, 2022 as the initial subwave of wave 3{-7}, which began on that same date.

We Are Here.

These are the waves currently in progress under my principal analysis. Each line on the list shows the wave number, with the subscript in curly brackets, the traditional degree name, the starting date, the starting price of the S&P 500 E-mini futures, and the direction of the wave.

  • S&P 500 Index:
  • 5{+3} Supercycle, 7/8/1932, 4.40 (up)
  • 5{+2} Cycle, 12/9/1974, 60.96 (up)
  • 5{+1} Primary, 3/6/2009, 666.79 (up)
  • 5{0} Intermediate, 12/26/2018, 2346.58 (up)
  • 4{-1} Minor, 1/4/2022 4818.62 (down)
  • 1{-2} Minute, 1/4/2022 4818.62 (down)
  • S&P 500 Futures and index:
  • 1{-3} Minuette, 1/4/2022, 4808.25 (down) (futures), 4818.62 (down) (index)
  • S&P 500 Futures:
  • 1{-4} Subminuette, 1/4/2022, 4808.25 (down)
  • 1{-5} Micro, 1/4/2022, 4808.25 (down)
  • 3{-6} Submicro, 8/16/2022, 4327.50 (down)
  • 3{-7} Minuscule, 12/13/2022, 4110 (down)
  • 1{-8} Subminuscule, 12/13/2022, 4110 (down)

Learning and other resources. Elliott wave analysis provides context, not prophecy. As the 20th century semanticist Alfred Korzybski put it in his book Science and Sanity (1933), “The map is not the territory … The only usefulness of a map depends on similarity of structure between the empirical world and the map.” And I would add, in the ever-changing markets, we can judge that similarity of structure only after the fact.

See the menu page Analytical Methods for a rundown on where to go for information on Elliott wave analysis.

By Tim Bovee, Portland, Oregon, January 20, 2023

Disclaimer

Tim Bovee, Private Trader tracks the analysis and trades of a private trader for his own accounts. Nothing in this blog constitutes a recommendation to buy or sell stocks, options or any other financial instrument. The only purpose of this blog is to provide education and entertainment.

No trader is ever 100 percent successful in his or her trades. Trading in the stock and option markets is risky and uncertain. Each trader must make trading decisions for his or her own account, and take responsibility for the consequences.

License
Creative Commons License

All content on Tim Bovee, Private Trader by Timothy K. Bovee is licensed under a Creative Commons Attribution-ShareAlike 4.0 International License.

Based on a work at www.timbovee.com.

Trader’s Notebook

3:30 p.m. New York time

Half an hour before the closing bell. The price of the S&P 500 futures rose during the session, working their way from the overnight low, 3906.75, to the 3940s. The rise is a low-degree upward correction within a larger downtrend. Wave 3[-9} is underway and has much farther to go. I’ve updated the upper chart, showing the futures from early December to the present.

9:35 a.m. New York time

What’s happening now? The S&P 500 E-mini futures continued to fall in overnight trading, reaching a low of 3906.75 an hour before the opening bell.

What does it mean? The initial leg of a downtrend that began on January 17 continues.

What are the alternatives? Absolute confirmation that the downtrend has begun won’t occur until the price moves below 3803.50, the starting point of the upward correction that ended on January 17. Until that happens, here are the alternatives.

  • Alternative #1: The decline now underway could be a subwave within the correction. Given the strength of the decline, I consider this alternative to be unlikely. However, a strong reversal to the upside would make this scenario more likely.
  • Alternative #2: The upward correction may form a compound structure, containing two or three corrective patterns. If this is happening, then the first corrective pattern ended on January 17 and the decline is a connector wave, linking the first pattern to the future second pattern. The upward correction was the first correction within the downtrend that began on December 13, 2022. Usually compound structures happen in the second correction. So I think this alternative is unlikely, and an upward correction would increase its likelihood.

Chart note. The accountant who developed Elliott wave analysis in the 1930s, R.N. Elliott, understood that market prices form a fractal structure, although he never used the word “fractal”. Such structures are build from components containing smaller components that are also part of still larger components. And each part of the fractal puzzle shows the same patterns all the others.

The components on market charts are directional movements in price, and Elliott called such movements “waves”.

Each wave has a place within the fractal hierarchy, large to small. I designate that place with subscripts attached to the wave numbers, each contained within curly brackets. The higher the number, the higher the wave’s location within the fractal hierarchy. That location is called the wave’s degree.

I show a Fibonacci retracement ladder on the chart, in red. It shows the upward corretion’s retracement of the preceding downtrend. Under the principal analysis, the retracement ended at the 61.8% retracement level, and the decline that followed easily broke past the 38.2% retracement and is approaching the 23.6% retracement.

[S&P 500 E-mini futures at 3:30 p.m., 90-minute bars, with volume]

What does Elliott wave theory say? Here are Elliott waves for the three possible outcomes.

Under the principal analysis,

  • The downtrend that began on January 17 is wave 3{-9}. Third waves tend to have a lot of power, and I expect wave 3{-9} to produce a significant decline.
  • Wave 3{-9} is in its first subwave, 1{-10}, which when complete, will be followed by an upward correction, wave 2{-10}.

Under Alternative #1,

  • The upward correction that began on December 19, 2022 is wave 2{-9}, and it is still underway.
  • Internally, wave 2{-9} is in its final leg, rising wave E{-10}.
  • When wave E{-10} is complete, it will also mark the end of wave 2{-9} and the start of a downtrend, wave 3{-9}.

Under Alternative #2,

  • Wave 2{-9} is forming a compound structure. Compounding is unusual in second waves, but not entirely unheard of.
  • The first correction structure ended on January 17.
  • The downtrend that has follow is a wave that will connect the completed first corrective pattern with a second corrective pattern. That wave is labeled X{-10}.

Under all of the potential analyses,

  • Wave 3{-9}, whenever it might begin, will have five subwaves of degree {-10}: Downtrending wave 1, an upward wave 2 correction, a downtrending wave 3, another upward correction labeled wave 4, and a final wave 5 push to the downside.
  • Wave 2{-9} and wave 3{-9} are subwaves of wave 1{-8}, which began on December 13 and is a subwave of wave 3{-7}, an energetic downward correction.
  • Wave 3{-7} is a subwave of a larger downtrend, wave 3{-6}.
  • Wave 3{-6} is a subwave of a series of nested first waves of increasing size, up to wave 1{-2}, which began on January 4.
  • Wave 1{-2} is a subwave of wave 4{-1}, the next to the last wave of an expanding Diagonal Triangle, wave 5{0}, that began on December 26, 2018.
  • Wave 4{-1}may eventually approach the lower boundary of the triangle, presently in the 1850s and moving lower each day.
  • Wave 4{-1} will be followed by uptrending wave 5{-1}, which will return to the upper boundary of the triangle, presently around 5900 and moving higher each day.
  • Wave 5{-1} will be the final wave of wave 5{0}, the expanding Diagonal Triangle, which will also be the end of a series of fifth waves of increasing size and will be followed by a lengthy downtrend of larger size and duration than any within the memory of anyone now living.

[S&P 500 index at 9:30 p.m., 3-day bars]

We Are Here.

These are the waves currently in progress under my principal analysis. Each line on the list shows the wave number, with the subscript in curly brackets, the traditional degree name, the starting date, the starting price of the S&P 500 E-mini futures, and the direction of the wave.

  • S&P 500 Index:
  • 5{+3} Supercycle, 7/8/1932, 4.40 (up)
  • 5{+2} Cycle, 12/9/1974, 60.96 (up)
  • 5{+1} Primary, 3/6/2009, 666.79 (up)
  • 5{0} Intermediate, 12/26/2018, 2346.58 (up)
  • 4{-1} Minor, 1/4/2022 4818.62 (down)
  • 1{-2} Minute, 1/4/2022 4818.62 (down)
  • S&P 500 Futures and index:
  • 1{-3} Minuette, 1/4/2022, 4808.25 (down) (futures), 4818.62 (down) (index)
  • S&P 500 Futures:
  • 1{-4} Subminuette, 1/4/2022, 4808.25 (down)
  • 1{-5} Micro, 1/4/2022, 4808.25 (down)
  • 3{-6} Submicro, 8/16/2022, 4327.50 (down)
  • 3{-7} Minuscule, 12/13/2022, 4110 (down)
  • 1{-8} Subminuscule, 12/13/2022, 4110 (down)

Learning and other resources. Elliott wave analysis provides context, not prophecy. As the 20th century semanticist Alfred Korzybski put it in his book Science and Sanity (1933), “The map is not the territory … The only usefulness of a map depends on similarity of structure between the empirical world and the map.” And I would add, in the ever-changing markets, we can judge that similarity of structure only after the fact.

See the menu page Analytical Methods for a rundown on where to go for information on Elliott wave analysis.

By Tim Bovee, Portland, Oregon, January 19, 2023

Disclaimer

Tim Bovee, Private Trader tracks the analysis and trades of a private trader for his own accounts. Nothing in this blog constitutes a recommendation to buy or sell stocks, options or any other financial instrument. The only purpose of this blog is to provide education and entertainment.

No trader is ever 100 percent successful in his or her trades. Trading in the stock and option markets is risky and uncertain. Each trader must make trading decisions for his or her own account, and take responsibility for the consequences.

License
Creative Commons License

All content on Tim Bovee, Private Trader by Timothy K. Bovee is licensed under a Creative Commons Attribution-ShareAlike 4.0 International License.

Based on a work at www.timbovee.com.

Trader’s Notebook

3:30 p.m. New York time

Half an hour before the closing bell. The price of the S&P 500 futures has fallen sharply during today’s session, from slightly below the 61.8% Fibonacci retracement level to slightly above the 38.2% Fib level. (See this morning’s discussion, below, for more on Fibonacci levels.)

The decline confirms this morning’s alternate analysis. The upward correction that began on December 19, 2022 from 3803.50 ended on January 17 at 4035.25 has ended. The subsequent decline is part of a downtrend that will carry the price significantly lower.

In Elliott wave terminology, the upward correction, wave 2{-9}, ended on Tuesday, and wave 3{-9} has begun. Third waves tend to be powerful. I anticipate that this wave will take a month and perhaps longer to work its way down. I have no target yet, but the price will move below 3803.50, the starting point of the preceding upward correction, and almost certainly well below that level.

I’ve updated the chart below.

9:35 a.m. New York time

What’s happening now? The S&P 500 E-mini futures traded narrowly overnight, with two rapid movements, each lasting a couple of minutes. The range was defined by the second movement movement about an hour before the opening bell. The price to the 4030s and then decline to the 4010s, all within two minutes. The first movement, during the Tokyo Stock Exchange session, ran from the 40-oughts up to the 4020s.

What does it mean? The prices remained below Tuesday’s high, 4035.25, leaving the analysis is unchanged from the day before, with two possibilities.

Either the the upward correction that began on December 19, 2022 is still underway…

What is the alternative?

… or the upward correction ended at Tuesday’s high and a downtrend began and is now in a low degree upward correction.

There’s little to distinguish between the two. The lower the price goes, the more likely it is that the alternative analysis matches the chart’s reality.

Chart notes. I’ve placed a Fibonacci retracement level on the chart — in red — to trade the upward correction’s movement in relation to the prior decline, which ran from December 13 to December 19 last year. On Tuesday the price came within a point of the 61.8% retracement level, often a major reversal point, and in fact did reverse, bringing the price down to present levels,

A note on the numbers and letters used to identify directional movements — “waves” in Elliott wave parlance, The subwaves within corrections are designated by letters, and within trending waves, by numbers. The waves on a chart form a fractal pattern. Larger waves contain smaller waves and are contained by even larger waves, and they all dance to the same tune, creating the same patterns and following the same rules. A wave’s relative place in the fractal hierarchy is called it’s “degree”. I designated the degree by a subscript after each wave’s number or letter, setting it with curly brackets. The smaller the subscript number, the lower the degree of the wave.

[S&P 500 E-mini futures at 3:30 p.m., 90-minute bars, with volume]

What does Elliott wave theory say? These are the waves of the principal analysis:

  • The upward correction is wave 2{-9}.
  • It is presently in its last subwave, E{-10}
  • Wave 2{-9} will go still higher, exceeding yesterday’s high, 4035.25.

The waves of the alternative analysis:

  • The upward correction, wave 2{-9}, ended at Tuesday’s peak, 4035.25.
  • A downtrend, wave 3{-9}, began at that point and is now underway and is in its first subwave, 1{-10}.
  • Wave 3{-9}, as a third wave, is likely to be the longest wave of the larger downtrend, wave 3{-7}, that began on December 13 and will carry the price siginificantly lower.

We Are Here.

These are the waves currently in progress under my principal analysis. Each line on the list shows the wave number, with the subscript in curly brackets, the traditional degree name, the starting date, the starting price of the S&P 500 E-mini futures, and the direction of the wave.

  • S&P 500 Index:
  • 5{+3} Supercycle, 7/8/1932, 4.40 (up)
  • 5{+2} Cycle, 12/9/1974, 60.96 (up)
  • 5{+1} Primary, 3/6/2009, 666.79 (up)
  • 5{0} Intermediate, 12/26/2018, 2346.58 (up)
  • 4{-1} Minor, 1/4/2022 4818.62 (down)
  • 1{-2} Minute, 1/4/2022 4818.62 (down)
  • S&P 500 Futures and index:
  • 1{-3} Minuette, 1/4/2022, 4808.25 (down) (futures), 4818.62 (down) (index)
  • S&P 500 Futures:
  • 1{-4} Subminuette, 1/4/2022, 4808.25 (down)
  • 1{-5} Micro, 1/4/2022, 4808.25 (down)
  • 3{-6} Submicro, 8/16/2022, 4327.50 (down)
  • 3{-7} Minuscule, 12/1/2022, 4110 (down)
  • 1{-8} Subminuscule, 12/1/2022, 4110 (down)

Learning and other resources. Elliott wave analysis provides context, not prophecy. As the 20th century semanticist Alfred Korzybski put it in his book Science and Sanity (1933), “The map is not the territory … The only usefulness of a map depends on similarity of structure between the empirical world and the map.” And I would add, in the ever-changing markets, we can judge that similarity of structure only after the fact.

See the menu page Analytical Methods for a rundown on where to go for information on Elliott wave analysis.

By Tim Bovee, Portland, Oregon, January 18, 2023

Disclaimer

Tim Bovee, Private Trader tracks the analysis and trades of a private trader for his own accounts. Nothing in this blog constitutes a recommendation to buy or sell stocks, options or any other financial instrument. The only purpose of this blog is to provide education and entertainment.

No trader is ever 100 percent successful in his or her trades. Trading in the stock and option markets is risky and uncertain. Each trader must make trading decisions for his or her own account, and take responsibility for the consequences.

License
Creative Commons License

All content on Tim Bovee, Private Trader by Timothy K. Bovee is licensed under a Creative Commons Attribution-ShareAlike 4.0 International License.

Based on a work at www.timbovee.com.

Trader’s Notebook

3:30 p.m. New York time

Half an hour before the closing bell. The S&P 500 futures reached a high during the session of 4035.25 — less than a point of the 61.8% Fibonacci retracement level — and then reversed sharply, declining to 4002.75 and then taking back some of the fall.

The pattern is consistent with a low-degree downward movement before a final push to the top, and if that’s what it turns out to be, then the upward correction, wave 2{-9}, is not yet finished but is about to reach its end. It is also consistent with the beginning of a downtrend, wave 3{-9}, after wave 2{-9} ended at 4035.25.

The chart’s wave labelings from this morning are based on the first interpretation — wave 2{-9} is underway — and I shall retain them for now until there’s greater clarity. I’ve added a short-term chart covering yesterday’s holiday trading and today’s.

[S&P 500 E-mini futures at 3:20 p.m., 5-minute bars, with volume]

10:20 a.m. New York time

New correction high. And the price has risen to a new high within the upward correction, wave 2{-9}. The price broke above Sunday’s high about half an hour into the session, reaching 4034.25 so far and confirming the principal analysis.

9:35 a.m. New York time

What’s happening now? The S&P 500 E-mini futures continued to work their way lower, remaining below Sunday evening’s peak, 4028.25, and above Monday morning’s low of 3996.75. At the opening bell the price approached that peak, coming to within four points.

What does it mean? The further the price falls, the more likely it becomes that Sunday’s high marked the end of the upward correction that began on December 19, 2022. The correction high fell a few points short of the 61.8% Fibonacci retracement level, which is a common reversal point, and my principal analysis continues to show the correction as still underway.

What are the alternatives? At this point any peak potentially be the end of the correction and the beginning of a downtrend that will carry the price significantly lower.

Chart notes. I’ve superimposed a Fibonacci retracement ladder on the chart, in red, showing how much the correction has retraced the decline from December 13 to December 19 last year.

In Elliott wave analysis, a directional movement is called a wave, larger waves are built from smaller waves and in turn on the building blocks of still larger waves in a fractal pattern, all waves big and small exhibit the same patterns and follow the same rules. On the chart, subwaves of trending waves are numbered, and subwaves of corrective waves are labeled with letters. I show the relative place of each wave in the fractal hierarchy — its degree — with a subscript contained within curly brackets. The lower the subscript number, the smaller the degree.

[S&P 500 E-mini futures at 3:30 p.m., 90-minute bars, with volume]

What does Elliott wave theory say? Unchanged from yesterday’s post.

Under the principal analysis,

  • The upward correction that began on December 19, 2022 is wave 2{-9}
  • It is in its final subwave, E{-10}.
  • The end of wave E{-10} will also be the end of wave 2{-9} and the beginning of a downtrend, wave 3{-9}

Under the alternative analysis,

  • A downtrend, wave 3{-9}, began overnight on January 15, at the point where wave 2{-9} ended with a high of 4028.25.
  • Wave 3{-9} will have five subwaves — three trending and two upward corrections at the {-10} degree — and is presently in downtrending wave 1{-10}.

We Are Here.

These are the waves currently in progress under my principal analysis. Each line on the list shows the wave number, with the subscript in curly brackets, the traditional degree name, the starting date, the starting price of the S&P 500 E-mini futures, and the direction of the wave.

  • S&P 500 Index:
  • 5{+3} Supercycle, 7/8/1932, 4.40 (up)
  • 5{+2} Cycle, 12/9/1974, 60.96 (up)
  • 5{+1} Primary, 3/6/2009, 666.79 (up)
  • 5{0} Intermediate, 12/26/2018, 2346.58 (up)
  • 4{-1} Minor, 1/4/2022 4818.62 (down)
  • 1{-2} Minute, 1/4/2022 4818.62 (down)
  • S&P 500 Futures and index:
  • 1{-3} Minuette, 1/4/2022, 4808.25 (down) (futures), 4818.62 (down) (index)
  • S&P 500 Futures:
  • 1{-4} Subminuette, 1/4/2022, 4808.25 (down)
  • 1{-5} Micro, 1/4/2022, 4808.25 (down)
  • 3{-6} Submicro, 8/16/2022, 4327.50 (down)
  • 3{-7} Minuscule, 12/1/2022, 4110 (down)
  • 1{-8} Subminuscule, 12/1/2022, 4110 (down)

Learning and other resources. Elliott wave analysis provides context, not prophecy. As the 20th century semanticist Alfred Korzybski put it in his book Science and Sanity (1933), “The map is not the territory … The only usefulness of a map depends on similarity of structure between the empirical world and the map.” And I would add, in the ever-changing markets, we can judge that similarity of structure only after the fact.

See the menu page Analytical Methods for a rundown on where to go for information on Elliott wave analysis.

By Tim Bovee, Portland, Oregon, January 17, 2023

Disclaimer

Tim Bovee, Private Trader tracks the analysis and trades of a private trader for his own accounts. Nothing in this blog constitutes a recommendation to buy or sell stocks, options or any other financial instrument. The only purpose of this blog is to provide education and entertainment.

No trader is ever 100 percent successful in his or her trades. Trading in the stock and option markets is risky and uncertain. Each trader must make trading decisions for his or her own account, and take responsibility for the consequences.

License
Creative Commons License

All content on Tim Bovee, Private Trader by Timothy K. Bovee is licensed under a Creative Commons Attribution-ShareAlike 4.0 International License.

Based on a work at www.timbovee.com.

Trader’s Notebook

9:35 a.m. New York time

Market holiday. The U.S. markets won’t hold their regular sessions today, remaining closed in observance of the holiday honoring the American civil rights leader Martin Luther King Jr.

What’s happening now? The S&P 500 E-mini futures resumed trading Sunday evening, initially falling slightly but then rising, reaching 4028.25, a new high of within the upward correction that began on December 19, 2022. Afterward the price fell back into the 3990s and then began to rise again.

What does it mean? There are two possible alternatives of equal likelihood, a not uncommon occurrence during the end game of a market movement. As principle analysis I’ve chosen to consider the upward correction to still be underway, with the overnight high being a stopping point within the ongoing rise. One argument for giving greater weight to this interpretation is that the high remains below a Fibonacci retracement level, a point at which prices tend to reverse. The level retracing 61.8% of the preceding decline is 4036.18, nine points above the peak.

What are the alternatives? The alternative is to consider the upward correction to have ended at the overnight high and a downtrend to have begun. Reversal at Fibonacci levels is a tendency, not a firm rule.

Chart notes. Compared to last week’s charts, I’ve moved closer in to better assess the retracement levels. I show the Fibonacci retracement ladder in red, with the retracement levels marked with both the percentage and price. Traditionally, Fib ladders show some non-Fibonacci retracement levels: The 50% level is not a Fibonacci number, and neither is the 78.6% level. For this chart, to remove some of the clutter, I’ve chosen the purist approach and show only the true Fibonacci retracement levels: 23.6%, 38.2% and 61.8%.

R.N. Elliott, who developed Elliott wave analysis in the 1930s, called a directional market movement a “wave”. Elliott’s practice, which persists to this day, was to designate the subwaves of trending waves with numbers and the subwaves of corrective waves with letters.

Elliott’s great insight was that the waves on a chart form a fractal structure — waves within waves. Smaller waves are the building blocks of larger waves, and are in turn built out of smaller waves. And all of those waves, big and small, trace the same patterns according to identical rules.

The position of a wave within this complex fractal hierarchy is called its “degree”, and I designate the degree with a subscript, in curly brackets, after the wave number or letter. The smaller the subscript value, the smaller the degree, and vice versa. The waves on the present chart are of relatively small degree, and so the subscripts are negative numbers.

[S&P 500 E-mini futures at 9:35 a.m., 90-minute bars, with volume]

What does Elliott wave theory say? Under the principal analysis,

  • The upward correction that began on December 19, 2022 is wave 2{-9}
  • It is in its final subwave, E{-10}.
  • The end of wave E{-10} will also be the end of wave 2{-9} and the beginning of a downtrend, wave 3{-9}

Under the alternative analysis,

  • A downtrend, wave 3{-9}, began overnight on January 15, at the point where wave 2{-9} ended with a high of 4028.25.
  • Wave 3{-9} will have five subwaves — three trending and two upward corrections at the {-10} degree — and is presently in downtrending wave 1{-10}.

Under both analyses,

  • Wave 2{-9} and the following wave 3{-9} are subwaves of wave 1{-8}, a downtrend that began on December 1, 2022.
  • As a third wave, 3{-9} will typically be the powerful of the trending waves, carrying the price significantly lower.
  • Wave 1{-8} is a subwave within a series of downtrending waves of increasing size, from wave 3{-7}, which also began on December 1, up to wave 1{-2}, a downtrending that began on January 4, 2022.
  • Wave 1{-2} is a subwave of downtrending wave 4{-1}, a subwave that began on January 4, 2022 within an expanding Diagonal Triangle, wave 5{0}, which began on December 26, 2018.
  • Wave 4{-1} will be followed by wave 5{-1}, an uptrending wave that will rise significantly above the prior peak, within the parent wave 5{0}.
  • The end of wave 5{0} will also be the end of a series of larger 5th waves and will mark the beginning of a major downward movement that will take decades to resolve.

We Are Here.

These are the waves currently in progress under my principal analysis. Each line on the list shows the wave number, with the subscript in curly brackets, the traditional degree name, the starting date, the starting price of the S&P 500 E-mini futures, and the direction of the wave.

  • S&P 500 Index:
  • 5{+3} Supercycle, 7/8/1932, 4.40 (up)
  • 5{+2} Cycle, 12/9/1974, 60.96 (up)
  • 5{+1} Primary, 3/6/2009, 666.79 (up)
  • 5{0} Intermediate, 12/26/2018, 2346.58 (up)
  • S&P 500 Futures:
  • 4{-1} Minor, 1/4/2022 4808.25 (down) [4818.62 (down) (index)]
  • 1{-2} Minute, 1/4/2022 4808.25 (down)
  • 1{-3} Minuette, 1/4/2022, 4808.25 (down) (futures)
  • S&P 500 Futures:
  • 1{-4} Subminuette, 1/4/2022, 4808.25 (down)
  • 1{-5} Micro, 1/4/2022, 4808.25 (down)
  • 3{-6} Submicro, 8/16/2022, 4327.50 (down)
  • 3{-7} Minuscule, 12/1/2022, 4110 (down)
  • 1{-8} Subminuscule, 12/1/2022, 4110 (down)

Learning and other resources. Elliott wave analysis provides context, not prophecy. As the 20th century semanticist Alfred Korzybski put it in his book Science and Sanity (1933), “The map is not the territory … The only usefulness of a map depends on similarity of structure between the empirical world and the map.” And I would add, in the ever-changing markets, we can judge that similarity of structure only after the fact.

See the menu page Analytical Methods for a rundown on where to go for information on Elliott wave analysis.

By Tim Bovee, Portland, Oregon, January 16, 2023

Disclaimer

Tim Bovee, Private Trader tracks the analysis and trades of a private trader for his own accounts. Nothing in this blog constitutes a recommendation to buy or sell stocks, options or any other financial instrument. The only purpose of this blog is to provide education and entertainment.

No trader is ever 100 percent successful in his or her trades. Trading in the stock and option markets is risky and uncertain. Each trader must make trading decisions for his or her own account, and take responsibility for the consequences.

License
Creative Commons License

All content on Tim Bovee, Private Trader by Timothy K. Bovee is licensed under a Creative Commons Attribution-ShareAlike 4.0 International License.

Based on a work at www.timbovee.com.

Trader’s Notebook

3:30 p.m. New York time

Half an hour before the closing bell. The S&P 500 futures rose during the session, reaching back into the 4010s but remaining below the yesterday’s high, 4021.50. This morning’s analysis remains unchanged. Either the upward correction that began on December 19, 2022 is still underway, or the correction ended at yesterday’s high and a downtrend has begun. In Elliott wave terminology, the choice is between the correction, wave 2{-9}, or the downtrend, wave 3{-9}. There’s ambiguity in the chart, as is often the case with tops. I consider the choices to have equal likelihoods of accurately reflecting the market. I’ve updated both charts.

9:35 a.m. New York time

What’s happening now? The S&P 500 E-mini futures fell in overnight trading, reaching into the 3960s, approaching the low it reached overnight one day earlier during a large whipsaw after new inflation data was released. The high during that whipsaw remains the peak of an upward correction that began on December 19, 2022. The price returned to the 3970s as the opening bell sounded.

What does it mean? As has been the case for several days, each new high is potentially the end of the upward correction, but it’s not a certainty. For the chart, I’ve chosen labeling that shows the upward correction is still underway.

What are the alternatives? As the alternative, I’ve chosen a scenario that sees the January 12 high, 4021.50, as being the end point of the upward correction, and the subsequent decline as being the first stages of a downtrend that will carry the price below the correction’s starting point, 3803.50.

I consider the two possible outcomes to equally likely.

Chart notes.

The upper chart shows the S&P 500 futures price movement from Wednesday’s session to 45 minutes before the opening bell of today’s session. The whipsaw in the middle is when the new inflation data was released, and I’ve marked the moment of release with a vertical dotted line in red.

The lower chart runs from September 2022 to the present, showing the entirety of a larger upward correction from October to December, the first subwave of the downtrend that followed, and the upward correction, which is the second subwave of that larger downtrend.

In Elliott wave analysis, the subwaves of trending waves — directional movements — are numbered, and those of corrective waves are labeled with letters. The waves of various sizes form a fractal pattern, with each wave containing subwaves, which in turn contain still smaller subwaves, and each wave being contained by a series of waves of increasing size. I show each wave’s relative position in the fractal hierarchy — its degree — with a subscript in curly brackets. The larger the subscript number, the larger the wave’s degree.

[S&P 500 E-mini futures at 3 p.m., 5-minute bars, with volume]

[S&P 500 E-mini futures at 3:30 p.m., 4-hour bars, with volume]

What does Elliott wave theory say? Under the principal analysis,

  • An upward correction, wave 2{-9}, began on December 19, 2022 and has so far reached a peak of 4021.50. It is in its last stages. It will be followed by a downtrend, wave 3{-9}.

Under the alternative analysis,

  • A downtrend, wave 3{-9}, began on January 12 from 4021.50 and is in its early stages. It can be expected to move below 3803.50, the starting point of the preceding upward correction, wave 2{-9}, and perhaps significantly below that level.

Under either analysis.

  • The waves listed above are subwaves of wave 1{-8}, a downtrend that began on December 13, 2022 from 4180.
  • That starting point is also the beginning of a wave one degree higher, wave 3{-7}.
  • Wave 3{-7} is contained with a series of downward parent waves of increasing degree, from wave 3{-6}, which began on August 16, 2022 from 4327.50 up to wave 4{-1}, which began on January 4, 2022 from 4818.62. Wave 4{-1} on the S&P 500 futures is the starting point of the present bear market.
  • The entire collection of waves of various degrees is contained in wave 5{0}, an expanding Diagonal Triangle that began on December 26, 2018.
  • Wave 4{-1} is the next-to-the-last subwave of that Triangle. It will be followed by uptrending wave 5{-1}, which will carry the price above the January 4, 2022 peak of 4818.62, and perhaps quite a distance above that level.
  • The end of wave 5{-1} will also be the end of wave 5{0}, which in turn brings an end to a series of larger waves up to wave 5{+3}, the low point, in 1932, of the Crash of 1929, the market disaster that triggered the Great Depression, which had such a great impact on the lives of our parents (for Boomers), grandparents (for GenX) and great-grandparents (for Millennials).

We Are Here.

These are the waves currently in progress under my principal analysis. Each line on the list shows the wave number, with the subscript in curly brackets, the traditional degree name, the starting date, the starting price of the S&P 500 E-mini futures, and the direction of the wave.

  • S&P 500 Index:
  • 5{+3} Supercycle, 7/8/1932, 4.40 (up)
  • 5{+2} Cycle, 12/9/1974, 60.96 (up)
  • 5{+1} Primary, 3/6/2009, 666.79 (up)
  • 5{0} Intermediate, 12/26/2018, 2346.58 (up)
  • 4{-1} Minor, 1/4/2022 4818.62 (down)
  • 1{-2} Minute, 1/4/2022 4818.62 (down)
  • S&P 500 Futures and index:
  • 1{-3} Minuette, 1/4/2022, 4808.25 (down) (futures), 4818.62 (down) (index)
  • S&P 500 Futures:
  • 1{-4} Subminuette, 1/4/2022, 4808.25 (down)
  • 1{-5} Micro, 1/4/2022, 4808.25 (down)
  • 3{-6} Submicro, 8/16/2022, 4327.50 (down)
  • 3{-7} Minuscule, 12/1/2022, 4110 (down)
  • 1{-8} Subminuscule, 12/1/2022, 4110 (down)

Learning and other resources. Elliott wave analysis provides context, not prophecy. As the 20th century semanticist Alfred Korzybski put it in his book Science and Sanity (1933), “The map is not the territory … The only usefulness of a map depends on similarity of structure between the empirical world and the map.” And I would add, in the ever-changing markets, we can judge that similarity of structure only after the fact.

See the menu page Analytical Methods for a rundown on where to go for information on Elliott wave analysis.

By Tim Bovee, Portland, Oregon, January 13, 2023

Disclaimer

Tim Bovee, Private Trader tracks the analysis and trades of a private trader for his own accounts. Nothing in this blog constitutes a recommendation to buy or sell stocks, options or any other financial instrument. The only purpose of this blog is to provide education and entertainment.

No trader is ever 100 percent successful in his or her trades. Trading in the stock and option markets is risky and uncertain. Each trader must make trading decisions for his or her own account, and take responsibility for the consequences.

License
Creative Commons License

All content on Tim Bovee, Private Trader by Timothy K. Bovee is licensed under a Creative Commons Attribution-ShareAlike 4.0 International License.

Based on a work at www.timbovee.com.