3:30 p.m. New York time
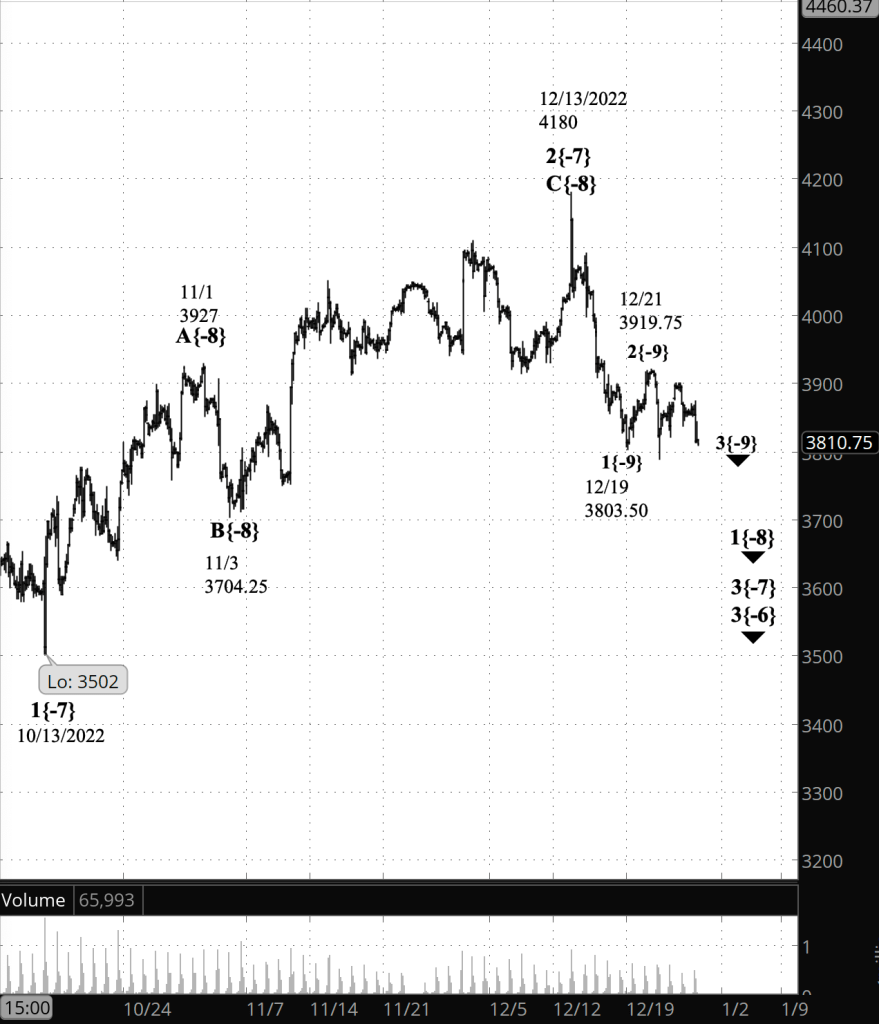
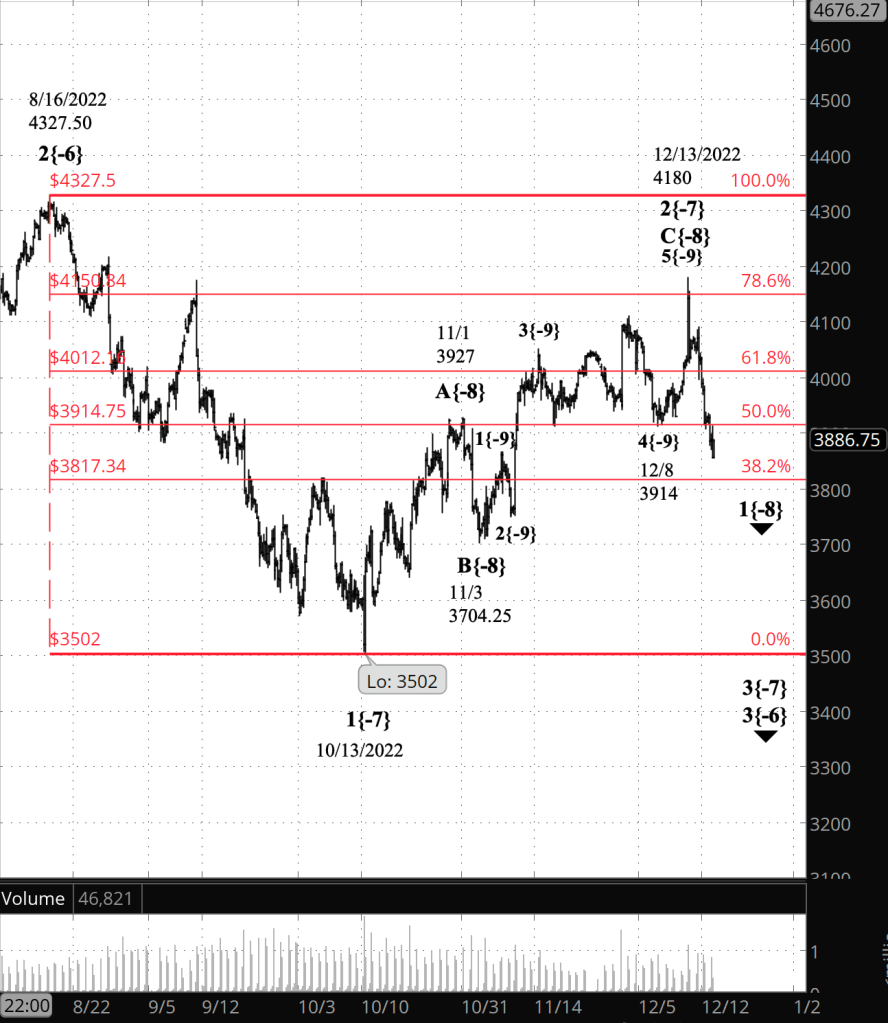
Half an hour before the closing bell. The S&P 500 futures continued to rise during the session, reaching into the 3880s. No change in the analysis. Waves now underway: Wave 3{-9} within wave 1{-8} within wave 3{-7}. All are downtrending.
The session high so far keeps the price below the starting point of wave 3{-9}, which 3919.75. A move above that level would require a reanalysis of the chart.
9:45 a.m. New York time
SPY options trade entry. I’m continuing to play the downtrend, entering a short bear call spread on SPY using options that trade for the last time on February 17. I’ve posted an analysis of the trade.
9:35 a.m. New York time
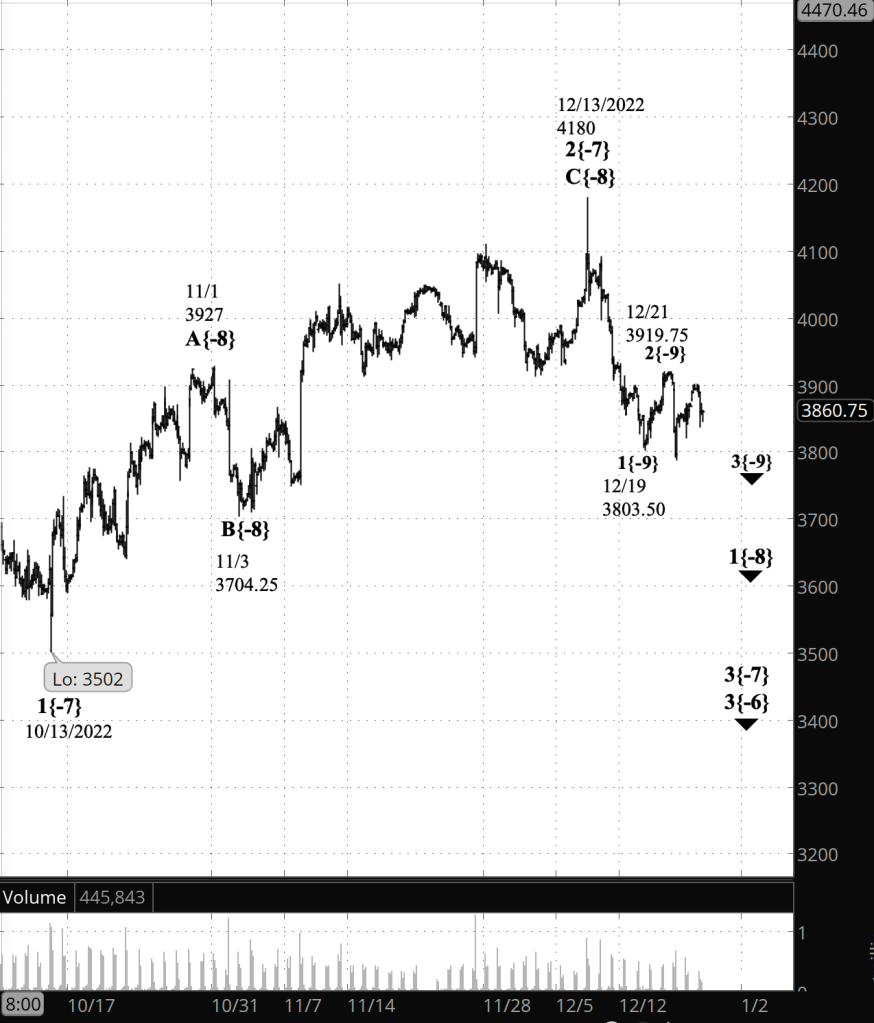
What’s happening now? The S&P 500 E-mini futures rose from yesterday’s session low, 3804.50, into the 3840s shortly after the opening bell.
What does it mean? The downtrend that began on December 21 continues and internally is in the first of five segments.
What are the alternatives? There are two, unchanged from yesterday.
Alternative #1: The larger upward correction that began on October 13 is is still underway and is in its final segment.
Alternative #2: The upward correction that began on October 13 is still underway and is taking the from of a compound correction, containing two or three corrective patterns.

[S&P 500 E-mini futures at 3:30 p.m., 180-minute bars, with volume]
What does Elliott wave theory say? These are the waves that matter for the near term
Principal analysis:
- A downtrend that began on December 13, wave 3{-7}, is underway.
- Internally, it is in wave 1{-8}, the first of five waves.
- Wave 1{-8}, in turn, is in its middle segment, wave 3{-9}.
Both alternatives:
- An upward correction that began on October 13, wave 2{-7}, is still underway.
Alternative #1:
- The third and final wave of the correction, wave C{-8}, is underway.
- Wave C{-8} is in the first wave of a downward correction, wave A{-9}.
Alternative #2:
- The upward correction, wave 2{-7}, is taking a compound form, containing two or three corrective patterns.
- The final wave of the first pattern — wave C{-8} — ended on December 13.
- The decline that followed, still underway, is wave X{-8}, a wave connecting wave C{-8} and the first wave of the second corrective pattern — wave A{-8}.
We Are Here.
These are the waves currently in progress under my principal analysis. Each line on the list shows the wave number, with the subscript in curly brackets, the traditional degree name, the starting date, the starting price of the S&P 500 E-mini futures, and the direction of the wave.
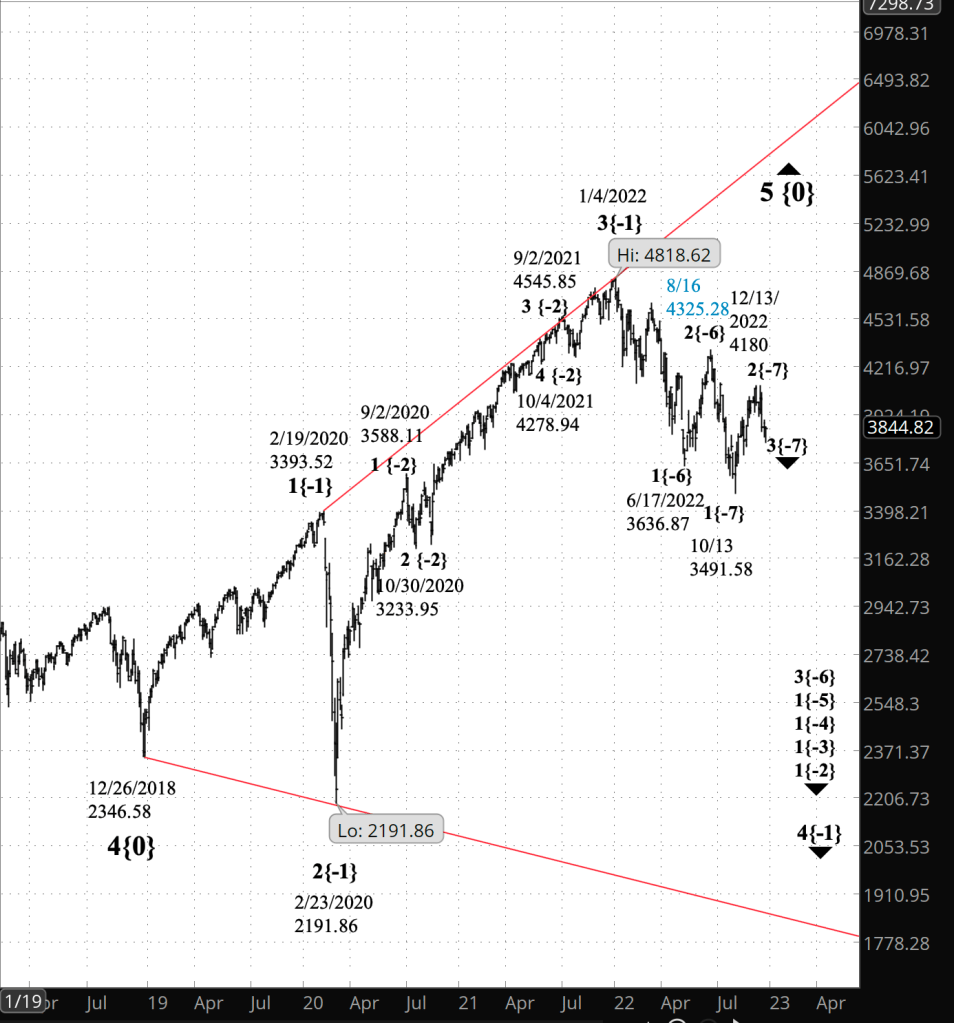
- S&P 500 Index:
- 5{+3} Supercycle, 7/8/1932, 4.40 (up)
- 5{+2} Cycle, 12/9/1974, 60.96 (up)
- 5{+1} Primary, 3/6/2009, 666.79 (up)
- 5{0} Intermediate, 12/26/2018, 2346.58 (up)
- 4{-1} Minor, 1/4/2022 4818.62 (down)
- 1{-2} Minute, 1/4/2022 4818.62 (down)
- S&P 500 Futures and index:
- 1{-3} Minuette, 1/4/2022, 4808.25 (down) (futures), 4818.62 (down) (index)
- S&P 500 Futures:
- 1{-4} Subminuette, 1/4/2022, 4808.25 (down)
- 1{-5} Micro, 1/4/2022, 4808.25 (down)
- 3{-6} Submicro, 8/16/2022, 4327.50 (down)
- 3{-7} Minuscule, 12/1/2022, 4110 (down)
- 1{-8} Subminuscule, 12/1/2022, 4110 (down)
Learning and other resources. Elliott wave analysis provides context, not prophecy. As the 20th century semanticist Alfred Korzybski put it in his book Science and Sanity (1933), “The map is not the territory … The only usefulness of a map depends on similarity of structure between the empirical world and the map.” And I would add, in the ever-changing markets, we can judge that similarity of structure only after the fact.
See the menu page Analytical Methods for a rundown on where to go for information on Elliott wave analysis.
By Tim Bovee, Portland, Oregon, December 29, 2022
Disclaimer
Tim Bovee, Private Trader tracks the analysis and trades of a private trader for his own accounts. Nothing in this blog constitutes a recommendation to buy or sell stocks, options or any other financial instrument. The only purpose of this blog is to provide education and entertainment.
No trader is ever 100 percent successful in his or her trades. Trading in the stock and option markets is risky and uncertain. Each trader must make trading decisions for his or her own account, and take responsibility for the consequences.
License
All content on Tim Bovee, Private Trader by Timothy K. Bovee is licensed under a Creative Commons Attribution-ShareAlike 4.0 International License.
Based on a work at www.timbovee.com.


You must be logged in to post a comment.