3:30 p.m. New York time
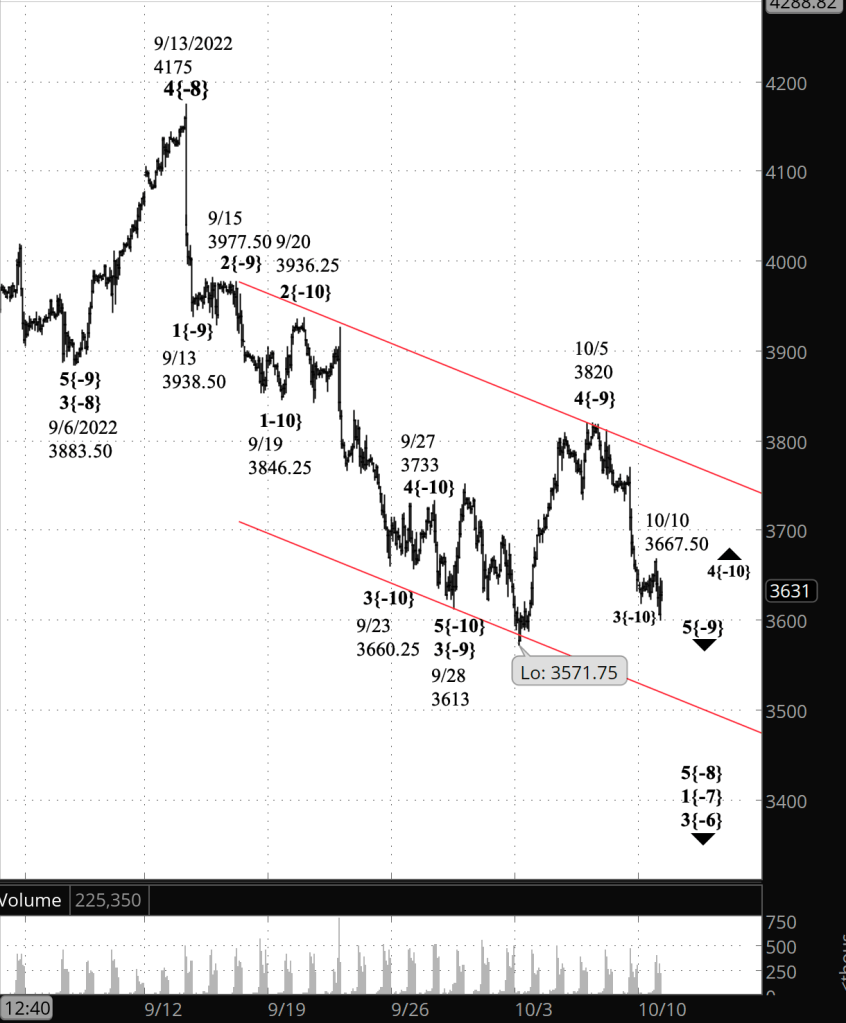
Half an hour before the closing bell. The S&P 500 fell a bit further early in the session, to 3580.25 on the futures, and then rose to 3649.50 before falling again, reaching below the morning’s low point. The rise was sufficiently high to be a final wave proportionate to the rest of the structure within the upward correction that began on October 5. There’s no certainly yet that the session marked the end of wave C{-11} within the upward correction, wave 4{-10}, nor is there certainty that the correction has not yet ended.
I’ve updated the chart, retaining the labeling from this morning’s analysis. The further the price falls, the more likely it is that wave 4{-10} ended today at 3649.50 and that wave 5{-10} has begun. If the price reverses without falling much further, then it becomes more likely that the session high was the peak of a subwave of an ongoing wave 4{-10}.
12:05 p.m. New York time
LVS options trade exit. I’ve exited my short bear call options spread on LVS for 100% of maximum potential loss and have updated the trade analysis with full results.
9:35 a.m. New York time
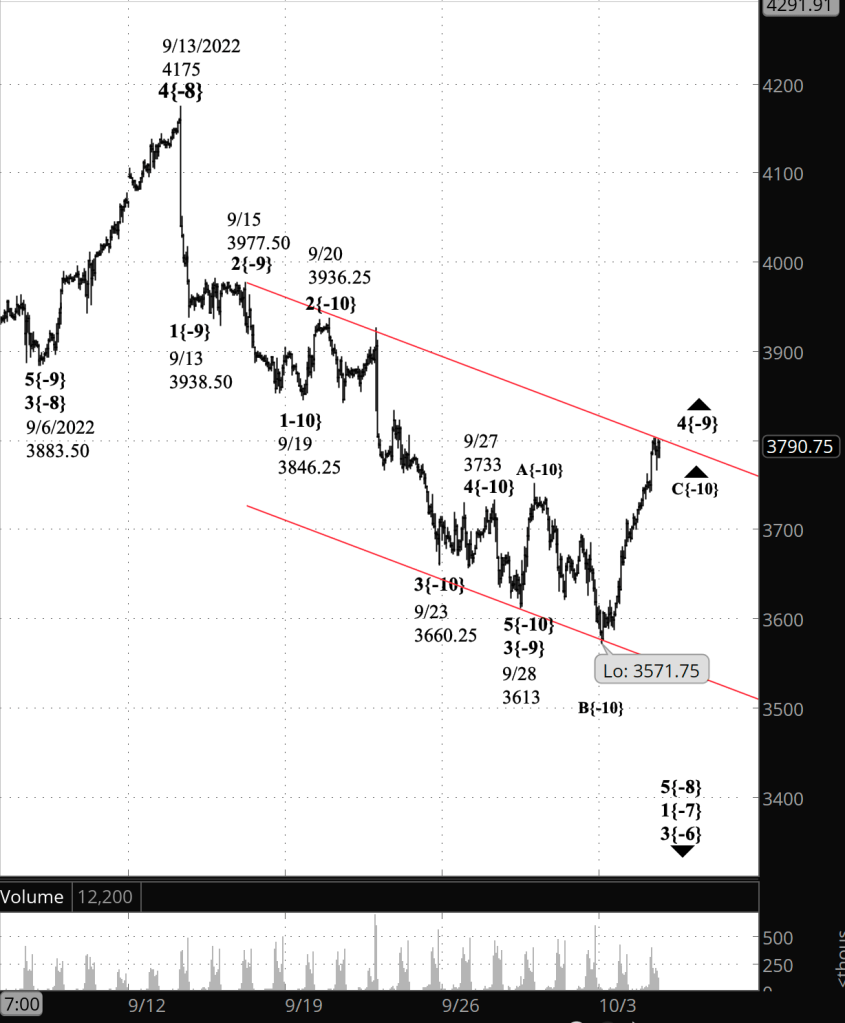
What’s happening now? The S&P 500 E-mini futures fell in overnight trading, reaching a low of 3584.25 before rising back into the 3620s.
What does it mean? The downtrend that began on October 5 continues and is now in the last leg of a small upward correction, which when complete will be followed by the final leg of the downtrend. A far larger upward correction will ensue.
What are the alternatives? The small upward correction ended on October 10 at 3667.50, and the final leg of the downtrend is now in its early stages.

What does Elliott wave theory say? Under the principal analysis, a small upward correction, wave 4{-10} is under way and internally is in wave C{-11}, its final wave unless the correction forms a compound structure composed of two or three corrective patterns.
Under the alternative analysis, wave 4{-10} ended on October 10 and downtrending wave 5{-10} is now underway.
The price has moved below the starting point of wave 4{-10}, from 3668, not an unusual condition for a 4th wave. If wave C{-11} within wave 4{-10} is still underway, then the price will rise higher, likely reaching above 3667.50, the peak of wave A{-11}. If wave 5{-10} is underway, then the price will fall further, likely reaching or coming close to 3500, the lower boundary of the price channel (marked in red on the chart).
This is all happening within wave 5{-9}, whose end will mark the end of its parent, wave 5{-8}, and grand-parent, wave 1{-7}, which began on August 16 from 4327.50. Wave 2{-7}, an upward correction, will follow, retracing a portion of the decline from 4327.50 to the end of wave 1{-7].
Assuming that wave 1{-7} ends near the lower boundary of the price channel, around 3500, then a common 50% Fibonacci retracement in wave 2{-7} would carry the price back up to the 3910s, and an also common 61.8% retracement, up to the 4010s, levels last seen in mid-September.
We Are Here.
These are the waves currently in progress under my principal analysis. Each line on the list shows the wave number, with the subscript in curly brackets, the traditional degree name, the starting date, the starting price of the S&P 500 E-mini futures, and the direction of the wave.
- S&P 500 Index:
- 5{+3} Supercycle, 7/8/1932, 4.40 (up)
- 5{+2} Cycle, 12/9/1974, 60.96 (up)
- 5{+1} Primary, 3/6/2009, 666.79 (up)
- 5{0} Intermediate, 12/26/2018, 2346.58 (up)
- 4{-1} Minor, 1/4/2022 4818.62 (down)
- 1{-2} Minute, 1/4/2022 4818.62 (down)
- S&P 500 Futures and index:
- 1{-3} Minuette, 1/4/2022, 4808.25 (down) (futures), 4818.62 (down) (index)
- S&P 500 Futures:
- 1{-4} Subminuette, 1/4/2022, 4808.25 (down)
- 1{-5} Micro, 1/4/2022, 4808.25 (down)
- 3{-6} Submicro, 8/16/2022, 4327.50 (down)
- 1{-7} Minuscule, 8/16/2022, 4327.50 (down)
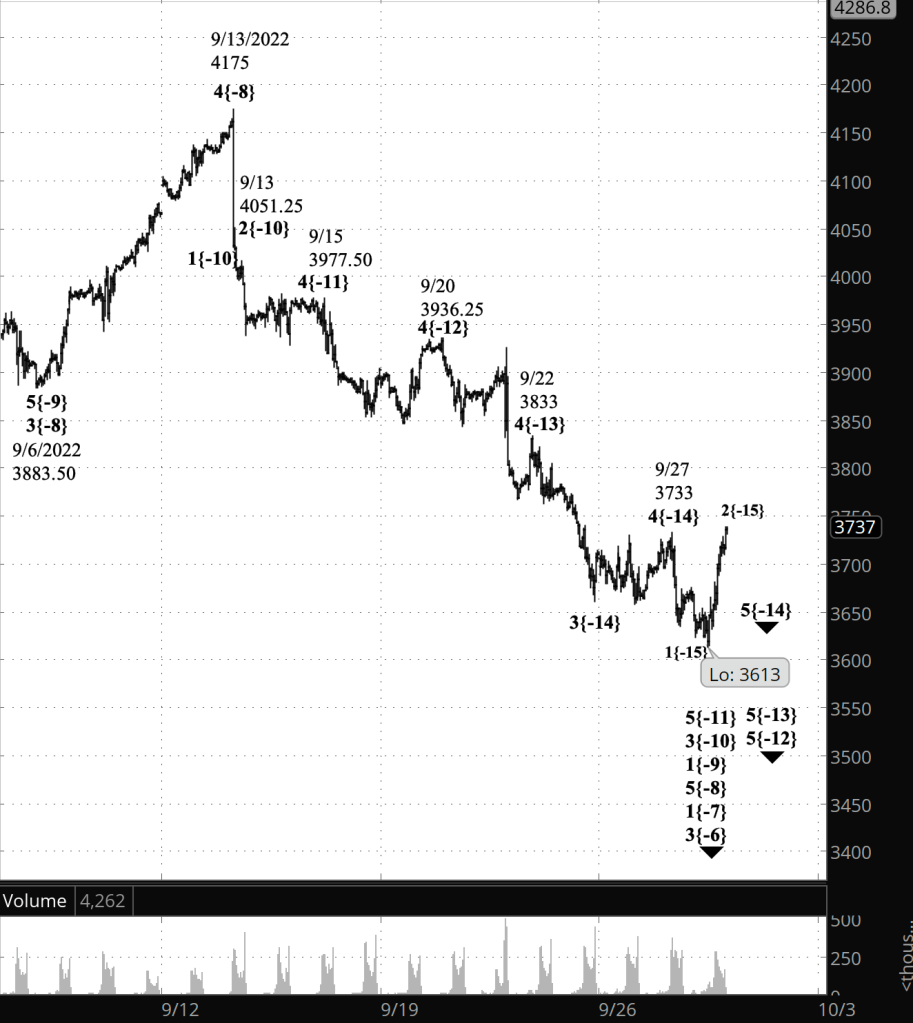
- 5{-8} Subminuscule, 9/13/2022, 4175 (down)
Learning and other resources. Elliott wave analysis provides context, not prophecy. As the 20th century semanticist Alfred Korzybski put it in his book Science and Sanity (1933), “The map is not the territory … The only usefulness of a map depends on similarity of structure between the empirical world and the map.” And I would add, in the ever-changing markets, we can judge that similarity of structure only after the fact.
See the menu page Analytical Methods for a rundown on where to go for information on Elliott wave analysis.
By Tim Bovee, Portland, Oregon, October 11, 2022
Disclaimer
Tim Bovee, Private Trader tracks the analysis and trades of a private trader for his own accounts. Nothing in this blog constitutes a recommendation to buy or sell stocks, options or any other financial instrument. The only purpose of this blog is to provide education and entertainment.
No trader is ever 100 percent successful in his or her trades. Trading in the stock and option markets is risky and uncertain. Each trader must make trading decisions for his or her own account, and take responsibility for the consequences.
License
All content on Tim Bovee, Private Trader by Timothy K. Bovee is licensed under a Creative Commons Attribution-ShareAlike 4.0 International License.
Based on a work at www.timbovee.com.


You must be logged in to post a comment.