Trader’s Notebook

12:30 p.m. New York time

Half an hour before the closing bell. The S&P 500 continued to work its way lower during the session, to 4024.75 on the futures at the lowest point so far today. No change in the analysis. I’ve updated the upper chart.

9:35 a.m. New York time

An early closing bell. The U.S. markets will close early today, at 1 p.m., as is customary on the day following the Thanksgiving Day holiday. Regular session hours, 9:30 a.m. to 3:30 p.m., will resume on Monday. The S&P 500 futures trade both during the session and outside of regular hours.

What’s happening now? The S&P 500 E-mini futures declined in overnight trading, reaching into the 4030s as the opening bell approached. The price remained below the high so far, 4049.25, reached on November 15 by the upward correction that began on October 13.

What does it mean? The correction is in its final phase — the rising third wave — and within that structure, is in a declining wave, the fourth wave in a series of five. I expect the rising fifth wave, which will likely complete the correction, to rise above the 4049.25 high. The correction, when complete, will be followed by a powerful downtrend.

What are the alternative? The 4049.25 peak was the end of the fifth wave, of the final phase of the upward correction, and possibly of the correction as a whole.

Corollary #1: The decline after the peak is the first tentative step in a powerful downtrend that will cary the price below 3502, the starting point of the upward correction, and most likely significantly below that level.

Corollary #2: The upward correction is taking a compound form, containing two or three corrective patterns. In that case, the decline following the peak connects the first corrective pattern, with a second corrective pattern that still lies in future. When the compound correction is over, the powerful downtrend will begin.

The charts. The upper chart shows the S&P 500 futures from July of this year to the present. The lower chart shows the S&P 500 index from November 2017 to the present.
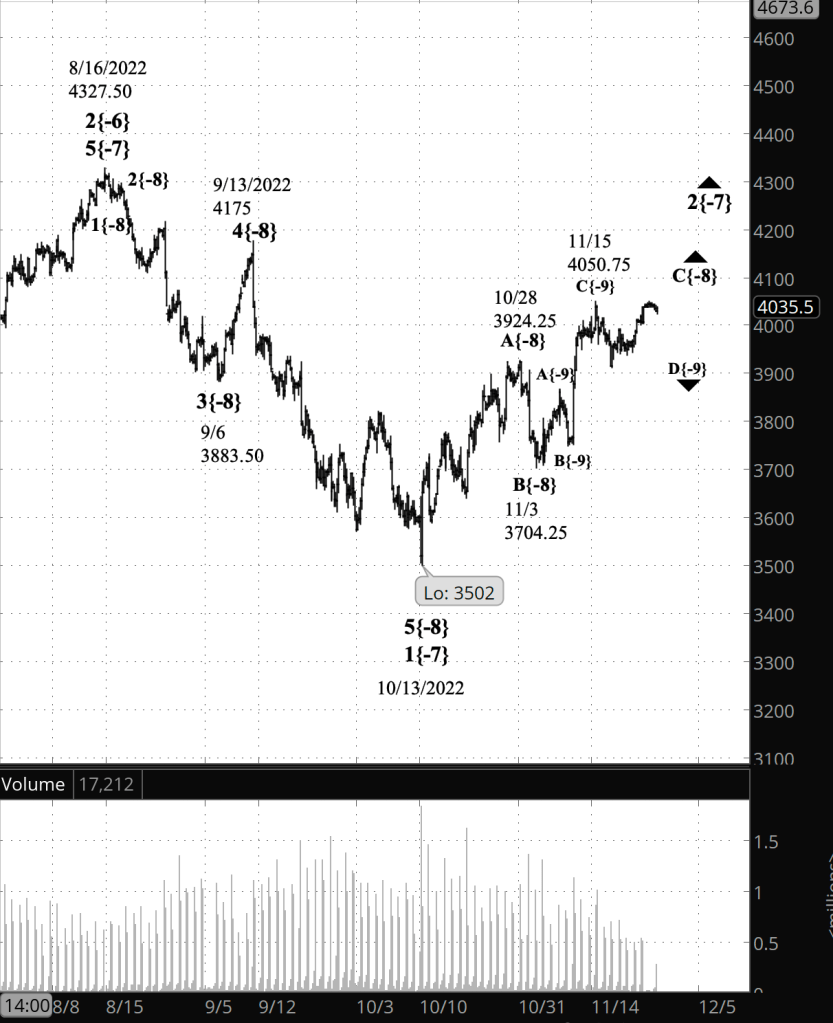
[S&P 500 E-mini futures at 9:35 a.m., 4-hour bars, with volume]

What does Elliott wave theory say? The upward correction that began on October 13 is wave 2{-7}.

Under the principal analysis, the correction is in wave 3{-8}, its final phase, and within wave 3{-8}, is in wave D{-9}, a declining wave that will be followed by rising wave E{-9}, the final wave of the corrective pattern and most likely of the wave 2{-7} correction itself. I expect wave E{-9} to exceed the 4049.25 peak, which is the end of rising wave C{-9}, the middle subwave of wave C{-8}.

The powerful downtrend that follows the correction will be wave 3{-7}, the middle wave of a larger downtrend, wave 3{-6}, which began on August 16.

Under the alternative analysis, the 4049.25 peak was the end of wave E{-9} and therefore of wave C{-8}. This see this as being less likely. Wave C{-8} must have five waves internally, since the correction has taken the form of a Zigzag. Although there is a shallow decline that could count as a fourth internal wave, it doesn’t seem deep enough to fulfill that roll. So as the principal analysis I am counting the 4049.25 peak as the wave C{-9} endpoint and placing the wave E{-9} endpoint as an alternative.

The two corollaries have to do with the nature of the decline that follows the 4049.25 peak. Corollary #1 sees it as the beginning of wave 3{-7}, a powerful downtrend. Corollary #2 sees it as a wave connecting two corrective patterns within the ongoing wave 2{-7} upward correction. The present decline is wave X{-8}, and it will be followed by a second corrective pattern, beginning with rising wave A{-8}.

In 2nd waves, simple corrections are far more common than compound corrections, which are mainly found in 4th wave corrections.

The parent wave of all of this, wave 3{-6}, lies within a series of increasingly larger 1st-wave downtrends, stretching from wave 1{-5} to wave 1{-2}. They all began on January 4 from 4818.62 on the index. They are all part of wave 4{-1}, the next-to-the-last wave within wave 5{0}, an expanding Diagonal Triangle that began on December 26, 2018.

Wave 4{-1} is a major decline that could carry the price into the 2500s and perhaps even below 2000. It will be followed by the final wave of the Triangle, wave 5{0}, an uptrending wave that will carry the price above the January 4 peak, 4818.62 on the index, into the mid-5600s and perhaps even higher.
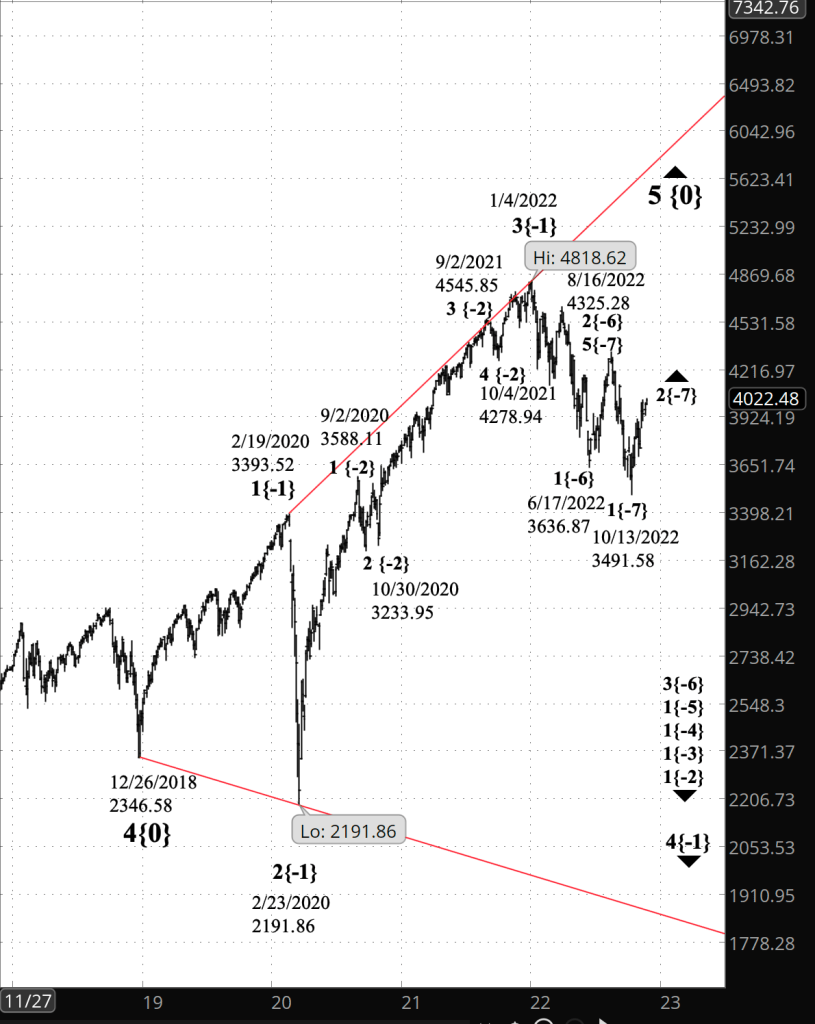
[S&P 500 index at 9:35 a.m., 3-day bars]

We Are Here.

These are the waves currently in progress under my principal analysis. Each line on the list shows the wave number, with the subscript in curly brackets, the traditional degree name, the starting date, the starting price of the S&P 500 E-mini futures, and the direction of the wave.

  • S&P 500 Index:
  • 5{+3} Supercycle, 7/8/1932, 4.40 (up)
  • 5{+2} Cycle, 12/9/1974, 60.96 (up)
  • 5{+1} Primary, 3/6/2009, 666.79 (up)
  • 5{0} Intermediate, 12/26/2018, 2346.58 (up)
  • 4{-1} Minor, 1/4/2022 4818.62 (down)
  • 1{-2} Minute, 1/4/2022 4818.62 (down)
  • S&P 500 Futures and index:
  • 1{-3} Minuette, 1/4/2022, 4808.25 (down) (futures), 4818.62 (down) (index)
  • S&P 500 Futures:
  • 1{-4} Subminuette, 1/4/2022, 4808.25 (down)
  • 1{-5} Micro, 1/4/2022, 4808.25 (down)
  • 3{-6} Submicro, 8/16/2022, 4327.50 (down)
  • 2{-7} Minuscule, 10/13/2022, 3502 (up)
  • C{-8} Subminuscule, 11/3/2022, 3704.25 (up)

Learning and other resources. Elliott wave analysis provides context, not prophecy. As the 20th century semanticist Alfred Korzybski put it in his book Science and Sanity (1933), “The map is not the territory … The only usefulness of a map depends on similarity of structure between the empirical world and the map.” And I would add, in the ever-changing markets, we can judge that similarity of structure only after the fact.

See the menu page Analytical Methods for a rundown on where to go for information on Elliott wave analysis.

By Tim Bovee, Portland, Oregon, November 25, 2022

Disclaimer

Tim Bovee, Private Trader tracks the analysis and trades of a private trader for his own accounts. Nothing in this blog constitutes a recommendation to buy or sell stocks, options or any other financial instrument. The only purpose of this blog is to provide education and entertainment.

No trader is ever 100 percent successful in his or her trades. Trading in the stock and option markets is risky and uncertain. Each trader must make trading decisions for his or her own account, and take responsibility for the consequences.

License
Creative Commons License

All content on Tim Bovee, Private Trader by Timothy K. Bovee is licensed under a Creative Commons Attribution-ShareAlike 4.0 International License.

Based on a work at www.timbovee.com.
Trader’s Notebook

9:35 a.m. New York time

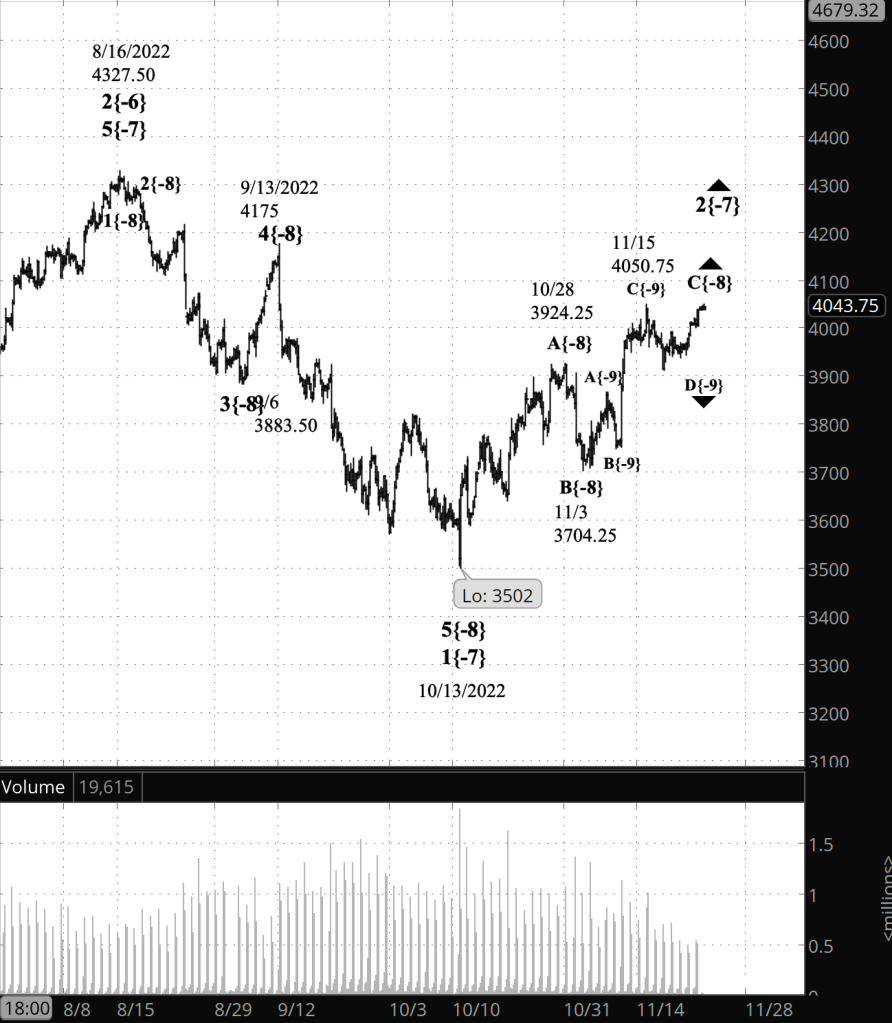
What’s happening now? The S&P 500 E-mini futures continued to rise overnight, reaching 4049.25 and then declining back into the 4030s. U.S. markets are closed today for a holiday, Thanksgiving Day, and so there will be no opening bell.

What does it mean? The correction that began on October 13 is still underway. The overnight high reversed 1-1/2 points below the correction peak so far, 4050.75, attained on November 15. Internally, the correction is in its rising third and last leg, and that rise is in the declining fourth subwave in a five-wave series.

What is the alternative? The November 17 low, 4039.50, was the end the fourth subwave and the rising fifth subwave is underway. When it is complete, it will mark the end of the third leg of the correction and most likely the end of the correction itself.

If the price moves above 4050.75, the prior correction peak, then I shall reanalyze the chart to see if the alternative scenario should be promoted to the principal scenario.

[S&P 500 E-mini futures at 9:35 a.m., 4-hour bars, with volume]

What does Elliott wave theory say? The correction is wave 2{-7}. It is in its 3rd leg, wave C{-8}.

Under the principal analysis, wave C{-8} is in its fourth subwave, wave D{-9}. The alternative analysis sees wave D{-9} as having ended and labels the rise since November 17 as wave E{-9}.

We Are Here.

These are the waves currently in progress under my principal analysis. Each line on the list shows the wave number, with the subscript in curly brackets, the traditional degree name, the starting date, the starting price of the S&P 500 E-mini futures, and the direction of the wave.

  • S&P 500 Index:
  • 5{+3} Supercycle, 7/8/1932, 4.40 (up)
  • 5{+2} Cycle, 12/9/1974, 60.96 (up)
  • 5{+1} Primary, 3/6/2009, 666.79 (up)
  • 5{0} Intermediate, 12/26/2018, 2346.58 (up)
  • 4{-1} Minor, 1/4/2022 4818.62 (down)
  • 1{-2} Minute, 1/4/2022 4818.62 (down)
  • S&P 500 Futures and index:
  • 1{-3} Minuette, 1/4/2022, 4808.25 (down) (futures), 4818.62 (down) (index)
  • S&P 500 Futures:
  • 1{-4} Subminuette, 1/4/2022, 4808.25 (down)
  • 1{-5} Micro, 1/4/2022, 4808.25 (down)
  • 3{-6} Submicro, 8/16/2022, 4327.50 (down)
  • 2{-7} Minuscule, 10/13/2022, 3502 (up)
  • C{-8} Subminuscule, 11/3/2022, 3704.25 (up)

Learning and other resources. Elliott wave analysis provides context, not prophecy. As the 20th century semanticist Alfred Korzybski put it in his book Science and Sanity (1933), “The map is not the territory … The only usefulness of a map depends on similarity of structure between the empirical world and the map.” And I would add, in the ever-changing markets, we can judge that similarity of structure only after the fact.

See the menu page Analytical Methods for a rundown on where to go for information on Elliott wave analysis.

By Tim Bovee, Portland, Oregon, November 24, 2022

Disclaimer

Tim Bovee, Private Trader tracks the analysis and trades of a private trader for his own accounts. Nothing in this blog constitutes a recommendation to buy or sell stocks, options or any other financial instrument. The only purpose of this blog is to provide education and entertainment.

No trader is ever 100 percent successful in his or her trades. Trading in the stock and option markets is risky and uncertain. Each trader must make trading decisions for his or her own account, and take responsibility for the consequences.

License
Creative Commons License

All content on Tim Bovee, Private Trader by Timothy K. Bovee is licensed under a Creative Commons Attribution-ShareAlike 4.0 International License.

Based on a work at www.timbovee.com.

Trader’s Notebook

3:30 p.m. New York time

Half an hour before the closing bell. The S&P 500 rose rapidly after the Federal Open Market Committee minutes from early November were released, moving from 4020 to 4039.25 on the futures in 27 minutes. The price then fell back a bit while remaining above the 61.8% Fibonacci retracement level.

The price remained below the November 15 high, 4050.75 — the high point so far of the upward correction that began on October 13.

My analysis from this morning remains unchanged. Declining wave D{-9} within rising wave C{-8} within the upward correction, wave 2{-7} is underway. If the price moves above 4050.75, then I’ll reconsider the analysis.

I’ve updated the chart.

9:35 a.m. New York time

Market holiday. Tomorrow, Thursday, is the Thanksgiving Day holiday in the United States, and U.S. markets will be closed. They will re-open on Friday at the usual time for an abbreviated session ending at 1 p.m. I shall post analyses at 9:35 a.m. and 12:30 p.m. during Friday’s short session.

What’s happening now? The S&P 500 E-mini futures pushed almost 10 points above the 61.8% Fibonacci retracement level, to 4021.75, and then retreated, falling 10 points below that level. The Fibonacci levels are shown on the chart in red. After the opening bell the price rose back to the 61.8% retracement level.

What does it mean? The 61.8% retracement level is a common stopping point. The question on this chart is, What was it that was stopped? Or at least disrupted.

For my principal analysis, I’m staying with the scenario that I’ve had since last week: The upward correction that began on October 13 is still underway and is in its next-to-the-last subwave within its third and final wave. The fifth and final subwave will follow, likely taking the price above the November 15 high, 4050.75.

What is the alternative? The alternative scenario is also unchanged. The fifth and final subwave within the third wave of the upward correction began from the November 17 low, 3912.50. I consider this scenario to be less likely because the price has not exceeded the November 15 high, which was the end point of the middle wave of the five-subwave series. If the price moves above 4050.75, then the alternative will become the principal analysis.

[S&P 500 E-mini futures at 3:30 p.m., 4-hour bars, with volume]

What does Elliott wave theory say? The upward correct that began on October 13 is wave 2{-7}, a correction within a downtrend, wave 3{-6}, that began on August 16 from 4327.50. The correction’s starting point was 3502.

Under the principal analysis, rising wave C{-8}, the final wave of the three-wave corrective pattern that has been the form of wave 2{-7} so far, is in the fourth of five subwaves, descending wave D{-9}, and will be followed by the rising final wave in the series, wave E{-9}.

Under the alternative analysis, wave D{-9} ended on November 15 at 4050.75 and wave E{-9} is underway.

Wave 2{-7} will be followed by wave 3{-7}, a powerful downtrend that will carry the price down 500 points and lower, perhaps much lower. Big picture, the state of the chart at present is downtrends, from wave 3{-6} up to wave 4{-1}, which began on January 4 from 4808.25. See the “We Are Here” section below for an inventory of waves now in progress.

We Are Here.

These are the waves currently in progress under my principal analysis. Each line on the list shows the wave number, with the subscript in curly brackets, the traditional degree name, the starting date, the starting price of the S&P 500 E-mini futures, and the direction of the wave.

  • S&P 500 Index:
  • 5{+3} Supercycle, 7/8/1932, 4.40 (up)
  • 5{+2} Cycle, 12/9/1974, 60.96 (up)
  • 5{+1} Primary, 3/6/2009, 666.79 (up)
  • 5{0} Intermediate, 12/26/2018, 2346.58 (up)
  • 4{-1} Minor, 1/4/2022 4818.62 (down)
  • 1{-2} Minute, 1/4/2022 4818.62 (down)
  • S&P 500 Futures and index:
  • 1{-3} Minuette, 1/4/2022, 4808.25 (down) (futures), 4818.62 (down) (index)
  • S&P 500 Futures:
  • 1{-4} Subminuette, 1/4/2022, 4808.25 (down)
  • 1{-5} Micro, 1/4/2022, 4808.25 (down)
  • 3{-6} Submicro, 8/16/2022, 4327.50 (down)
  • 2{-7} Minuscule, 10/13/2022, 3502 (up)
  • C{-8} Subminuscule, 11/3/2022, 3704.25 (up)

Learning and other resources. Elliott wave analysis provides context, not prophecy. As the 20th century semanticist Alfred Korzybski put it in his book Science and Sanity (1933), “The map is not the territory … The only usefulness of a map depends on similarity of structure between the empirical world and the map.” And I would add, in the ever-changing markets, we can judge that similarity of structure only after the fact.

See the menu page Analytical Methods for a rundown on where to go for information on Elliott wave analysis.

By Tim Bovee, Portland, Oregon, November 23, 2022

Disclaimer

Tim Bovee, Private Trader tracks the analysis and trades of a private trader for his own accounts. Nothing in this blog constitutes a recommendation to buy or sell stocks, options or any other financial instrument. The only purpose of this blog is to provide education and entertainment.

No trader is ever 100 percent successful in his or her trades. Trading in the stock and option markets is risky and uncertain. Each trader must make trading decisions for his or her own account, and take responsibility for the consequences.

License
Creative Commons License

All content on Tim Bovee, Private Trader by Timothy K. Bovee is licensed under a Creative Commons Attribution-ShareAlike 4.0 International License.

Based on a work at www.timbovee.com.
Trader’s Notebook

3:30 p.m. New York time

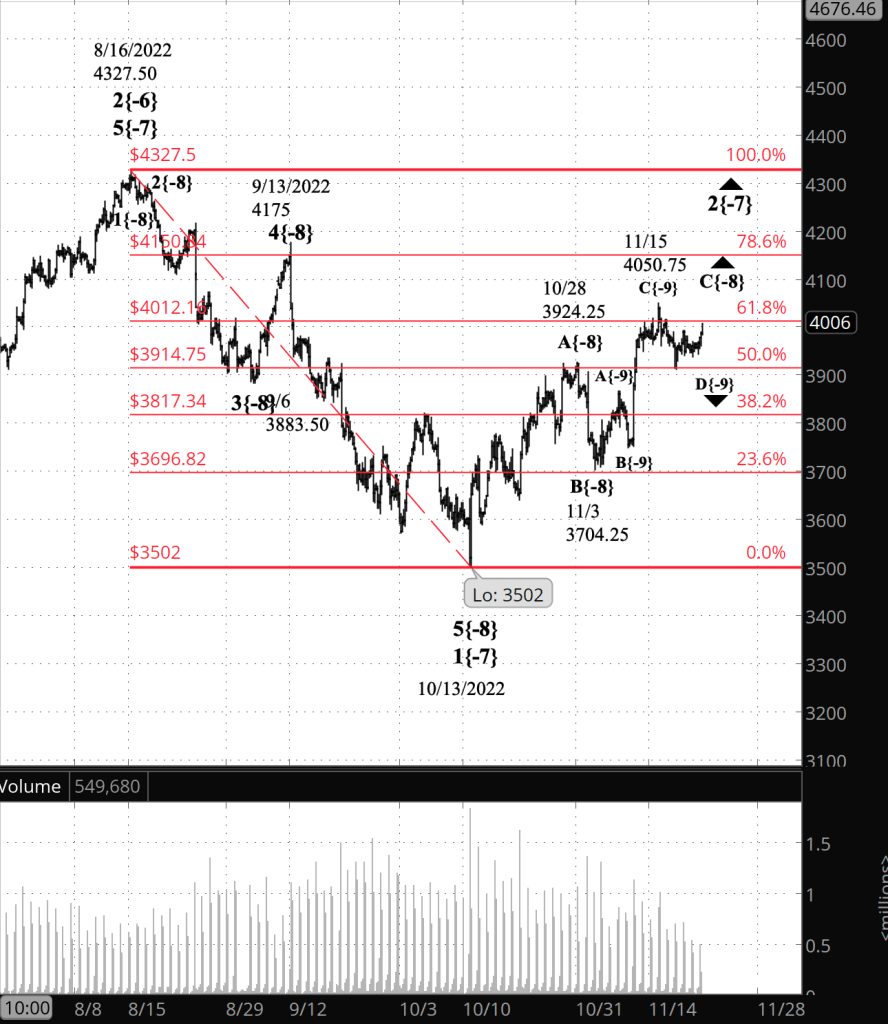
Half an hour before the closing bell. The S&P 500 continued to rise during the session and as the closing bell approached, was nearing the 61.8% Fibonacci retracement level, at 4012. The Fibonacci levels are shown in red on the chart.

The last leg of an upward correction that began on October 13 continues. The present wave inventory is either downward wave D{-9} or alternatively, upward wave E{-9}, within upward wave C{-8} within upward correction 2{-7}.

I’ve updated the chart.

10:30 a.m. New York time

DELL earnings play exit. I’ve exited my short bear call earnings spread on DELL for 49.2% of maximum potential loss and have updated the trade analysis with full results. The company did better than analysts had expected.

9:35 a.m. New York time

What’s happening now? The S&P 500 E-mini futures rose slightly in overnight trading, from the 3940s to the 3980s.

What does it mean? The upward correction that began on October 13 continues and is now in its final leg. When the correction is complete, it will be followed by a powerful decline that will reach below 3502 — the beginning of the correction — and almost certainly significantly below that level.

What are the alternatives? The correction may have ended on November 15 at 4050.75. This seems less likely to me because the correction has taken the form of a Zigzag, meaning that the final leg will have five waves internally. I see three completed legs on the chart and a fourth wave in progress, but no fifth wave of comparable magnitude.

[S&P 500 E-mini futures at 3:30 p.m., 4-hour bars, with volume]

What does Elliott wave theory say? Wave 2{-7}, the upward correction, is still underway and is in wave C{-8}, the last leg of a three-wave Zigzag. Within C{-8}, declining wave D{-9} is underway. It will be followed by rising wave E{-9}, which will complete wave C{-8} and most likely wave 2{-7}.

It sometimes happens that a correction will form a compound structure, linking together two or three corrective patterns. If that’s the case, then wave C{-8} will be followed by a downward correction wave, X{-8}, and then buy a second corrective pattern, delaying the end of the parent wave 2{-7}.

Whenever wave 2{-7} ends, it will be followed by wave 3{-7}. Third waves are usually the longest of the three waves in the direction of a trend — a downtrend in this case — and tend to show a dramatic amount of energy in their falls.

Looking further ahead, wave 3{-7} will be followed by a 4th wave correction and then a downtrending 5th wave, which will complete the parent wave of all of this action: Wave 3{-6}, which began August 16 from 4327.50. A 4th wave correction and a downtrending 5th wave will follow, completing wave 3{6} and beginning a larger 4th wave upward correction, followed by a larger 5th wave decline.

Wave 3{-6} and waves of the same degree that follow are subwaves of downtrending wave 1{-5}, which began on January 4. It is the smallest of a series of nested 1st waves of increasing size, up to wave 4{-1}, a downtrending wave within an expanding Diagonal Triangle, wave 5{0}, that began on December 26, 2018.

Wave 4{-1} will be followed by uptrending wave 5[-1}, the final leg in the Triangle, which will carry the price above the January 4 high, 4818.62 on the index.

When the Triangle is complete, the price will work its way down to levels not seen for many generations.

We Are Here.

These are the waves currently in progress under my principal analysis. Each line on the list shows the wave number, with the subscript in curly brackets, the traditional degree name, the starting date, the starting price of the S&P 500 E-mini futures, and the direction of the wave.

  • S&P 500 Index:
  • 5{+3} Supercycle, 7/8/1932, 4.40 (up)
  • 5{+2} Cycle, 12/9/1974, 60.96 (up)
  • 5{+1} Primary, 3/6/2009, 666.79 (up)
  • 5{0} Intermediate, 12/26/2018, 2346.58 (up)
  • 4{-1} Minor, 1/4/2022 4818.62 (down)
  • 1{-2} Minute, 1/4/2022 4818.62 (down)
  • S&P 500 Futures and index:
  • 1{-3} Minuette, 1/4/2022, 4808.25 (down) (futures), 4818.62 (down) (index)
  • S&P 500 Futures:
  • 1{-4} Subminuette, 1/4/2022, 4808.25 (down)
  • 1{-5} Micro, 1/4/2022, 4808.25 (down)
  • 3{-6} Submicro, 8/16/2022, 4327.50 (down)
  • 2{-7} Minuscule, 10/13/2022, 3502 (up)
  • C{-8} Subminuscule, 11/3/2022, 3704.25 (up)

Learning and other resources. Elliott wave analysis provides context, not prophecy. As the 20th century semanticist Alfred Korzybski put it in his book Science and Sanity (1933), “The map is not the territory … The only usefulness of a map depends on similarity of structure between the empirical world and the map.” And I would add, in the ever-changing markets, we can judge that similarity of structure only after the fact.

See the menu page Analytical Methods for a rundown on where to go for information on Elliott wave analysis.

By Tim Bovee, Portland, Oregon, November 22, 2022

Disclaimer

Tim Bovee, Private Trader tracks the analysis and trades of a private trader for his own accounts. Nothing in this blog constitutes a recommendation to buy or sell stocks, options or any other financial instrument. The only purpose of this blog is to provide education and entertainment.

No trader is ever 100 percent successful in his or her trades. Trading in the stock and option markets is risky and uncertain. Each trader must make trading decisions for his or her own account, and take responsibility for the consequences.

License
Creative Commons License

All content on Tim Bovee, Private Trader by Timothy K. Bovee is licensed under a Creative Commons Attribution-ShareAlike 4.0 International License.

Based on a work at www.timbovee.com.

DELL Trade

Dell Technologies Inc. (DELL)

Update 11/22/2022: I exited my short bear call vertical spread on DELL, 24 days before expiration, for a $0.90 debit per contract/share, a loss before fees of $23 per contract. Shares were trading at $41.70, up $1.42 from the entry level.

The Implied Volatility Rank at exit was 75.9%, down 1.1 points from the entry level.

I exited on the day after entry because that is my usual practice with earnings plays. Earnings beat analysts’ forecast, and shares rose in response. I exited the position for 49.2% of maximum potential loss.

Shares rose by 3.5% over one day for a +1,287% annual rate. The options position produced a 25.6% loss for a -9,328% annual rate.


I have entered a short bear call vertical spread on DELL, using options that trade for the last time 25 days hence, on December 16. The premium is a $0.67 credit per contract share and the stock at the time of entry was priced at $40.28.

The Implied Volatility Ratio stood at 77%.

Premium:$0.67Expire OTM
DELL-bear call spreadStrikeOddsDelta
Calls
Long45.0091.0%12
Break-even43.1777.0%27
Short42.5063.0%42

The premium is 53.6% of the width of the position’s short/long spread. The profit zone covers a 7.2% move to the upside and an unlimited move to the downside.

The risk/reward ratio is 2.7:1, with maximum risk of $183 and maximum reward of $67 per contract.

How I chose the trade. The trade was placed to coincide with DELL’s earnings announcement, after the closing bell on the day of entry. The short strikes were set to coincide with the expected move of $3.38 either way, based on options pricing, which gives a price range of $37.41 to $43.15. The Zacks Investment Research earnings surprise predictor gave DELL a score of -1.35%, with a rank of 4 (sell). The analysts’ consensus is that DELL will announce earnings of $1.59 per share.

By Tim Bovee, Portland, Oregon, November 21, 2022

Disclaimer

Tim Bovee, Private Trader tracks the analysis and trades of a private trader for his own accounts. Nothing in this blog constitutes a recommendation to buy or sell stocks, options or any other financial instrument. The only purpose of this blog is to provide education and entertainment.

No trader is ever 100 percent successful in his or her trades. Trading in the stock and option markets is risky and uncertain. Each trader must make trading decisions for his or her own account, and take responsibility for the consequences.

License
Creative Commons License

All content on Tim Bovee, Private Trader by Timothy K. Bovee is licensed under a Creative Commons Attribution-ShareAlike 4.0 International License.

Based on a work at www.timbovee.com.

Trader’s Notebook

3:30 p.m. New York time

Half an hour before the closing bell. The S&P 500 declined during the day, with a gentleness appropriate for a major holiday week in the United States. This morning’s analysis is unchanged. Wave 2{-7} continues to work through its last internal wave, C{-8}. I’ve updated the upper chart.

1:20 p.m. New York time

DELL earnings play entry. I have entered a bear call spread on DELL, using options that expire on December 16, and have posted an analysis of the trade.

9:35 a.m. New York time

What’s happening now? The S&P 500 E-mini futures declined slightly after trading resumed overnight, remaining between last week’s high and low: 4050.75 and 3912.50.

What does it mean? An upward correction that began on October 13 from 3502 is in its last stages. The present decline is the next-to-the-last movement within the final wave of the correction. It will be followed by an upward movement that will complete the corrective pattern and most likely will mark the end of the correction as well, unless the correction takes a compound form, containing two or three corrective patterns.

So far the upward correction has peeked above the 61.8% Fibonacci retracement level and since then has traded between the 61.8% and 50% Fibonacci levels. The Fibonacci levels are marked on the upper chart in red.

What are the alternatives? Most corrections contain only one corrective pattern. However, a few form a compound structure, with additional corrective patterns.

In either case. When the upward correction is complete, it will be followed by a powerful downtrend that will carry the price below 3502, almost certainly into the 3400s, and perhaps even lower.

Charts. The upper chart shows the S&P 500 E-mini futures from mid-August to the present. The lower chart shows the S&P 500 index from November 2007 to the present, including an expanding Diagonal Triangle discussed in the Elliott wave analysis section, below.

[S&P 500 E-mini futures at 3:30 p.m., 230-minute bars, with volume]

What does Elliott wave theory say? The upward correction is wave 2{-7}, a Zigzag pattern with three waves. The third wave, rising wave C{-8}, is now underway. The last wave in a Zigzag has five subwaves, and the present wave is now in its 4th wave, declining wave D{-9}, which will be followed by a final, rising wave E{-9}, which will most likely exceed the correction’s most recent high, 4050.75 attained on November 15.

The end of wave E{9} will also be the end of waves C{-8} and 2{-7}, the correction in its entirety. The decline that follows will be wave 3{-7}, and from it we can expect all of the energy and power that are characteristic of 3rd waves in a trend.

Looking further ahead, wave 3{-7} will be followed by another upward correction, wave 4{-7}, and then by downtrending wave 5{-7}, which will complete the parent wave 3{-6}, which began on August 16. A 5th wave generally moves beyond the end of the preceding 3rd wave in the series, but sometimes comes up short, an action known as a truncation. And sometimes it can extend, creating an unnaturally long 5th wave. So 5th waves can do the unexpected. They are much like the porridge in “Goldilocks and the Three Bears”: Too hot, too cold, or just right.

The parent wave 3{-6} is contained within a series of downtrending 1st waves, each larger than the one it contains. The size stretches up four levels, to downtrending wave 1{-2}, which is contained within downtrending wave 4{-1}, which began on January 4, 2022.

Wave 4{-1} is the next-to-the-last wave within wave 5{-0}, an expanding Diagonal Triangle that began on December 26, 2018 and will be followed by uptrending wave 5{1}, which will most likely carry the price above the January 4 peak — 4818.62 on the index — unless it is truncated. And like all 5th waves it can be extended, rising far more than expected. All of this will almost certainly carry us through 2023 and perhaps further.

The end of wave 5{-0} will kick off a market decline of world-historical importance. For wave 5{-0} is nested within a series of 5th waves, each larger than the wave it contains, stretching up, at the least, to wave 5{+3}, an uptrending wave that began on July 8, 1932, the date the marks the end of the 1929 crash, which triggered the Great Depression.

The end of wave 5{0} will simultaneously trigger the end of all of those larger 5th waves. The downtrend that follows will probably take decades to complete, although it’s possible that the new crash could be far swifter. As in any downtrend, there will be upward corrections that will provide trading opportunities, but the overall direction of the markets will be down.

[S&P 500 index at 9:35 a.m., 3-day bars, with volume]

We Are Here.

These are the waves currently in progress under my principal analysis. Each line on the list shows the wave number, with the subscript in curly brackets, the traditional degree name, the starting date, the starting price of the S&P 500 E-mini futures, and the direction of the wave.

  • S&P 500 Index:
  • 5{+3} Supercycle, 7/8/1932, 4.40 (up)
  • 5{+2} Cycle, 12/9/1974, 60.96 (up)
  • 5{+1} Primary, 3/6/2009, 666.79 (up)
  • 5{0} Intermediate, 12/26/2018, 2346.58 (up)
  • 4{-1} Minor, 1/4/2022 4818.62 (down)
  • 1{-2} Minute, 1/4/2022 4818.62 (down)
  • S&P 500 Futures and index:
  • 1{-3} Minuette, 1/4/2022, 4808.25 (down) (futures), 4818.62 (down) (index)
  • S&P 500 Futures:
  • 1{-4} Subminuette, 1/4/2022, 4808.25 (down)
  • 1{-5} Micro, 1/4/2022, 4808.25 (down)
  • 3{-6} Submicro, 8/16/2022, 4327.50 (down)
  • 2{-7} Minuscule, 10/13/2022, 3502 (up)
  • C{-8} Subminuscule, 11/3/2022, 3704.25 (up)

Learning and other resources. Elliott wave analysis provides context, not prophecy. As the 20th century semanticist Alfred Korzybski put it in his book Science and Sanity (1933), “The map is not the territory … The only usefulness of a map depends on similarity of structure between the empirical world and the map.” And I would add, in the ever-changing markets, we can judge that similarity of structure only after the fact.

See the menu page Analytical Methods for a rundown on where to go for information on Elliott wave analysis.

By Tim Bovee, Portland, Oregon, November 21, 2022

Disclaimer

Tim Bovee, Private Trader tracks the analysis and trades of a private trader for his own accounts. Nothing in this blog constitutes a recommendation to buy or sell stocks, options or any other financial instrument. The only purpose of this blog is to provide education and entertainment.

No trader is ever 100 percent successful in his or her trades. Trading in the stock and option markets is risky and uncertain. Each trader must make trading decisions for his or her own account, and take responsibility for the consequences.

License
Creative Commons License

All content on Tim Bovee, Private Trader by Timothy K. Bovee is licensed under a Creative Commons Attribution-ShareAlike 4.0 International License.

Based on a work at www.timbovee.com.

Trader’s Notebook

3:30 p.m. New York time

Half an hour before the closing bell. The S&P 500 futures peaked at 3994 before the opening bell, fell to to the 3940s, and then rose slightly. The movements were subwaves of the next-to-the-last wave within the larger final wave of an upward correction that began on October 13.

In Elliott wave terminology: The movements were subwaves of downward wave D{-9} within rising wave C{-8}, the final wave within wave 2{-7}, the upward correction that began on October 13.

No change in the analysis. I’ve updated the chart.

9:35 a.m. New York time

What’s happening now? The S&P 500 E-mini futures rose in overnight trading, returning from the session low, 3912.50, to the 3990s, while remaining below the November 15 high, 4050.75.

What does it mean? Two alternatives of nearly equal likelihood. As principal analysis for the chart, I’ve chosen to treat the rise as an upward correction within the downward wave that began on November 15. That downward wave is the next-to-the-last wave within an upward correction that began on October 13.

What is the alternative? The alternative is to consider Thursday’s session low to be the end of the decline from November 15 and the beginning of the final subwave within the third and probably final wave of the upward correction.

If the price remains below the November 15 high, 4050.75, and reverses to the downside, then the principal scenario gains credence. If the price moves above 4050.75 and keeps rising, then the alternative scenario is more likely.

[S&P 500 E-mini futures at 3:30 p.m., 230-minute bars, with volume]

What does Elliott wave theory say? The upward correction that began on October 13 is wave 2{-7}.

Under the principal scenario, downward wave D{-8} within the correction is underway, havng begun on November 15 from 4050.75. Under the alternative, wave D{-8} ended at Thursday’s session low, 3912.50, and rising wave E{-8} began.

Wave 2{-7} is a subwave of downtrending wave 3{-6}, which began on August 16 from 4327.50 and which is nested within a series of downward waves of increasing size, stretching up wave 4{-1}, which began on January 4 from 4818.62 on the index.

Enclosing them all is wave 5{0}, an expanding Diagonal Triangle that began on December 26, 2018, from 2346.58 on the index. Wave 4{-1} is the next-to-the-last wave within the Triangle. It will be followed by a powerful push to the upside, wave 5{-1}, which will complete the Triangle and mark the start of a major decline.

We Are Here.

These are the waves currently in progress under my principal analysis. Each line on the list shows the wave number, with the subscript in curly brackets, the traditional degree name, the starting date, the starting price of the S&P 500 E-mini futures, and the direction of the wave.

  • S&P 500 Index:
  • 5{+3} Supercycle, 7/8/1932, 4.40 (up)
  • 5{+2} Cycle, 12/9/1974, 60.96 (up)
  • 5{+1} Primary, 3/6/2009, 666.79 (up)
  • 5{0} Intermediate, 12/26/2018, 2346.58 (up)
  • 4{-1} Minor, 1/4/2022 4818.62 (down)
  • 1{-2} Minute, 1/4/2022 4818.62 (down)
  • S&P 500 Futures and index:
  • 1{-3} Minuette, 1/4/2022, 4808.25 (down) (futures), 4818.62 (down) (index)
  • S&P 500 Futures:
  • 1{-4} Subminuette, 1/4/2022, 4808.25 (down)
  • 1{-5} Micro, 1/4/2022, 4808.25 (down)
  • 3{-6} Submicro, 8/16/2022, 4327.50 (down)
  • 2{-7} Minuscule, 10/13/2022, 3502 (up)
  • C{-8} Subminuscule, 11/3/2022, 3704.25 (up)

Learning and other resources. Elliott wave analysis provides context, not prophecy. As the 20th century semanticist Alfred Korzybski put it in his book Science and Sanity (1933), “The map is not the territory … The only usefulness of a map depends on similarity of structure between the empirical world and the map.” And I would add, in the ever-changing markets, we can judge that similarity of structure only after the fact.

See the menu page Analytical Methods for a rundown on where to go for information on Elliott wave analysis.

By Tim Bovee, Portland, Oregon, November 18, 2022

Disclaimer

Tim Bovee, Private Trader tracks the analysis and trades of a private trader for his own accounts. Nothing in this blog constitutes a recommendation to buy or sell stocks, options or any other financial instrument. The only purpose of this blog is to provide education and entertainment.

No trader is ever 100 percent successful in his or her trades. Trading in the stock and option markets is risky and uncertain. Each trader must make trading decisions for his or her own account, and take responsibility for the consequences.

License
Creative Commons License

All content on Tim Bovee, Private Trader by Timothy K. Bovee is licensed under a Creative Commons Attribution-ShareAlike 4.0 International License.

Based on a work at www.timbovee.com.
Trader’s Notebook

3:30 p.m. New York time

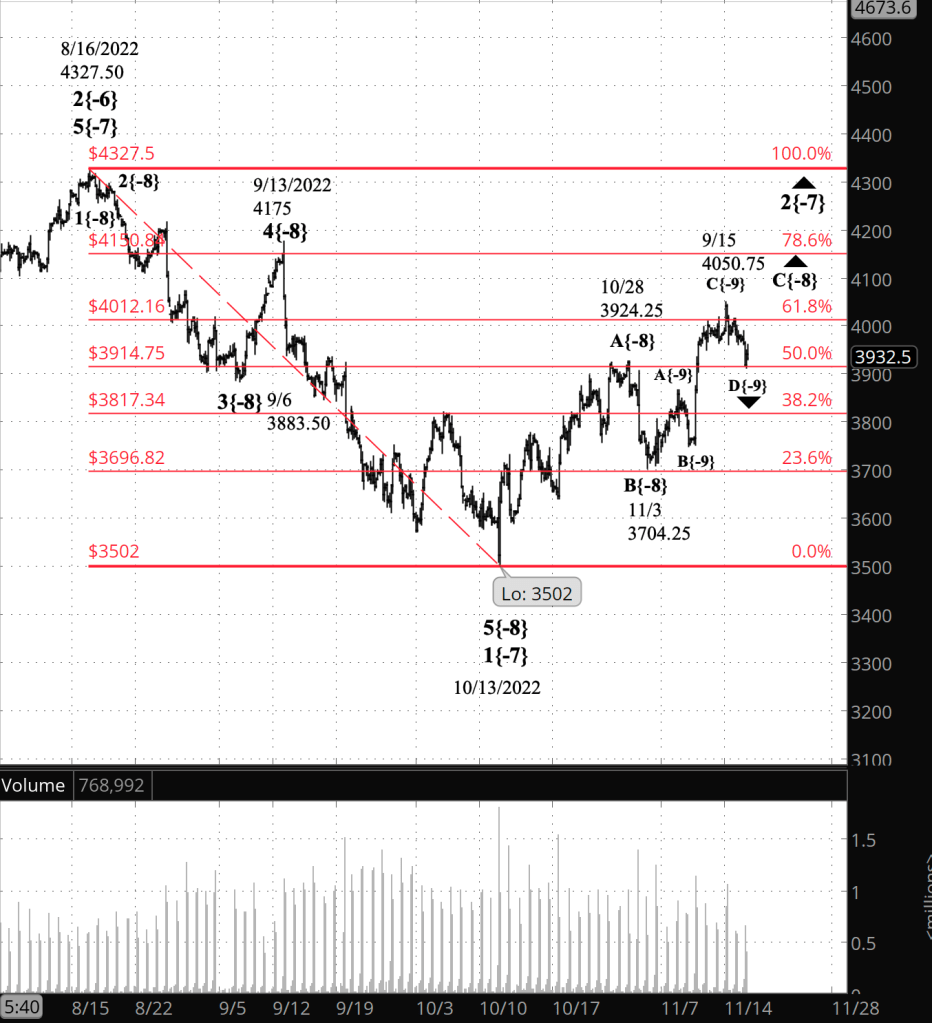
Half an hour before the closing bell. The S&P 500 E-mini futures, 4 minutes before the opening bell, reached a low for the day of 3912.50, thereafter rising during the session into the low 3960s and then resuming the decline.

No change from this morning’s analysis. The rising final wave within an upward correction that began on October 13 is still underway, and internally, it is in a declining next-to-the-last wave. In Elliott wave analytical terminology, declining wave B{-9} within rising wave C{-8} within the upward correction, wave 2{-7} is underway.

I’ve updated the chart.

9:35 a.m. New York time

What’s happening now? The S&P 500 E-mini futures continued to fall in overnight trading, reaching into the 2910s.

What does it mean? The next-to-the-last wave within the final wave of an upward correction that began on October 13 has begun its decline from Monday’s high, 4050.75.

What are the alternatives? None at present. I’m sure some will develop. They always do.

[S&P 500 E-mini futures at 3:30 p.m., 230-minute bars, with volume]

What does Elliott wave theory say? Declining wave D{-9} within rising wave C{-8}, both within the rising correction, wave 2{-7}, are underway. Wave D{-9} has so far reached returned to the 50% Fibonacci retracement level, 3914.75, falling from just beyond the 61.8% retracement level.

Wave 2{-7} has taken the form of a Zigzag, with five subwaves within the first of the three waves. In a Zigzag (and also a Flat), the third wave in a correction also has five subwaves. Presently, the 4th of those five subwaves is underway, wave D{-9}.

Wave D{-9} will be followed by the final subwave, wave E{-9}, which will mark the completion of wave C{-8} and of the upward correction, wave 2{-7}.

The C wave with within a Zigzag is often about the same length as the A wave. The length of wave A{-8} was 422.25. Wave C{-8} began at 3704.25. So the Wave C{-8} endpoint typically would be around 4126.50, about 127 points above Monday’s high, 4050.75, almost reaching the 78.6% Fibonacci retracement level.

So what comes next? Wave 2{-7} will be followed by wave 3{-7}, a powerful decline that will almost certainly carry the price into the 3400s and perhaps significantly lower, completing the parent wave 3{-6}, which began on August 16 from 4327.50.

As a trader, I’m looking at it this way: I’ve got a bit of a down, a bit of an up, and then a big, big down.

Wave 4{-6}, an upward correction, will follow the energetic 3rd wave decline.

We Are Here.

These are the waves currently in progress under my principal analysis. Each line on the list shows the wave number, with the subscript in curly brackets, the traditional degree name, the starting date, the starting price of the S&P 500 E-mini futures, and the direction of the wave.

  • S&P 500 Index:
  • 5{+3} Supercycle, 7/8/1932, 4.40 (up)
  • 5{+2} Cycle, 12/9/1974, 60.96 (up)
  • 5{+1} Primary, 3/6/2009, 666.79 (up)
  • 5{0} Intermediate, 12/26/2018, 2346.58 (up)
  • 4{-1} Minor, 1/4/2022 4818.62 (down)
  • 1{-2} Minute, 1/4/2022 4818.62 (down)
  • S&P 500 Futures and index:
  • 1{-3} Minuette, 1/4/2022, 4808.25 (down) (futures), 4818.62 (down) (index)
  • S&P 500 Futures:
  • 1{-4} Subminuette, 1/4/2022, 4808.25 (down)
  • 1{-5} Micro, 1/4/2022, 4808.25 (down)
  • 3{-6} Submicro, 8/16/2022, 4327.50 (down)
  • 2{-7} Minuscule, 10/13/2022, 3502 (up)
  • C{-8} Subminuscule, 11/3/2022, 3704.25 (up)

Learning and other resources. Elliott wave analysis provides context, not prophecy. As the 20th century semanticist Alfred Korzybski put it in his book Science and Sanity (1933), “The map is not the territory … The only usefulness of a map depends on similarity of structure between the empirical world and the map.” And I would add, in the ever-changing markets, we can judge that similarity of structure only after the fact.

See the menu page Analytical Methods for a rundown on where to go for information on Elliott wave analysis.

By Tim Bovee, Portland, Oregon, November 17, 2022

Disclaimer

Tim Bovee, Private Trader tracks the analysis and trades of a private trader for his own accounts. Nothing in this blog constitutes a recommendation to buy or sell stocks, options or any other financial instrument. The only purpose of this blog is to provide education and entertainment.

No trader is ever 100 percent successful in his or her trades. Trading in the stock and option markets is risky and uncertain. Each trader must make trading decisions for his or her own account, and take responsibility for the consequences.

License
Creative Commons License

All content on Tim Bovee, Private Trader by Timothy K. Bovee is licensed under a Creative Commons Attribution-ShareAlike 4.0 International License.

Based on a work at www.timbovee.com.

Trader’s Notebook

3:30 p.m. New York time

Half an hour before the closing bell. The S&P 500 traded narrowly during the session, dropping back into the 3960s on the futures. No change in the analysis. The final wave within an upward correction that began on October 13 continues. That’s wave C{-8} within wave 2{-7}.

9:35 a.m. New York time

What’s happening now? The S&P 500 E-mini futures continued to fall in yesterday’s trading, reaching into the 3970s. Yesterday’s high and low — 4050.75 and 3960 — define the range within which the price has remained since then.

What does it mean? The analysis remains unchanged for another day, as it seeks to answer the question, “Where’s does the correction end?” It’s an important question, since the high will most likely mark the end of an upward correction that began on October 13 from 3502. And the answer to the question is, a shrug. Nobody knows.

If the price reaches above yesterday’s high, then the rise that began on November 3 from 3704.25 is still underway, as is the upward correction. I’ve chosen that as principal analysis, but that’s an arbitrary decision, driven by the absence of clear evidence that a strong decline has begun.

What are the alternatives?

If the price turns and falls below the 3960, the lower level of the range, then that increases the likelihood that yesterday’s high marked the end of the rise from November 3, and the end of the upward correction. The price since the high has traced three waves — down, up, down — in a pattern that is consistent with the early steps in a downtrend.

[S&P 500 E-mini futures at 3:30 p.m., 230-minute bars, with volume]

What does Elliott wave theory say? The upward correction that began on October 13 is wave 2{-7}. Internally, it is in its final wave, C{-8}, which began on November 3.

Under the principal analysis, wave C{-8} is in its third subwave, C{-9}. It will be followed by a downward wave D{-9} and then a push to a new high, wave E{-9}, which will complete wave C{-8} and most likely wave 2{-7} as well. It is possible, although not likely, that wave 2{-7} will form a compound correction pattern, stringing together two or three corrective patterns before reaching its end.

Under the alternative analysis, wave C{-8} yesterday completed its 5th internal wave, E{-9}. If wave 2{-7} is forming a simple structure, with a single corrective pattern, then the 2nd wave is over and a strong downtrend, wave 3{-7}, has begun. It will almost certainly carry the price below 3500, perhaps significantly below. If the structure is that of a compound correction, then wave C{-8} will be followed by a declining connector wave, X{-8}, and then a second corrective pattern.

This is all happening within downtrending wave 3{-6}, which began on August 16, from 4127.50. And wave 3{-6} is itself a subwave in a fractal pattern of nested downward waves of increasing size, stretching back to the Great Depression in the 1930s. There will be large ups and downs within the fractal pattern, and as a trader, I plan to keep in mind that the downs will be trends and therefore have more power than will the ups, which will be corrections, running contrary to the trend.

As my mentors in trading often said, “The trend is your friend”, and those will be words to trade by in the coming years.

We Are Here.

These are the waves currently in progress under my principal analysis. Each line on the list shows the wave number, with the subscript in curly brackets, the traditional degree name, the starting date, the starting price of the S&P 500 E-mini futures, and the direction of the wave.

  • S&P 500 Index:
  • 5{+3} Supercycle, 7/8/1932, 4.40 (up)
  • 5{+2} Cycle, 12/9/1974, 60.96 (up)
  • 5{+1} Primary, 3/6/2009, 666.79 (up)
  • 5{0} Intermediate, 12/26/2018, 2346.58 (up)
  • 4{-1} Minor, 1/4/2022 4818.62 (down)
  • 1{-2} Minute, 1/4/2022 4818.62 (down)
  • S&P 500 Futures and index:
  • 1{-3} Minuette, 1/4/2022, 4808.25 (down) (futures), 4818.62 (down) (index)
  • S&P 500 Futures:
  • 1{-4} Subminuette, 1/4/2022, 4808.25 (down)
  • 1{-5} Micro, 1/4/2022, 4808.25 (down)
  • 3{-6} Submicro, 8/16/2022, 4327.50 (down)
  • 2{-7} Minuscule, 10/13/2022, 3502 (up)
  • C{-8} Subminuscule, 11/3/2022, 3704.25 (up)

Learning and other resources. Elliott wave analysis provides context, not prophecy. As the 20th century semanticist Alfred Korzybski put it in his book Science and Sanity (1933), “The map is not the territory … The only usefulness of a map depends on similarity of structure between the empirical world and the map.” And I would add, in the ever-changing markets, we can judge that similarity of structure only after the fact.

See the menu page Analytical Methods for a rundown on where to go for information on Elliott wave analysis.

By Tim Bovee, Portland, Oregon, November 6, 2022

Disclaimer

Tim Bovee, Private Trader tracks the analysis and trades of a private trader for his own accounts. Nothing in this blog constitutes a recommendation to buy or sell stocks, options or any other financial instrument. The only purpose of this blog is to provide education and entertainment.

No trader is ever 100 percent successful in his or her trades. Trading in the stock and option markets is risky and uncertain. Each trader must make trading decisions for his or her own account, and take responsibility for the consequences.

License
Creative Commons License

All content on Tim Bovee, Private Trader by Timothy K. Bovee is licensed under a Creative Commons Attribution-ShareAlike 4.0 International License.

Based on a work at www.timbovee.com.
Trader’s Notebook

3:30 p.m. New York time

Half an hour before the closing bell. During the session the S&P 500 futures declined from the overnight high, 4050.75, to 3960, and then rose slightly. The decline isn’t sufficient to conclude that the rise from November 3 has ended, so this morning’s analysis stands: The upward correction that began on October 13 is still underway. I’ve updated the chart.

9:35 a.m. New York time

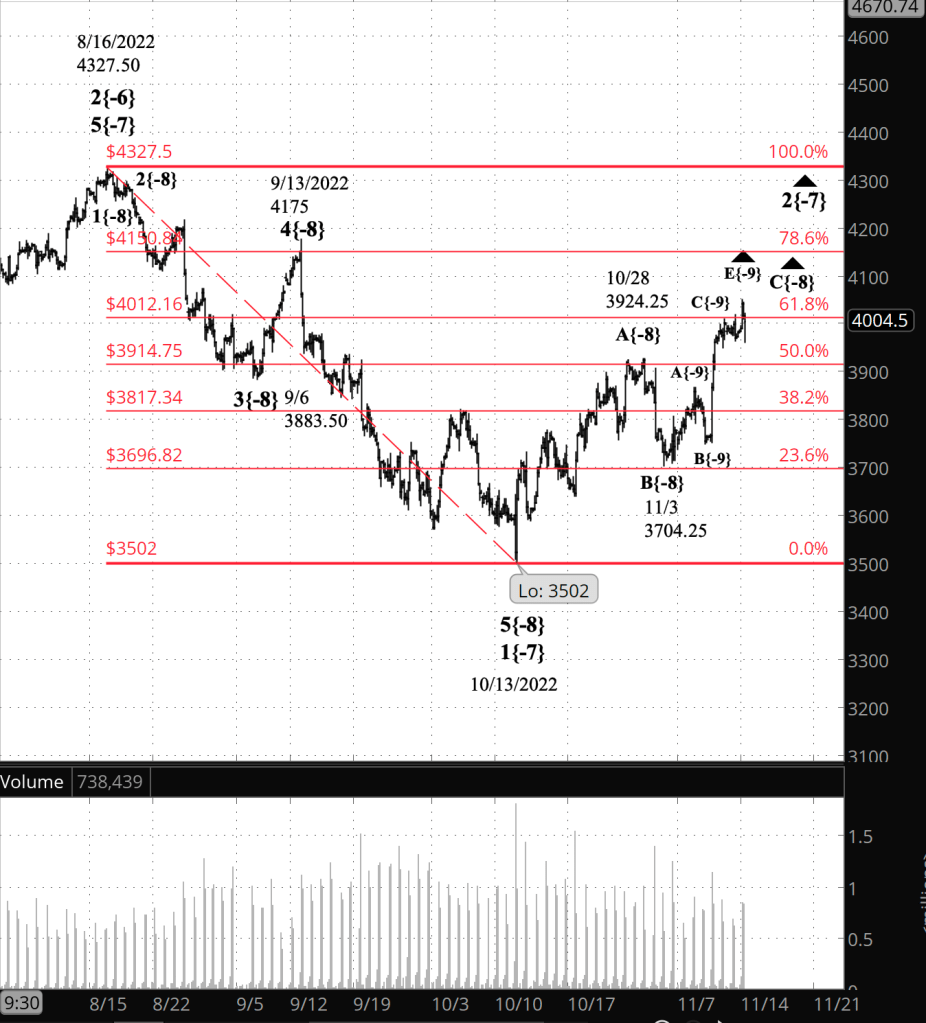
What’s happening now? The S&P 500 E-mini futures reached 4050.75 in overnight trading, a new high in the rise that began on November 3 from 3704.25.

What does it mean? The rise is the final wave within the final wave of that rise that began on October 13 from 3502, an upward correction following the decline that began on August 16 from 4327.50. The correction has completed all of its requirements of form, as laid out in Elliott wave theory, and so any new high could mark the end of the correction and the beginning of a powerful downtrend that will carry the price below 3502, almost without a doubt significantly below that level.

I’ve marked the chart as though the correction were still underway. Such structures tend to end at Fibonacci retracement levels (although not always). The next higher Fib level is the 78.6% retracement, at 4150.84. (The Fibonacci levels are shown on the chart in red.)

What are the alternatives? However, the chances are about equal that the correction ended at the overnight high and that the subsequent small decline is the tentative beginning of what will turn out to be a powerful downtrend.

If the price rises above 4050.75, then the principal scenario matches the chart: The correction continues. The further the price continues to fall, the greater the likelihood that the alternative scenario matches the chart: The correction has ended.

[S&P 500 E-mini futures at 3:30 p.m., 230-minute bars, with volume]

What does Elliott wave theory say? The upward correction is wave 2{-7}, which began on October 13. It is in its third segment, wave C{-8}, which in turn is in its final segment, wave E{-9}.

Under the alternative scenario, waves E{-9}, C{-8} and 2{-7} all ended at the overnight high, 4050.75.

The correction is a subwave of wave 3{-6}, a downtrend that began on August 16.

In either case, wave 2{-7} will be followed by wave 3{-7}, a powerful downtrend that will carry the precise below the start of wave 2{-7} — 3502 — and almost certainly significantly lower, into the 3400s or even the 3300s. Wave 3{-7} will be followed by another upward correction, wave 4{-7}, and then a final decline to new lows that will complete wave 3{-6}.

A larger upward correction, wave 4{-6}, will follow, and will be followed in turn by wave 5{-6}, a downtrend that will complete the parent, downtrending wave 1{-5}, which began on January 4 from 4808.25.

That starting point of wave 1{-5} is also the starting point of a nested series of increasingly larger 1st waves, stretching up to wave 1{-2}. It’s parent, wave 4{-1}, is the downtrending next-to-the-last wave within a large expanding Diagonal Triangle that began on December 26, 2018 from 2346.48 on the index.

There’s a lot of downside in that fractal stew, which will dominant the markets well into next year and possibly into 2024, seasoned by the occasional upward correction.

We Are Here.

These are the waves currently in progress under my principal analysis. Each line on the list shows the wave number, with the subscript in curly brackets, the traditional degree name, the starting date, the starting price of the S&P 500 E-mini futures, and the direction of the wave.

  • S&P 500 Index:
  • 5{+3} Supercycle, 7/8/1932, 4.40 (up)
  • 5{+2} Cycle, 12/9/1974, 60.96 (up)
  • 5{+1} Primary, 3/6/2009, 666.79 (up)
  • 5{0} Intermediate, 12/26/2018, 2346.58 (up)
  • 4{-1} Minor, 1/4/2022 4818.62 (down)
  • 1{-2} Minute, 1/4/2022 4818.62 (down)
  • S&P 500 Futures and index:
  • 1{-3} Minuette, 1/4/2022, 4808.25 (down) (futures), 4818.62 (down) (index)
  • S&P 500 Futures:
  • 1{-4} Subminuette, 1/4/2022, 4808.25 (down)
  • 1{-5} Micro, 1/4/2022, 4808.25 (down)
  • 3{-6} Submicro, 8/16/2022, 4327.50 (down)
  • 2{-7} Minuscule, 10/13/2022, 3502 (up)
  • C{-8} Subminuscule, 11/3/2022, 3704.25 (up)

Learning and other resources. Elliott wave analysis provides context, not prophecy. As the 20th century semanticist Alfred Korzybski put it in his book Science and Sanity (1933), “The map is not the territory … The only usefulness of a map depends on similarity of structure between the empirical world and the map.” And I would add, in the ever-changing markets, we can judge that similarity of structure only after the fact.

See the menu page Analytical Methods for a rundown on where to go for information on Elliott wave analysis.

By Tim Bovee, Portland, Oregon, November 15, 2022

Disclaimer

Tim Bovee, Private Trader tracks the analysis and trades of a private trader for his own accounts. Nothing in this blog constitutes a recommendation to buy or sell stocks, options or any other financial instrument. The only purpose of this blog is to provide education and entertainment.

No trader is ever 100 percent successful in his or her trades. Trading in the stock and option markets is risky and uncertain. Each trader must make trading decisions for his or her own account, and take responsibility for the consequences.

License
Creative Commons License

All content on Tim Bovee, Private Trader by Timothy K. Bovee is licensed under a Creative Commons Attribution-ShareAlike 4.0 International License.

Based on a work at www.timbovee.com.