Trader’s Notebook

3:30 p.m. New York time

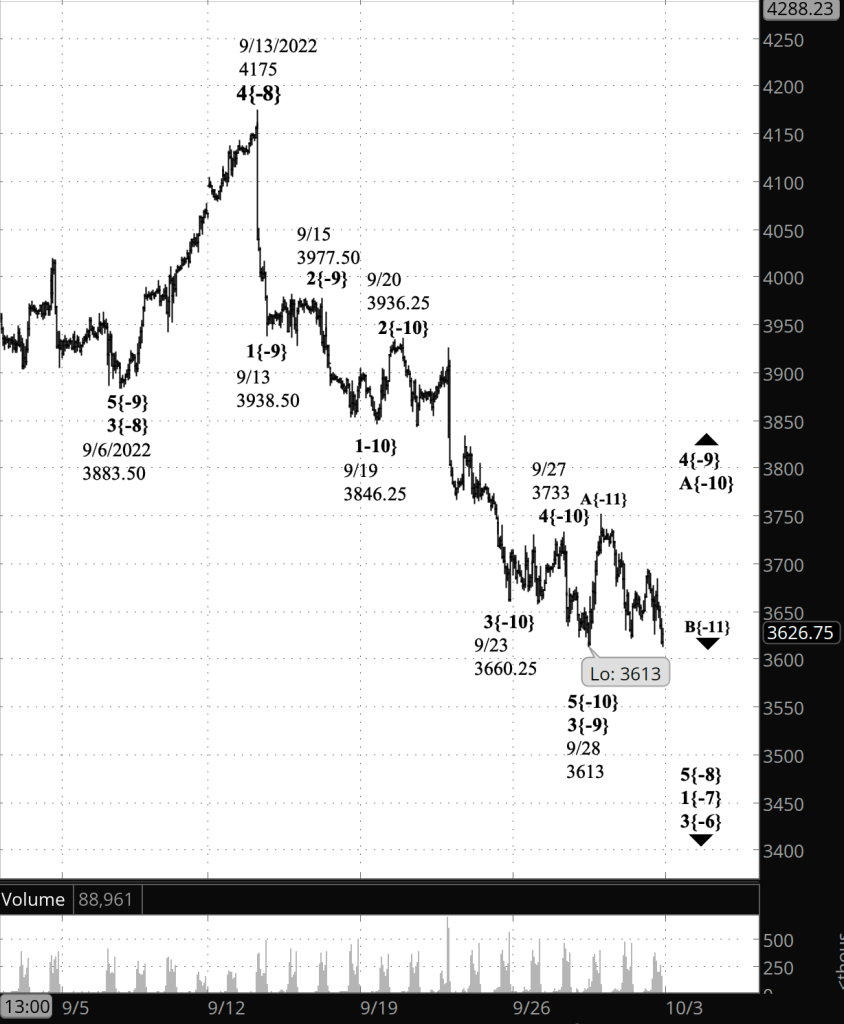
Half an hour before the closing bell. The S&P 500 fell below Thursday’s low, 3660.25 on the futures. The shortness of the preceding rise and the depth of the fall suggest that wave B{-10} within an upward correction, wave 4{-9}, is still underway. This was the alternative scenario in this morning’s analysis, and I’ve changed the upper chart’s labeling to conform.

9:35 a.m. New York time

What’s happening now? The S&P 500 E-mini futures rose overnight into the 3690s and then declined back into the 3640s.

What does it mean? The first leg of an upward correction that began on September 28 is underway and appears to now be in its third internal wave.

What are the alternatives? The third internal wave seems to be overly small, and so it may well be a movement of an even smaller degree, perhaps continuing second internal wave.
[S&P 500 E-mini futures at 3:30 p.m., hourly bars, with volume]

What does Elliott wave theory say? By my principal analysis, upward wave C{-11} is underway. It is enclosed by upward wave A{-10} within an upward correction, wave 4{-9}. The alternative analysis speculates that wave C{-11} is actually part of the preceding downward wave, B{-11}, which is not yet complete.

This is all happening within a series of increasingly larger downtrending waves, nested like Russian matryoshka dolls. The waves range from 5{-8}, which began on September 13 from 4175 on the futures, up to descending wave 4{-1}, which began on January 4 from 4918.62 in the index. The entire series is contained within an expanding Diagonal Triangle, wave 5{0}, which began on December 26, 2018. Wave 4{-1} will be followed by an ascending wave, 5{-1}, that will carry the price to new highs and, when complete, will also be the endpoint of the Triangle.

This chart shows the Diagonal Triangle in its entirety so far. The red lines are the Triangle’s price-channel boundaries.

[S&P 500 index at 9:35 a.m., 3-day bars]

We Are Here.

These are the waves currently in progress under my principal analysis. Each line on the list shows the wave number, with the subscript in curly brackets, the traditional degree name, the starting date, the starting price of the S&P 500 E-mini futures, and the direction of the wave.

  • S&P 500 Index:
  • 5{+3} Supercycle, 7/8/1932, 4.40 (up)
  • 5{+2} Cycle, 12/9/1974, 60.96 (up)
  • 5{+1} Primary, 3/6/2009, 666.79 (up)
  • 5{0} Intermediate, 12/26/2018, 2346.58 (up)
  • 4{-1} Minor, 1/4/2022 4818.62 (down)
  • 1{-2} Minute, 1/4/2022 4818.62 (down)
  • S&P 500 Futures and index:
  • 1{-3} Minuette, 1/4/2022, 4808.25 (down) (futures), 4818.62 (down) (index)
  • S&P 500 Futures:
  • 1{-4} Subminuette, 1/4/2022, 4808.25 (down)
  • 1{-5} Micro, 1/4/2022, 4808.25 (down)
  • 3{-6} Submicro, 8/16/2022, 4325.28 (down)
  • 1{-7} Minuscule, 8/16/2022, 4325.28 (down)
  • 5{-8} Subminuscule, 9/13/2022, 4175 (down)

Learning and other resources. Elliott wave analysis provides context, not prophecy. As the 20th century semanticist Alfred Korzybski put it in his book Science and Sanity (1933), “The map is not the territory … The only usefulness of a map depends on similarity of structure between the empirical world and the map.” And I would add, in the ever-changing markets, we can judge that similarity of structure only after the fact.

See the menu page Analytical Methods for a rundown on where to go for information on Elliott wave analysis.

By Tim Bovee, Portland, Oregon, September 30, 2022

Disclaimer

Tim Bovee, Private Trader tracks the analysis and trades of a private trader for his own accounts. Nothing in this blog constitutes a recommendation to buy or sell stocks, options or any other financial instrument. The only purpose of this blog is to provide education and entertainment.

No trader is ever 100 percent successful in his or her trades. Trading in the stock and option markets is risky and uncertain. Each trader must make trading decisions for his or her own account, and take responsibility for the consequences.

License
Creative Commons License

All content on Tim Bovee, Private Trader by Timothy K. Bovee is licensed under a Creative Commons Attribution-ShareAlike 4.0 International License.

Based on a work at www.timbovee.com.

Trader’s Notebook

3:30 p.m. New York time

Half an hour before the closing bell. The S&P 500 fell during the day, continuing the decline from yesterday’s high, 3751.25 on the futures, into the 3620s. The second segment within the first leg of a three-leg upward correction is underway — Wave B{-11} within wave A{-10} within wave 4{-9}, which began on September 28 from 3613.

No change in the analysis. I’ve updated the chart.

9:35 a.m. New York time

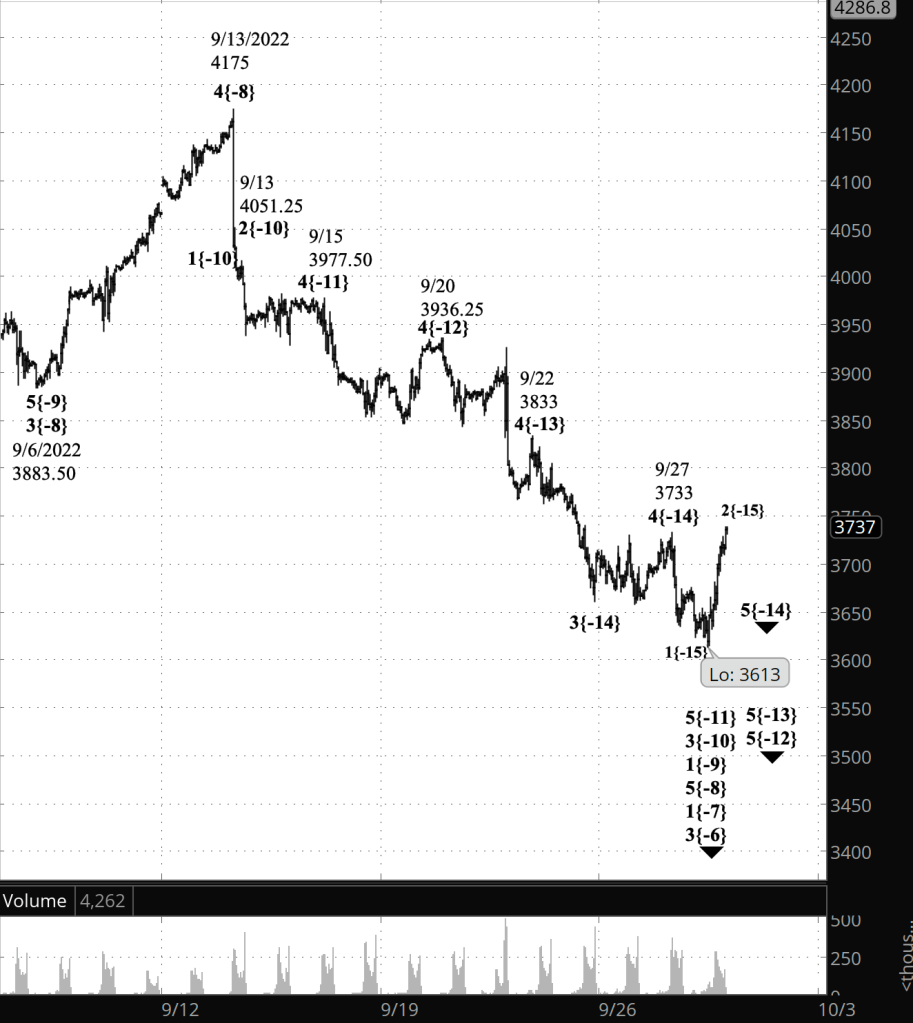
What’s happening now? The S&P 500 E-mini futures declined in overnight trading, pulling back from yesterday’s session high, 3726.50.

What does it mean? The strength of yesterday’s rise forced a full re-analysis of the decline that began on September 13. Under the new analysis, an upward correction began yesterday and will retrace a portion of the decline that began on September 15. Yesterday’s rise is the initial leg of the first part of a three-part correction.

See the Elliott wave theory section below for details of the re-analysis.

What are the alternatives? It’s possible to consider yesterday’s rise to have completed the first part of the upward correction. The lack of visible internal structure within that rise persuades me that the principal analysis has the stronger case.

[S&P 500 E-mini futures at 3:30 p.m., 50-minute bars, with volume]

What does Elliott wave theory say? As I noted in yesterday’s closing post, the rapid price rise, wave 2{-15}, moved above the September 27 high, wave 1{-15}, and in doing so under the old analysis it broke a rule of Elliott wave theory: A 2nd wave can’t move above the start of the preceding 1st wave. To bring analysis back in line with the reality of the chart, I’ve done a full re-analysis.

Under the new principal analysis,

  • the September 27 high is wave 4{-10} (formerly wave 4{-14}),
  • the September 28 low is the end of wave 5{-10} and its parent, wave 3{-9} (formerly the end of wave 1{-15})
  • and the subsequent rise is wave A{-11} within wave A{-10} within wave 4{-9} (formerly wave 2{-15} within wave 4{-14}.

Under the new alternative analysis, the subsequent rise is the entirety of wave A{-10}.

The difficulty posted by the decline from September 13 is the initial wave, 1{-9}, which is 236.50 points in length, easily the longest wave within the entire decline to date. A valid count must ensure that no 3rd wave is the shortest of the three waves in the direction of a trend, wave 1, 3 and 5. To meet that requirement, the decline from September 15-19 following wave 2{-9} can’t be wave 3{-9} — it’s too short. So I’ve adopted the usual solution and pushed the wave degrees down one level, making that decline wave 1{-10} within wave 3{-9}, and following through later events with that same degree structure.

In my tinkering with the count, I was also able to avoid taking the wave degrees down to a such a small level as the prior count had required. All in all, it’s a much simpler description of the fractal structure, and brings the chart labeling back in in line with Elliott wave theory, not at all a trivial matter.

The larger picture is unchanged. Everything described above is happening within wave 5{-8}, a downtrend that began on September 13 from 4175. It lies within a series of nested waves, each larger than the wave it encloses, stretching up to wave 4{-1}, which began on January 4 from 4818.62 on the index, the next-to-the-last wave of a Diagonal Triangle, uptrending wave 5{0}, that began on December 26, 2018 from 2346.58 on the index.

We Are Here.

These are the waves currently in progress under my principal analysis. Each line on the list shows the wave number, with the subscript in curly brackets, the traditional degree name, the starting date, the starting price of the S&P 500 E-mini futures, and the direction of the wave.

  • S&P 500 Index:
  • 5{+3} Supercycle, 7/8/1932, 4.40 (up)
  • 5{+2} Cycle, 12/9/1974, 60.96 (up)
  • 5{+1} Primary, 3/6/2009, 666.79 (up)
  • 5{0} Intermediate, 12/26/2018, 2346.58 (up)
  • 4{-1} Minor, 1/4/2022 4818.62 (down)
  • 1{-2} Minute, 1/4/2022 4818.62 (down)
  • S&P 500 Futures and index:
  • 1{-3} Minuette, 1/4/2022, 4808.25 (down) (futures), 4818.62 (down) (index)
  • S&P 500 Futures:
  • 1{-4} Subminuette, 1/4/2022, 4808.25 (down)
  • 1{-5} Micro, 1/4/2022, 4808.25 (down)
  • 3{-6} Submicro, 8/16/2022, 4325.28 (down)
  • 1{-7} Minuscule, 8/16/2022, 4325.28 (down)
  • 5{-8} Subminuscule, 9/13/2022, 4175 (down)

Learning and other resources. Elliott wave analysis provides context, not prophecy. As the 20th century semanticist Alfred Korzybski put it in his book Science and Sanity (1933), “The map is not the territory … The only usefulness of a map depends on similarity of structure between the empirical world and the map.” And I would add, in the ever-changing markets, we can judge that similarity of structure only after the fact.

See the menu page Analytical Methods for a rundown on where to go for information on Elliott wave analysis.

By Tim Bovee, Portland, Oregon, September 29, 2022

Disclaimer

Tim Bovee, Private Trader tracks the analysis and trades of a private trader for his own accounts. Nothing in this blog constitutes a recommendation to buy or sell stocks, options or any other financial instrument. The only purpose of this blog is to provide education and entertainment.

No trader is ever 100 percent successful in his or her trades. Trading in the stock and option markets is risky and uncertain. Each trader must make trading decisions for his or her own account, and take responsibility for the consequences.

License
Creative Commons License

All content on Tim Bovee, Private Trader by Timothy K. Bovee is licensed under a Creative Commons Attribution-ShareAlike 4.0 International License.

Based on a work at www.timbovee.com.
Trader’s Notebook

3:30 p.m. New York time

Half an hour before the closing bell. The S&P 500 has continued to rise during the session, reaching into the 3730s on the futures. The rising wave 2{-15} has moved above the start of the preceding wave 1{-15}, from 3733, and so the structure of the parent, wave 5{-14} can’t be a Triangle, according to the rules of Elliott wave analysis. Something else is going on.

As the human foundling Valentine Michael Smith, raised by Martians in Robert Heinlein’s sci-fi classic Stranger in a Strange Land, was wont to say, “Waiting is”.

I’ve updated the chart.

9:35 a.m. New York time

What’s happening now? The S&P 500 E-mini futures declined to 3613 in overnight trading and then rose back into the 3680s.

What does it mean? The final segment of a downtrend that began on September 22 is underway and is still in its early stages. When complete, it will also end a series of larger downtrends and will be followed by an upward correction of the downtrend that began on September 13.

What is the alternative? It’s possible that the overnight low marks the end of an extremely short final segment in the downtrend that began on September 22. If that scenario plays out, then the upward correction has already begun.

[S&P 500 E-mini futures at 3:30 p.m., 45-minute bars, with volume]

What does Elliott wave theory say? Under the principal analysis, wave 5{-13} is underway. It is the final subwave within wave wave 5{-12}, which in turn is the final subwave within wave 5{-11}, and that in turn is the final subwave within wave 3{-10}, which began on September 13. When wave 3{-10} is complete, it will be followed by an upward correction, wave 4{-10}, which will retrace a portion of the decline from 4051.25.

Under the alternative analysis, wave 5{-10} ended at the overnight low, 3613, and wave A{-11} within wave 4{-10} has begun.

There are ambiguities impacting both analyses. Wave 5{-14}’s first internal wave, wave 1{-15}, has three subwaves. That’s the form of either a downward correction, which doesn’t match the context on the chart, or of a Triangle form of some type, which does match the context. There is a blip of a wave which can bring internal count to five subwaves, but then wave 3{-15} is overly short — a 3rd wave can’t be shorter than both the 1st and 5th waves that surround it.

For the moment my best choice is to leave the internal structure of wave 5{-14} unresolved, in the certain expectation that the market will resolve all ambiguities as it progresses.

When wave 4{-10} is complete, it will be followed by downtrending wave 5{-10}, which will be the end of wave 1{-9}, which began on September 13 from 4175. All of this is occurring within a series waves within waves of increasing size, up to wave 4{-1}, which began on January 4 from 4818.62 on the index.

We Are Here.

These are the waves currently in progress under my principal analysis. Each line on the list shows the wave number, with the subscript in curly brackets, the traditional degree name, the starting date, the starting price of the S&P 500 E-mini futures, and the direction of the wave.

  • S&P 500 Index:
  • 5{+3} Supercycle, 7/8/1932, 4.40 (up)
  • 5{+2} Cycle, 12/9/1974, 60.96 (up)
  • 5{+1} Primary, 3/6/2009, 666.79 (up)
  • 5{0} Intermediate, 12/26/2018, 2346.58 (up)
  • 4{-1} Minor, 1/4/2022 4818.62 (down)
  • 1{-2} Minute, 1/4/2022 4818.62 (down)
  • S&P 500 Futures and index:
  • 1{-3} Minuette, 1/4/2022, 4808.25 (down) (futures), 4818.62 (down) (index)
  • S&P 500 Futures:
  • 1{-4} Subminuette, 1/4/2022, 4808.25 (down)
  • 1{-5} Micro, 1/4/2022, 4808.25 (down)
  • 3{-6} Submicro, 8/16/2022, 4325.28 (down)
  • 1{-7} Minuscule, 8/16/2022, 4325.28 (down)
  • 5{-8} Subminuscule, 9/13/2022, 4175 (down)
  • 1{-9} (no name), 9/13/2022, 4175 (down)
  • 3{-10} (no name), 9/13/2022, 4051.25 (down)
  • 5{-11} (no name), 9/15/2022, 3977.50 (down)

Learning and other resources. Elliott wave analysis provides context, not prophecy. As the 20th century semanticist Alfred Korzybski put it in his book Science and Sanity (1933), “The map is not the territory … The only usefulness of a map depends on similarity of structure between the empirical world and the map.” And I would add, in the ever-changing markets, we can judge that similarity of structure only after the fact.

See the menu page Analytical Methods for a rundown on where to go for information on Elliott wave analysis.

By Tim Bovee, Portland, Oregon, September 28, 2022

Disclaimer

Tim Bovee, Private Trader tracks the analysis and trades of a private trader for his own accounts. Nothing in this blog constitutes a recommendation to buy or sell stocks, options or any other financial instrument. The only purpose of this blog is to provide education and entertainment.

No trader is ever 100 percent successful in his or her trades. Trading in the stock and option markets is risky and uncertain. Each trader must make trading decisions for his or her own account, and take responsibility for the consequences.

License
Creative Commons License

All content on Tim Bovee, Private Trader by Timothy K. Bovee is licensed under a Creative Commons Attribution-ShareAlike 4.0 International License.

Based on a work at www.timbovee.com.

Trader’s Notebook

3:30 p.m. New York time

Half an hour before the closing bell. The S&P 500 peaked during the session and then declined to below the starting point of the upward correction that began on September 23. The correction, wave 4{-14}, began from 3660.25 on the futures and peaked today at 3733.

Under the principal analysis, that peak completed wave C{-15} and its parent, wave 4{-14}. The correction having ended, wave 5{-14} is underway.

Under the alternative analysis, the peak completed wave C{-15} and the first corrective pattern within wave 4{-14}, and the subsequent decline is a connector, wave X{-15}, that will be followed by a second corrective pattern as wave 4{-14} continues. The rules governing Elliott wave analysis allow a 4th wave to fall below the wave’s starting point (in contrast to 2nd waves, where such a break below is disallowed).

The more the price drops, the greater the likelihood of the principal analysis. The more the price rises from this point, the greater the likelihood of the alternative analysis.

I’ve updated the chart.

9:35 a.m. New York time

What’s happening now? The S&P 500 E-mini futures continued to trade sideways overnight, staying within a narrow range centered on the 3700 price level.

What does it mean? The relatively small upward correction that began on September 23 continues and is in its third and possibly final leg. When the correction is complete, the downtrend that began on September 22 will resume.

What is the alternative? If the correction forms a compound structure, then the third leg of the corrective pattern will be followed by a connector wave to the downside, and then by a second corrective pattern.

[S&P 500 E-mini futures at 3:30 p.m., 40-minute bars, with volume]

What does Elliott wave theory say? Rising wave C{-15} within the upward correction, wave 4{-14} is underway.

Under the principal analysis, wave C{-15} will be followed by downtrending wave 5{-14}, the final wave within wave 5{-13}, which began on September 22.

Under the alternative analysis, wave C{-15} will be followed by downward wave X{-15} and then a second corrective pattern and afterward perhaps by a third. When the compound correction, wave 4{-14}, is complete, then wave 5{-14} will begin its decline,

All of this is happening within downtrending wave 5{-12}, which began on September 20, the final wave within wave 5{-11}, which began on September 15. See the “We Are Here” section, below, for a list of current waves larger than the {-11} degree.

We Are Here.

These are the waves currently in progress under my principal analysis. Each line on the list shows the wave number, with the subscript in curly brackets, the traditional degree name, the starting date, the starting price of the S&P 500 E-mini futures, and the direction of the wave.

  • S&P 500 Index:
  • 5{+3} Supercycle, 7/8/1932, 4.40 (up)
  • 5{+2} Cycle, 12/9/1974, 60.96 (up)
  • 5{+1} Primary, 3/6/2009, 666.79 (up)
  • 5{0} Intermediate, 12/26/2018, 2346.58 (up)
  • 4{-1} Minor, 1/4/2022 4818.62 (down)
  • 1{-2} Minute, 1/4/2022 4818.62 (down)
  • S&P 500 Futures and index:
  • 1{-3} Minuette, 1/4/2022, 4808.25 (down) (futures), 4818.62 (down) (index)
  • S&P 500 Futures:
  • 1{-4} Subminuette, 1/4/2022, 4808.25 (down)
  • 1{-5} Micro, 1/4/2022, 4808.25 (down)
  • 3{-6} Submicro, 8/16/2022, 4325.28 (down)
  • 1{-7} Minuscule, 8/16/2022, 4325.28 (down)
  • 5{-8} Subminuscule, 9/13/2022, 4175 (down)
  • 1{-9} (no name), 9/13/2022, 4175 (down)
  • 3{-10} (no name), 9/13/2022, 4051.25 (down)
  • 5{-11} (no name), 9/15/2022, 3977.50 (down)

Learning and other resources. Elliott wave analysis provides context, not prophecy. As the 20th century semanticist Alfred Korzybski put it in his book Science and Sanity (1933), “The map is not the territory … The only usefulness of a map depends on similarity of structure between the empirical world and the map.” And I would add, in the ever-changing markets, we can judge that similarity of structure only after the fact.

See the menu page Analytical Methods for a rundown on where to go for information on Elliott wave analysis.

By Tim Bovee, Portland, Oregon, September 27, 2022

Disclaimer

Tim Bovee, Private Trader tracks the analysis and trades of a private trader for his own accounts. Nothing in this blog constitutes a recommendation to buy or sell stocks, options or any other financial instrument. The only purpose of this blog is to provide education and entertainment.

No trader is ever 100 percent successful in his or her trades. Trading in the stock and option markets is risky and uncertain. Each trader must make trading decisions for his or her own account, and take responsibility for the consequences.

License
Creative Commons License

All content on Tim Bovee, Private Trader by Timothy K. Bovee is licensed under a Creative Commons Attribution-ShareAlike 4.0 International License.

Based on a work at www.timbovee.com.

Trader’s Notebook

3:30 p.m. New York time

Half an hour before the closing bell. The S&P 500 continued trading in a narrow range. The pattern fits that described in this morning’s principal analysis: The first wave of an upward correction that began on September 23 is underway and has completed its rising first leg and perhaps its declining second leg, all part of a correction with three segments.

In Elliott wave terminology, from small to larger, wave A{-15} within the upward correction, wave 4{-14}, ended at the overnight high with five waves internally. That suggests that the correction is taking the form of a Zigzag. Wave B{-15} will have three internal waves, and the final segment, wave C{-15}, will have five internal waves and will likely end the correction, unless it forms a compound structure. The correction is part of downtrending wave 3{-13}, which began on September 21, the middle wave with downtrending wave 5{-12}, which began on September 20.

No change in the analysis. I’ve updated the chart.

9:35 a.m. New York time

What’s happening now? The S&P 500 E-mini futures remained within a narrow range after trading resumed Sunday evening, between a high of 3718.25 and a low of 3671.50.

What does it mean? A smaller upward correction within a downtrend that began on September 22 is underway, and the decline will resume shortly, one the correction is complete.

What is the alternative? The overnight peak might well have ended the correction’s third and final wave, and if that’s how the chart plays out, then the downtrend has resumed and is in its 5th and final wave.

[S&P 500 E-mini futures at 3:30 p.m., 40-minute bars, with volume]

What does Elliott wave theory say? The downtrend is wave 5{-13}, which began on September 22 from 3833. The internal correction, now underway according to the principal analysis, is wave 4{-14}. According to the alternative analysis, upward wave 4{-14} is complete and downtrending wave 5{-14} within its parent, downtrending wave 5{-13}, has begun.

The correction has clearly completed three waves internally, and the difference between the principal analysis and the alternative is where we place those three waves in the fractal hierarchy of the chart. The principal analysis treats those three waves as waves A{-16}, B{-16} and C{-16} — subwaves of wave A{-15}, the first wave within wave 4{-14}. The alternative analysis treats those three waves as being one degree higher, at degree {-15}. So in the principal analysis, the three waves completed the first wave of the correction. In the alternative, they completed the whole correction.

If the price falls below 3660.25 and continues to fall, it strengthens the case for the alternative analysis. If the price reverses and rises toward 3766.75, it strengthens the case for the principal analysis.

And, in fact, the price has risen from the low, into the 3700 region, buttressing the principal analysis.

This is all happening within a nested series of downtrending waves, ranging from wave 5{-12}, which began on September 20, up to wave 4{-1}, which began on January 4 and is the next-to-the-last wave within wave 5{0}, a Diagonal Triangle that began on December 26, 2018.

The end of wave 5{-13} will also be the end of waves 5{-12} and 5{-11}, and of the parent wave, 3{-10}, which began on September 13. Wave 3{-10} will be followed by an upward correction that is larger than the one presently underway.

Big picture: Wave 4{-1} is still in its early stage, in wave 1{-2} one degree lower. When wave 4{-1} is complete, wave 5{-1} will carry the price to the upper boundary of the expanding Diagonal Triangle, which is now in the upper 5000s and will soon enter the 6000s. When wave 5{-1} is complete, it will trigger completion of wave 5{0} and also of a nested series of waves of increasing size, up to uptrending wave 5{+3}, which began on July 8, 1932. A downward correction of astounding size will follow, correcting nearly a century’s worth of market gains. But that’s year’s in the future and not of immediate concern.

We Are Here.

These are the waves currently in progress under my principal analysis. Each line on the list shows the wave number, with the subscript in curly brackets, the traditional degree name, the starting date, the starting price of the S&P 500 E-mini futures, and the direction of the wave.

  • S&P 500 Index:
  • 5{+3} Supercycle, 7/8/1932, 4.40 (up)
  • 5{+2} Cycle, 12/9/1974, 60.96 (up)
  • 5{+1} Primary, 3/6/2009, 666.79 (up)
  • 5{0} Intermediate, 12/26/2018, 2346.58 (up)
  • 4{-1} Minor, 1/4/2022 4818.62 (down)
  • 1{-2} Minute, 1/4/2022 4818.62 (down)
  • S&P 500 Futures and index:
  • 1{-3} Minuette, 1/4/2022, 4808.25 (down) (futures), 4818.62 (down) (index)
  • S&P 500 Futures:
  • 1{-4} Subminuette, 1/4/2022, 4808.25 (down)
  • 1{-5} Micro, 1/4/2022, 4808.25 (down)
  • 3{-6} Submicro, 8/16/2022, 4325.28 (down)
  • 1{-7} Minuscule, 8/16/2022, 4325.28 (down)
  • 5{-8} Subminuscule, 9/13/2022, 4175 (down)
  • 1{-9} (no name), 9/13/2022, 4175 (down)
  • 3{-10} (no name), 9/13/2022, 4051.25 (down)
  • 5{-11} (no name), 9/15/2022, 3977.50 (down)

Learning and other resources. Elliott wave analysis provides context, not prophecy. As the 20th century semanticist Alfred Korzybski put it in his book Science and Sanity (1933), “The map is not the territory … The only usefulness of a map depends on similarity of structure between the empirical world and the map.” And I would add, in the ever-changing markets, we can judge that similarity of structure only after the fact.

See the menu page Analytical Methods for a rundown on where to go for information on Elliott wave analysis.

By Tim Bovee, Portland, Oregon, September 26, 2022

Disclaimer

Tim Bovee, Private Trader tracks the analysis and trades of a private trader for his own accounts. Nothing in this blog constitutes a recommendation to buy or sell stocks, options or any other financial instrument. The only purpose of this blog is to provide education and entertainment.

No trader is ever 100 percent successful in his or her trades. Trading in the stock and option markets is risky and uncertain. Each trader must make trading decisions for his or her own account, and take responsibility for the consequences.

License
Creative Commons License

All content on Tim Bovee, Private Trader by Timothy K. Bovee is licensed under a Creative Commons Attribution-ShareAlike 4.0 International License.

Based on a work at www.timbovee.com.

LVS Trade

Las Vegas Sands Corp. (LVS)

Lot 2022-2

Update 10/11/2022: I exited my short bear call vertical spread on LVS, 10 days before expiration, for a $1.98 debit per contract/share, a loss before fees of $78 per contract. Shares were trading at $37.65, up $2.91 from the entry level.

The Implied Volatility Rank at exit was 81.6%, up 28 points from the entry level.

I exited because the position was showing a loss and expiration was approaching. The options spread produced the maximum possible loss. Shortly after I entered the bear put spread, Chinese authorities reopened the gambling center Macau to tourists, enhancing the profit potential of Las Vegas Sands’ casino operations there. The share price rose dramatically, and for most of my holding period remained at levels that, if I had exited, would have produced a greater loss than I would have incurred by letting the options expire or be exercised.

Shares rose by 8.4% over 18 days for a +170% annual rate. The options position produced a 41.3% loss for a -837% annual rate.


I have entered a short bull put vertical spread on LVS, using options that trade for the last time 28 days hence, on September 21. The premium is a $1.11 credit per contract share and the stock at the time of entry was priced at $34.74.

The Implied Volatility Ratio stood at 53.6%.

Premium:$1.11Expire OTM
LVS-bear call spreadStrikeOddsDelta
Calls
Long38.0075.0%30
Break-even36.1165.0%40.5
Short35.0055.0%51

The premium is 74% of the width of the position’s short/long spread. The profit zone covers a 3% move to the upside and an unlimited move to the downside.

The risk/reward ratio is 1.7:1, with maximum risk of $189 and maximum reward of $111 per contract.

How I chose the trade. The trade was placed after the Parabolic SARS indicator gave a bear signal for a third day running. The bear signal was confirmed by a negative reading on the Fisher Transform indicator. The Zacks Investment Research ranking was 4, which is also bearish. The short strike was set to coincide with the expected move in the share price of $0.60 either way, based on options pricing, which gives an upper price expectation of $35.34.

By Tim Bovee, Portland, Oregon, September 23, 2022

Disclaimer

Tim Bovee, Private Trader tracks the analysis and trades of a private trader for his own accounts. Nothing in this blog constitutes a recommendation to buy or sell stocks, options or any other financial instrument. The only purpose of this blog is to provide education and entertainment.

No trader is ever 100 percent successful in his or her trades. Trading in the stock and option markets is risky and uncertain. Each trader must make trading decisions for his or her own account, and take responsibility for the consequences.

License
Creative Commons License

All content on Tim Bovee, Private Trader by Timothy K. Bovee is licensed under a Creative Commons Attribution-ShareAlike 4.0 International License.

Based on a work at www.timbovee.com.
Trader’s Notebook

3:30 p.m. New York time

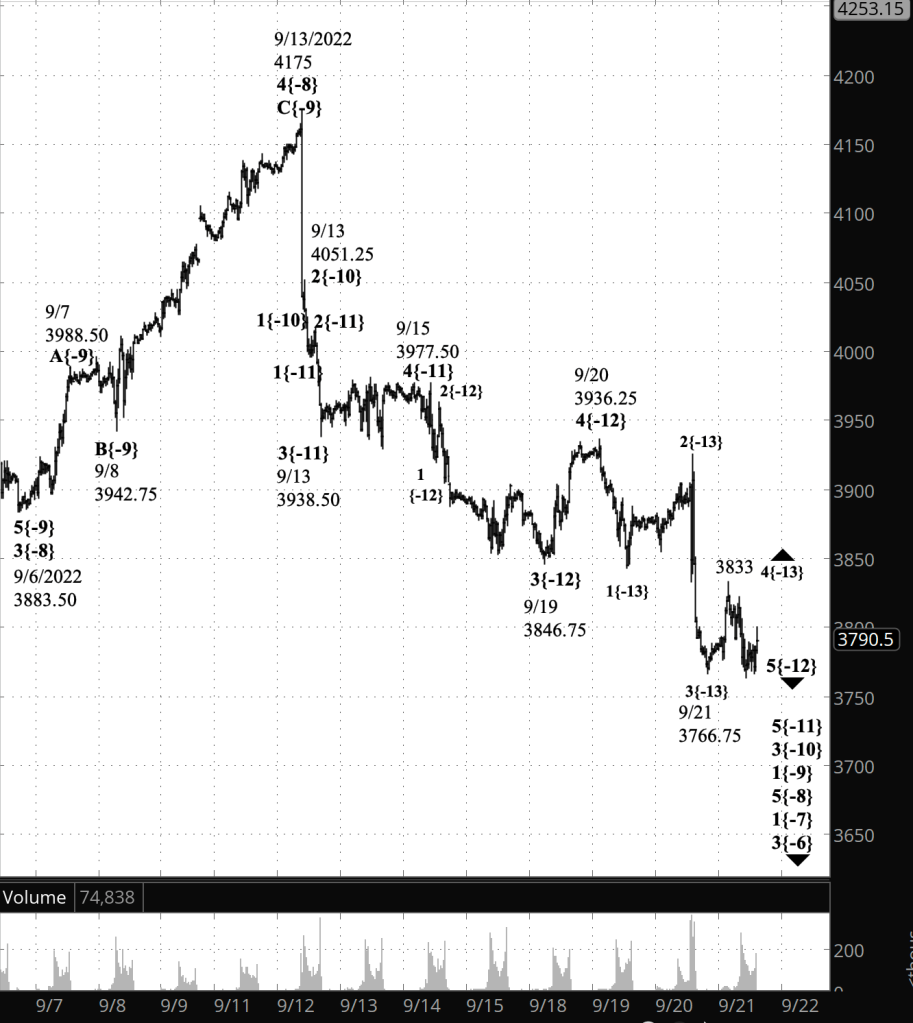
Half an hour before the closing bell. The downtrend that began yesterday from 3833 continued to fall during the session, reaching 3660.25 as the closing bell approached. The downtrend its middle segment, the 3rd wave, which is generally the most powerful of a five-wave trend. In Elliott wave terms, smaller to larger, wave 3{-14} within wave 5{-13} within wave 5{-12} is underway,

No change in the analysis. I’ve updated the chart.

1:05 p.m. New York time

Bearish entry on LVS. I’ve entered a bear call vertical spread on LVS, using options that trade for the last time on October 21 and have posted an analysis of the trade.

9:35 a.m. New York time

What’s happening now? The S&P 500 E-mini futures fell in overnight trading, reaching the mid-3710s.

What does it mean? The decline is a resumption of the downtrend that began on September 20. The downtrend is presently in its fifth and final segment.

What are the alternatives? None at present. Ambiguities will develop, I’m sure.

[S&P 500 E-mini futures at 3:30 p.m., 35-minute bars, with volume]

What does Elliott wave theory say? Downtrending wave 5{-13}, which began from yesterday’s peak, 3833, is underway. It is a subwave of wave 5{-12}, which began on September 20 from 3936.25. The starting point of wave 5{-13} was also the end point of an upward correction, wave 4{-13}.

When wave 5{-13} is complete, it will also mark the end of wave 5{-12}, its wave 5{-11} parent and above that, its wave 3{-10} grandparent, which began on September 13 from 4051.25. Wave 3{-10} will be followed by an upward correction, wave 4{-10}.

Fourth waves typically end in the 4th subwave of the preceding 3rd wave of the same degree. Wave 4{-11} within wave 3{-10} began on September 13 from 3938.30 and ended on September 15 at 3977.50. The correction hit a lower of 3929, giving a target range for the futures wave 4{-10} of 3929 to 3977.50. Fourth waves don’t always turn out that way, but they do often enough to take that tendency seriously.

If wave 4{-10} were to begin right now (it won’t), the minimum rise would be 5%.

Above the present wave 3{-10} are a series of nested downtrending waves, each of increasing size, from waves 1{-9} up to wave 4{-1}, which began on January 4 from 4818.62. Enclosing them all is wave 5{0}, an expanding Diagonal Triangle that began on December 26, 2018, from 2346.58. In this case, the Triangle constitutes the form of an uptrending wave, and when it is complete, it will be followed by a much larger downtrend than anything we’ve seen since for a long while.

We Are Here.

These are the waves currently in progress under my principal analysis. Each line on the list shows the wave number, with the subscript in curly brackets, the traditional degree name, the starting date, the starting price of the S&P 500 E-mini futures, and the direction of the wave.

  • S&P 500 Index:
  • 5{+3} Supercycle, 7/8/1932, 4.40 (up)
  • 5{+2} Cycle, 12/9/1974, 60.96 (up)
  • 5{+1} Primary, 3/6/2009, 666.79 (up)
  • 5{0} Intermediate, 12/26/2018, 2346.58 (up)
  • 4{-1} Minor, 1/4/2022 4818.62 (down)
  • 1{-2} Minute, 1/4/2022 4818.62 (down)
  • S&P 500 Futures and index:
  • 1{-3} Minuette, 1/4/2022, 4808.25 (down) (futures), 4818.62 (down) (index)
  • S&P 500 Futures:
  • 1{-4} Subminuette, 1/4/2022, 4808.25 (down)
  • 1{-5} Micro, 1/4/2022, 4808.25 (down)
  • 3{-6} Submicro, 8/16/2022, 4325.28 (down)
  • 1{-7} Minuscule, 8/16/2022, 4325.28 (down)
  • 5{-8} Subminuscule, 9/13/2022, 4175 (down)
  • 1{-9} (no name), 9/13/2022, 4175 (down)
  • 3{-10} (no name), 9/13/2022, 4051.25 (down)
  • 5{-11} (no name), 9/15/2022, 3977.50 (down)

Learning and other resources. Elliott wave analysis provides context, not prophecy. As the 20th century semanticist Alfred Korzybski put it in his book Science and Sanity (1933), “The map is not the territory … The only usefulness of a map depends on similarity of structure between the empirical world and the map.” And I would add, in the ever-changing markets, we can judge that similarity of structure only after the fact.

See the menu page Analytical Methods for a rundown on where to go for information on Elliott wave analysis.

By Tim Bovee, Portland, Oregon, September 23, 2022

Disclaimer

Tim Bovee, Private Trader tracks the analysis and trades of a private trader for his own accounts. Nothing in this blog constitutes a recommendation to buy or sell stocks, options or any other financial instrument. The only purpose of this blog is to provide education and entertainment.

No trader is ever 100 percent successful in his or her trades. Trading in the stock and option markets is risky and uncertain. Each trader must make trading decisions for his or her own account, and take responsibility for the consequences.

License
Creative Commons License

All content on Tim Bovee, Private Trader by Timothy K. Bovee is licensed under a Creative Commons Attribution-ShareAlike 4.0 International License.

Based on a work at www.timbovee.com.

Trader’s Notebook

3:30 p.m. New York time

Half an hour before the closing bell. The S&P 500 has traced out two segments of the small upward correction that began yesterday. The end of the ascending third and likely final segment of the correction will be followed by a resumption of the downtrend that began on September 20.

Switching to the terminology of Elliott wave analysis: Wave 4{-13}, the upward correction, is in its third and likely final internal wave, C{-14}. When that wave is complete, wave 5{-13} will begin its downward course within the parent wave 5{-12}, which began on September 20, and which in turn is a subwave of wave 5{-11}, which began on September 15. There is no change in the principal analysis. I’ve updated the chart.

2:30 p.m. New York time

DRI earnings play exit. I’ve exited my short bull put options spread on DRI for 81.8% of maximum potential loss and have updated the trade analysis with details.

9:35 a.m. New York time

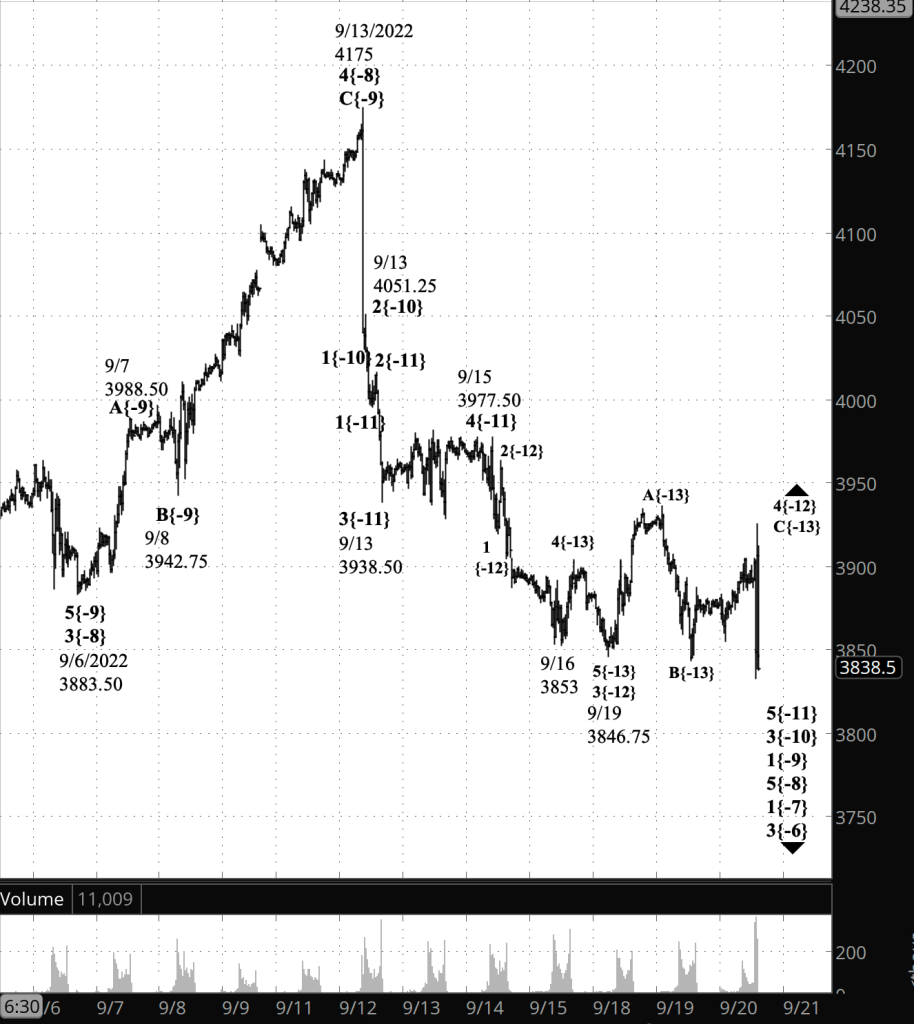
What’s happening now? The S&P 500 E-mini futures reached a low of 3766.75 after the closing bell, and then reversed, rising to 3833 overnight.

What does it mean? As the chart has played out in the past few days, it has become clear that the low level upward correction that began on September 19 ended on September 20, and that the downtrend that began on September 15 has resumed. The upward reversal overnight is the start of an upward correction within that downtrend.

What are the alternatives? The main ambiguity on the chart is one I referred to after the mid-August downtrend resumed: How large is each movement in connection with the fractal structure of movements ranging from big to small? Subsequent events could require a change in my present labeling of the degrees, using subscripts in curly brackets. For example, the decline from August 16 is wave 3{-6}, but it could just as easily be larger, wave 3{-5}, or even larger still, wave 3{-4}.

[S&P 500 E-mini futures at 3:30 p.m., 30-minute bars, with volume]

What does Elliott wave theory say? I revised my analysis after the close to align with the S&P 500’s path on the chart: Wave 5{-12} is underway and internally is in an upward correction, wave 4{-13}. I also moved the end of a prior upward correction, wave 4{-12}, to a point a few days earlier, September 20. And that peak is the starting point of wave 5{-12}.

Under the principal analysis, wave 4{-13} will be followed by downtrending wave 5{-13}, the final wave within the parent wave 5{-12}. The end of wave 5{-13} will also be the end of wave 5{-12}, and will cascade up two nested waves of increasing size, wave 5{-11}, which began on September 15, and wave 3{-10}, which began on September 13 from 4051.25. An upward correction, wave 4{-10}, will ensue, likely carrying the price back up into the mid- and high-3900s.

All of this is happening within a nested series of increasingly larger waves, all declining, ranging from wave 1{-9}, which began on September 13 from 4175, up to wave 4{-1}, which began on January 4 from 4818.62.

We Are Here.

These are the waves currently in progress under my principal analysis. Each line on the list shows the wave number, with the subscript in curly brackets, the traditional degree name, the starting date, the starting price of the S&P 500 E-mini futures, and the direction of the wave.

  • S&P 500 Index:
  • 5{+3} Supercycle, 7/8/1932, 4.40 (up)
  • 5{+2} Cycle, 12/9/1974, 60.96 (up)
  • 5{+1} Primary, 3/6/2009, 666.79 (up)
  • 5{0} Intermediate, 12/26/2018, 2346.58 (up)
  • 4{-1} Minor, 1/4/2022 4818.62 (down)
  • 1{-2} Minute, 1/4/2022 4818.62 (down)
  • S&P 500 Futures and index:
  • 1{-3} Minuette, 1/4/2022, 4808.25 (down) (futures), 4818.62 (down) (index)
  • S&P 500 Futures:
  • 1{-4} Subminuette, 1/4/2022, 4808.25 (down)
  • 1{-5} Micro, 1/4/2022, 4808.25 (down)
  • 3{-6} Submicro, 8/16/2022, 4325.28 (down)
  • 1{-7} Minuscule, 8/16/2022, 4325.28 (down)
  • 5{-8} Subminuscule, 9/13/2022, 4175 (down)
  • 1{-9} (no name), 9/13/2022, 4175 (down)
  • 3{-10} (no name), 9/13/2022, 4051.25 (down)
  • 5{-11} (no name), 9/15/2022, 3977.50 (down)

Learning and other resources. Elliott wave analysis provides context, not prophecy. As the 20th century semanticist Alfred Korzybski put it in his book Science and Sanity (1933), “The map is not the territory … The only usefulness of a map depends on similarity of structure between the empirical world and the map.” And I would add, in the ever-changing markets, we can judge that similarity of structure only after the fact.

See the menu page Analytical Methods for a rundown on where to go for information on Elliott wave analysis.

By Tim Bovee, Portland, Oregon, September 22, 2022

Disclaimer

Tim Bovee, Private Trader tracks the analysis and trades of a private trader for his own accounts. Nothing in this blog constitutes a recommendation to buy or sell stocks, options or any other financial instrument. The only purpose of this blog is to provide education and entertainment.

No trader is ever 100 percent successful in his or her trades. Trading in the stock and option markets is risky and uncertain. Each trader must make trading decisions for his or her own account, and take responsibility for the consequences.

License
Creative Commons License

All content on Tim Bovee, Private Trader by Timothy K. Bovee is licensed under a Creative Commons Attribution-ShareAlike 4.0 International License.

Based on a work at www.timbovee.com.
DRI Trade

Darden Restaurants Inc. (DRI)

Lot 2022-2

Update 9/22/2022: I exited my short bull put vertical spread on DRI, 29 days before expiration, for a $2.92 debit per contract/share, a loss before fees of $102 per contract. Shares were trading at $125.38, down $6.68 from the entry level.

The Implied Volatility Rank at exit was 32.8%, down 12.1 points from the entry level.

DRI’s earnings came in as expected, at $1.56 per share, but some same-store sales fell short and the share price fell, turning my bear position unprofitable. I exited on the day after entry for 81.8% of maximum potential loss.

Shares fell by 5.1% over one day for a -1,846% annual rate. The options position produced a 34.9% loss for a -12,750% annual rate.


I have entered a short bull put vertical spread on DRI, using options that trade for the last time 30 days hence, on October 21. The premium is a $1.90 credit per contract share and the stock at the time of entry was priced at $132.06.

The Implied Volatility Ratio stood at 44.9%.

Premium:$1.90Expire OTM
DRI-bull put spreadStrikeOddsDelta
Puts
Long125.0064.0%31
Break-even131.9058.0%36.5
Short130.0052.0%42

The premium is 76% of the width of the position’s short/long spread. The profit zone covers a 5% move to the downside and an unlimited move to the upside.

The risk/reward ratio is 1.6:1, with maximum risk of $190 and maximum reward of $360 per contract.

How I chose the trade. The trade was placed to coincide with DRI’s earnings announcement, before the opening bell on the day after entry. The Zacks Investment Research earnings surprise predictor gave DRI a score of 0.21%, with a rank of 3. The analysts’ consensus is that DRI will announce earnings of $1.56 per share.

By Tim Bovee, Portland, Oregon, September 21, 2022

Disclaimer

Tim Bovee, Private Trader tracks the analysis and trades of a private trader for his own accounts. Nothing in this blog constitutes a recommendation to buy or sell stocks, options or any other financial instrument. The only purpose of this blog is to provide education and entertainment.

No trader is ever 100 percent successful in his or her trades. Trading in the stock and option markets is risky and uncertain. Each trader must make trading decisions for his or her own account, and take responsibility for the consequences.

License
Creative Commons License

All content on Tim Bovee, Private Trader by Timothy K. Bovee is licensed under a Creative Commons Attribution-ShareAlike 4.0 International License.

Based on a work at www.timbovee.com.

Trader’s Notebook

3:30 p.m. New York time

Half an hour before the closing bell. The S&P 500 whipsawed over nearly 100 points as the Federal Open Market Committee announced a 75-basis-point rise in the Fed funds rate. On the futures, the price fell from 3905 to 3832.75, and then rose again to 3925.25 before slipping back sharply.

Rather than selecting a principal analysis for such a move, I shall list the possibilities. Subsequent movements will clarify which is correct.

  1. Wave C{-13}, the final wave within an upward correction, wave 4{-12}, is underway. Wave 4{-12} is taking the form of a Flat. This was the principal analysis this morning and the one that I used to label the updated chart.
  2. Wave C{-13} is taking the form of a Triangle, which implies more whipsawing rather than a directional movement.
  3. Wave 4{-12} is taking a compounds form and the rapid decline was wave X{-13}, a connector wave that is being followed by a second corrective pattern.
  4. The whipsaw high this afternoon was the end of wave 4{-12} and downtrending wave 5{-12} has begun.

Here is very close-up chart showing the whipsaw. I’ve also updated the chart posted this morning.

[S&P 500 E-mini futures at 3:30 p.m., 1-minute bars]

2:20 p.m. New York time

DRI earnings play entry. I’ve entered a short bull put vertical spread on DRI, using options that trade for the last time on October 19, and have posted an analysis of the trade.

9:35 a.m. New York time

What’s happening now? The S&P 500 E-mini futures continued tor rise overnight, coming within a quarter point of 3900.

What does it mean? The third and final leg of an upward corrective pattern that began on September 19 is underway. When the correction is complete, it will be followed by a resumption of the downtrend that began on September 15.

What are the alternatives? None as regards the context of the rise set forth in the principal analysis. The alternatives have to do with determining when the upward correction is over. Corrections generally have three segments internally, and if that’s the case with the present correction, then the end or the present rise will also be the end of the correction and the resumption of the downtrend. Sometimes corrections take a compound form, stringing two or three corrective patterns together. If that’s the case here, then the end of the present rise will be followed by a decline that will connect the present corrective pattern with another one.

[S&P 500 E-mini futures at 3:30 p.m., 30-minute bars, with volume]

What does Elliott wave theory say? The present upward correction is wave 4{-12}, and internally, it is in wave C{-13}, the third wave of a corrective pattern called a Flat.

Under the principal analysis, the end of wave C{-13} will also be the end of its parent, wave 4{-12}, and the beginning of downtrending wave 5{-12}, a resumption of the downtrend, wave 5{-11}, that began on September 15 from 3977.50.

Under the alternative analysis, wave 4{-12} will form a compound correction, a not uncommon event within 4th waves. If that occurs, then wave C{-13} will be followed by a connector wave, X{-13}, and then by a wave A{-13}, the first wave within a second corrective pattern. That second pattern may take a different form than did the first, such as a Zigzag or a triangle of some sort. A compound correction can contain up to three corrective patterns, so might end with the second pattern, or have another connector wave and be followed by a third pattern. In any case, once wave 4{-12} is complete, it will be followed by wave 5{-12}, the final wave in a downtrend, wave 5{-11}.

This is all happening within a nested series of downtrends, each larger than the one before: Waves 3{-10}, 1{-9}, 5{-8}, all the way up to wave 1{-2}, the first wave within wave 4{-1}, which began on January 4 from 4808.25. Wave 4{-1} is the next-to-the-last leg of an expanding Diagonal Triangle, wave 5{0}, that began on December 26, 2018, from 2346.58. Wave 4{-1} will be followed by wave 5{-1}, the rising final wave of the triangle that will carry the price the January 4 high, perhaps significantly higher.

We Are Here.

These are the waves currently in progress under my principal analysis. Each line on the list shows the wave number, with the subscript in curly brackets, the traditional degree name, the starting date, the starting price of the S&P 500 E-mini futures, and the direction of the wave.

  • S&P 500 Index:
  • 5{+3} Supercycle, 7/8/1932, 4.40 (up)
  • 5{+2} Cycle, 12/9/1974, 60.96 (up)
  • 5{+1} Primary, 3/6/2009, 666.79 (up)
  • 5{0} Intermediate, 12/26/2018, 2346.58 (up)
  • 4{-1} Minor, 1/4/2022 4818.62 (down)
  • 1{-2} Minute, 1/4/2022 4818.62 (down)
  • S&P 500 Futures and index:
  • 1{-3} Minuette, 1/4/2022, 4808.25 (down) (futures), 4818.62 (down) (index)
  • S&P 500 Futures:
  • 1{-4} Subminuette, 1/4/2022, 4808.25 (down)
  • 1{-5} Micro, 1/4/2022, 4808.25 (down)
  • 3{-6} Submicro, 8/16/2022, 4325.28 (down)
  • 1{-7} Minuscule, 8/16/2022, 4325.28 (down)
  • 5{-8} Subminuscule, 9/13/2022, 4175 (down)
  • 1{-9} (no name), 9/13/2022, 4175 (down)
  • 3{-10} (no name), 9/13/2022, 4051.25 (down)
  • 5{-11} (no name), 9/15/2022, 3977.50 (down)

Learning and other resources. Elliott wave analysis provides context, not prophecy. As the 20th century semanticist Alfred Korzybski put it in his book Science and Sanity (1933), “The map is not the territory … The only usefulness of a map depends on similarity of structure between the empirical world and the map.” And I would add, in the ever-changing markets, we can judge that similarity of structure only after the fact.

See the menu page Analytical Methods for a rundown on where to go for information on Elliott wave analysis.

By Tim Bovee, Portland, Oregon, September 21, 2022

Disclaimer

Tim Bovee, Private Trader tracks the analysis and trades of a private trader for his own accounts. Nothing in this blog constitutes a recommendation to buy or sell stocks, options or any other financial instrument. The only purpose of this blog is to provide education and entertainment.

No trader is ever 100 percent successful in his or her trades. Trading in the stock and option markets is risky and uncertain. Each trader must make trading decisions for his or her own account, and take responsibility for the consequences.

License
Creative Commons License

All content on Tim Bovee, Private Trader by Timothy K. Bovee is licensed under a Creative Commons Attribution-ShareAlike 4.0 International License.

Based on a work at www.timbovee.com.