Trader’s Notebook

3:30 p.m. New York time

Half an hour before the closing bell. The S&P 500 rose sharply during the session after a sharp fall before the opening bell when new inflation numbers were released. The way I count it at that low degree, the decline to 3502 was the final wave within wave 5{-9}, which also completed waves 5{-8} and 1{-7}, and the subsequent rise was the begining wave wave 2{-7}, a large upawrd correction.

I’ve added a chart of the S&P 500 futures with 45-minute bars showing the fall and rise, and I’ve updated the upper chart further down.
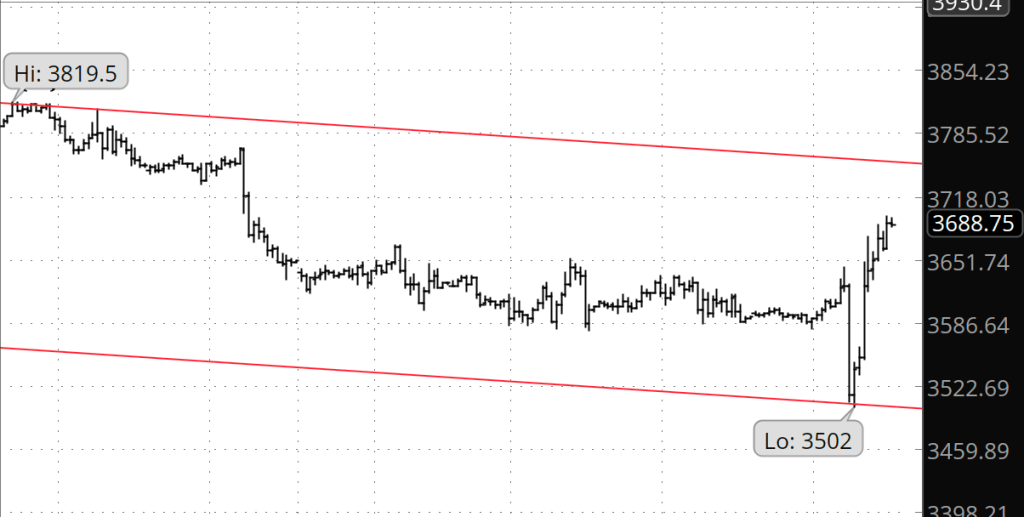
[S&P 500 E-mini futures at 3:22 p.m., 45-minute bars]

3:15 p.m. New York time

MS earnings play entry. I’ve entered a short bear call spread on MS, using options that trade for the last time on November 18, and have posted an analysis of the trade.

3:05 p.m. New York time

JPM earnings play entry. I’ve entered a short bear call spread on JPM, using options that trade for the last time on November 18, and have posted an analysis of the trade.

10:05 a.m. New York time

DAL earnings play exit. I’ve exited a short bear call options spread on DAL for a wash — neither a profit nor loss — as the stock price seesawed wildly in the minutes after the opening bell. I’ve updated the trade analysis with the outcome

9:35 a.m. New York time

What’s happening now? The S&P 500 E-mini futures traded within a narrow range overnight until the release of the latest U.S. inflation numbers an hour before the opening bell. At that point, the price dropped 116.75 points in one minute, a decline of 3.2%.

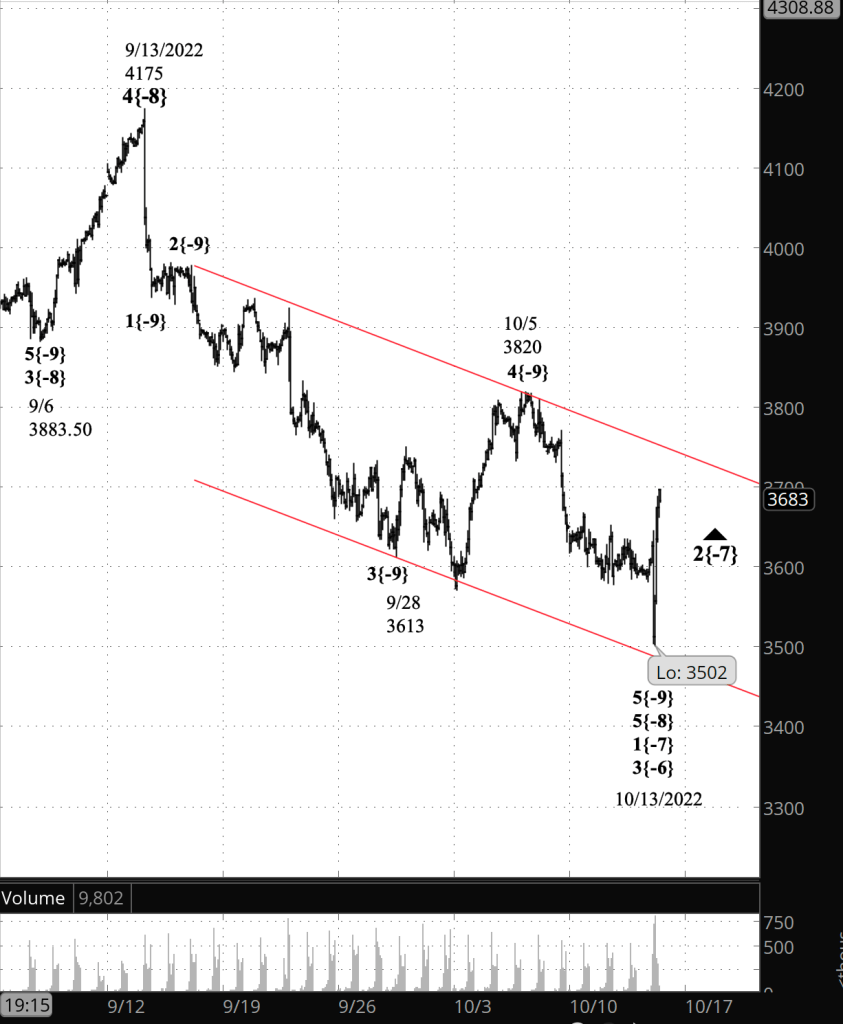
What does it mean? Markets respond to changes in the public mood, and whether the changes are rapid or slow, the prices traced on the charts match the patterns discovered by R.N. Elliott in the 1930s. In this case, the rapid decline is the final leg of a downtrend that began on October 5 from 3820, and that is itself the final leg of a larger downtrend that began on October 13 from 4175.

The sudden overnight drop brought the price to within a few points of the lower boundary of the price channel for the decline from October 5, marked in red on the upper chart.

The final leg of a trend often lacks respect for the targets implied by price channels, coming up short, moving far beyond, or hitting the target precisely. It’s like the porridge in “Goldilocks and the Three Bears” — too cold, too hot or just right.

That’s a long way of saying that while the final leg of the downtrend could be ending right where the price is, there’s no guarantee that it won’t decline further, perhaps by a significant distance.

What are the alternatives? The present ambiguities arise from the Goldilocks conundrum described above: Has the downtrended ended yet? What is the state of the porridge? And the answer at present is that the porridge seems just right — the final leg of the downtrend will end close to the price channel — but we can’t know that for sure.

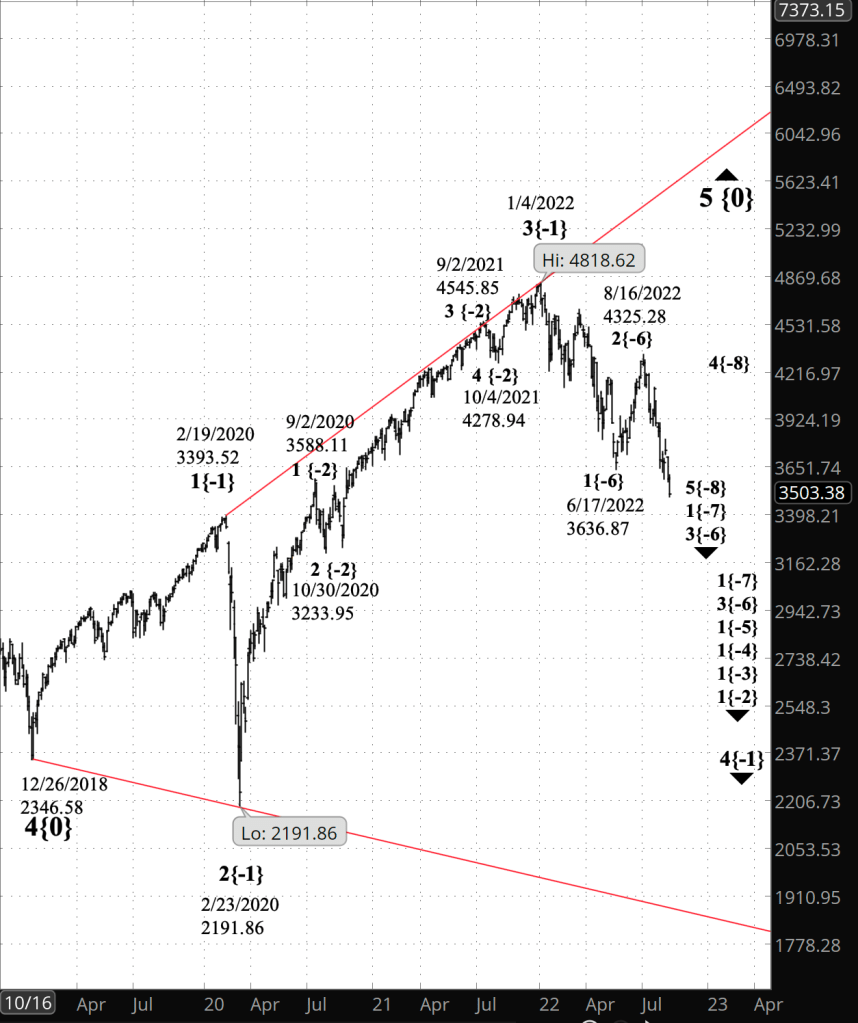
The charts. The upper chart, of the S&P 500 futures, shows the downtrend that began on September 13. The lower chart, of the S&P 500 index, shows the entirely of the expanding Diagonal Triangle that began in December 2018.
[S&P 500 E-mini futures at 3:30 p.m., 85-minute bars, with volume]
[S&P 500 index at 9:34 a.m., 3-day bars]

What does Elliott wave theory say? The overnight decline is wave 5{-10} within the larger wave 5{-9}, which began on October 5. The whole structure is contained within a series of nested waves of increasing size: Wave 5{-8}, which began on September 13, within wave 1{-7} within wave 3{-6}, both of which which began on August 16 from 4327.50 — and so forth, up to wave 4{-1}, which began on January 4 and is the next to the last component of wave 5{0}, an expanding Diagonal Triangle that began on December 26, 2018.

All of the waves in this structure, up through wave 4{-1}, are downtrending. Wave 5{0} is an uptrending wave, although the expanding Diagonal Triangle pattern means that the prices swing from highest to lowest and back to an even higher highest and then to a lower lowest. The Diagonal Triangle price channel is shown in red on the lower chart.

Given the fractal nature of price levels — “degrees” in Elliott wave parlance — the end of a smaller wave can also be the end of a larger wave. So the end of wave 5{-10} will also be the end of wave 5{-9} and also of 5{-8} and 1{-7}.

Wave 1{-7} will be followed by an upward correction larger than those we’ve seen this autumn, and then by a decline, also larger than those of recent memory.

We Are Here.

These are the waves currently in progress under my principal analysis. Each line on the list shows the wave number, with the subscript in curly brackets, the traditional degree name, the starting date, the starting price of the S&P 500 E-mini futures, and the direction of the wave.

  • S&P 500 Index:
  • 5{+3} Supercycle, 7/8/1932, 4.40 (up)
  • 5{+2} Cycle, 12/9/1974, 60.96 (up)
  • 5{+1} Primary, 3/6/2009, 666.79 (up)
  • 5{0} Intermediate, 12/26/2018, 2346.58 (up)
  • 4{-1} Minor, 1/4/2022 4818.62 (down)
  • 1{-2} Minute, 1/4/2022 4818.62 (down)
  • S&P 500 Futures and index:
  • 1{-3} Minuette, 1/4/2022, 4808.25 (down) (futures), 4818.62 (down) (index)
  • S&P 500 Futures:
  • 1{-4} Subminuette, 1/4/2022, 4808.25 (down)
  • 1{-5} Micro, 1/4/2022, 4808.25 (down)
  • 3{-6} Submicro, 8/16/2022, 4327.50 (down)
  • 1{-7} Minuscule, 8/16/2022, 4327.50 (down)
  • 5{-8} Subminuscule, 9/13/2022, 4175 (down)

Learning and other resources. Elliott wave analysis provides context, not prophecy. As the 20th century semanticist Alfred Korzybski put it in his book Science and Sanity (1933), “The map is not the territory … The only usefulness of a map depends on similarity of structure between the empirical world and the map.” And I would add, in the ever-changing markets, we can judge that similarity of structure only after the fact.

See the menu page Analytical Methods for a rundown on where to go for information on Elliott wave analysis.

By Tim Bovee, Portland, Oregon, October 13, 2022

Disclaimer

Tim Bovee, Private Trader tracks the analysis and trades of a private trader for his own accounts. Nothing in this blog constitutes a recommendation to buy or sell stocks, options or any other financial instrument. The only purpose of this blog is to provide education and entertainment.

No trader is ever 100 percent successful in his or her trades. Trading in the stock and option markets is risky and uncertain. Each trader must make trading decisions for his or her own account, and take responsibility for the consequences.

License
Creative Commons License

All content on Tim Bovee, Private Trader by Timothy K. Bovee is licensed under a Creative Commons Attribution-ShareAlike 4.0 International License.

Based on a work at www.timbovee.com.
DAL Trade

Delta Air Lines Inc. (DAL)

Lot 2022-2

Update 10/13/2022: I exited my short bear call vertical spread on October 13, 36 days before expiration, for a $1.03 debit per contract/share, for neither a profit nor a loss. Shares were trading at $29.05, down $0.10 from the entry level.

The Implied Volatility Rank at exit was 63%, down 7.5 points from the entry level.

I exited on the day after entry because the position was an earnings play, and my rules is to get out quickly, win or lose. In this case at the opening bell, the shares declined rapidly and then rose. i exited during the decline.

Shares fell by 0.3% over one day for a -125.2% annual rate. The options position produced a no return.


I have entered a short bear call vertical spread on DAL, using options that trade for the last time 37 days hence, on November 18. The premium is a $1.03 credit per contract share and the stock at the time of entry was priced at $29.15.

The Implied Volatility Ratio stood at 70.5%.

Premium:$1.03Expire OTM
DAL-bear call spreadStrikeOddsDelta
Calls
Long33.0078.0%26
Break-even31.0369.0%37
Short30.0060.0%48

The premium is 68.7% of the width of the position’s short/long spread. The profit zone covers a 6.4% move to the upside and an unlimited move to the downside.

The risk/reward ratio is 1.9:1, with maximum risk of $394 and maximum reward of $206 per contract.

How I chose the trade. The trade was placed to coincide with DAL’s earnings announcement, beofre the closing bell on the day after entry. The short strikes were set to coincide with the expected move of $1.55 either way, based on options pricing, which gives a price range of $27.61 to $30.71. The Zacks Investment Research earnings surprise predictor gave DAL a score of -2.41% — a negative surprise — with a rank of 3 — hold. The analysts’ consensus is that DAL will announce earnings of $1.56 per share.

By Tim Bovee, Portland, Oregon, October 12, 2022

Disclaimer

Tim Bovee, Private Trader tracks the analysis and trades of a private trader for his own accounts. Nothing in this blog constitutes a recommendation to buy or sell stocks, options or any other financial instrument. The only purpose of this blog is to provide education and entertainment.

No trader is ever 100 percent successful in his or her trades. Trading in the stock and option markets is risky and uncertain. Each trader must make trading decisions for his or her own account, and take responsibility for the consequences.

License
Creative Commons License

All content on Tim Bovee, Private Trader by Timothy K. Bovee is licensed under a Creative Commons Attribution-ShareAlike 4.0 International License.

Based on a work at www.timbovee.com.

Trader’s Notebook

3:30 p.m. New York time

Half an hour before the closing bell. The S&P 500 futures have continued to trade narrowly during the session, centering on 3600. No change in the analysis. I’ve updated the chart.

1:55 p.m. New York time

DAL earnings play entry. I’ve entered a bear call spread on DAL, using options that trade for the last time on November 18, and have posted an analysis of the trade.

9:35 a.m. New York time

What’s happening now? The S&P 500 E-mini futures traded sideways in a narrow range overnight.

What does it mean? A low-level upward correction within a downtrend continues.

What are the alternatives? The upward correction ended yesterday and the final decline within the downtrend has begun.

[S&P 500 E-mini futures at 3:30 p.m., 3-hour bars, with volume]

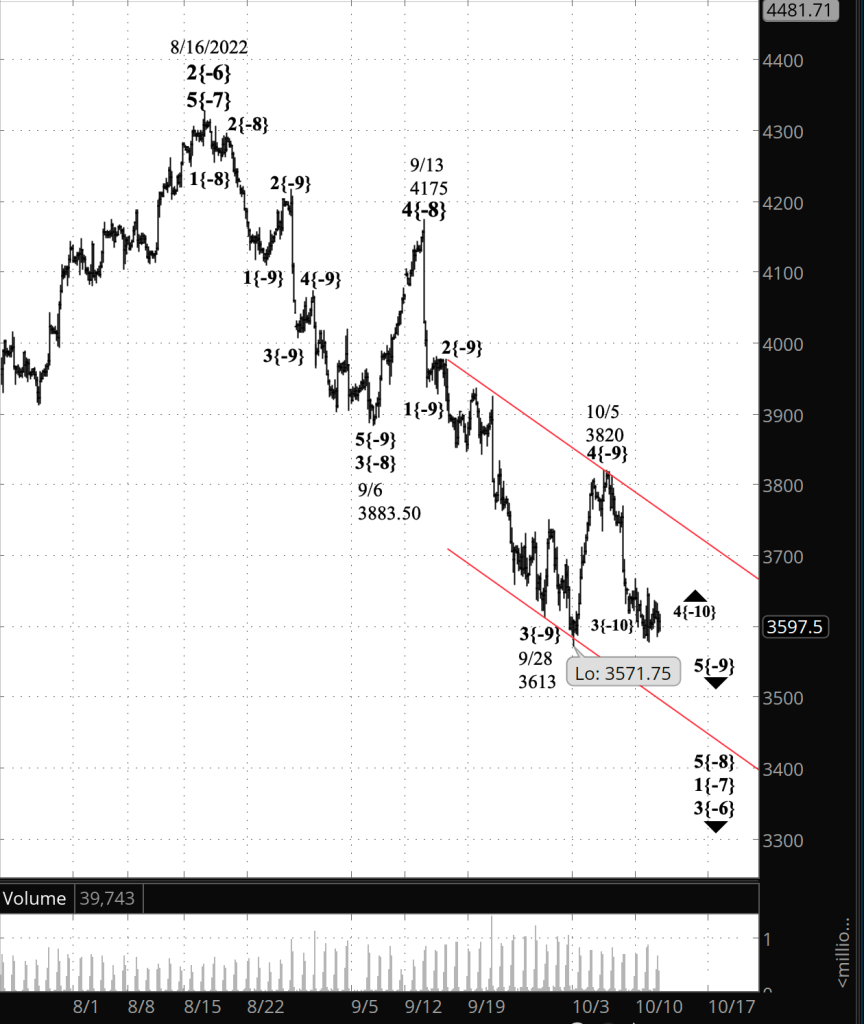
What does Elliott wave theory say? The upward correction is wave 4{-10} within wave 5{-9}, a downtrend that began on October 5 from 3820. At this point analysts are playing “Where’s Waldo” with the endpoint of wave 4{-10}. Is the correction over already or does it still underway? The difference between the principal analysis and the alternative analysis focuses on that question.

Ultimately, the question is fairly unimportant to trader’s. Wave 4{-10} is of a low degree. What we do know is that it will end soon and will be followed by a resumption of the downtrend: Wave 5{-10}, the final wave within downtrending wave 5{-9}.

When wave 5{-10} is complete, it will also be the end of its parent, wave 5{-9}, and also of two larger encompassing declines: Wave 5{-8}, which began on September 13 from 4175, and wave 1{-7}, which began on August 16 from 4327.50.

I’ve widened the view on the chart to show the entirety of the wave 1{-7} decline from August 16.

The price channel suggests that wave 5{-9} will decline to the lower boundary, a goal that is at 3500 this morning and which continually declines further. The channel is marked in red on the chart. It provides an estimate of the downside potential of wave 5{-9}, along with waves 5{-8} and 1{-7}.

Of course, 5th waves are like stubborn mules. Sometimes they come to a sudden halt before reaching the goal, and sometimes they leap forward beyond the goal.

What is certain is that waves 5{-9}, 5{-8} and 1{-7}, upon reaching their simultaneous end, will be followed by wave 2{-7}, an upward correction of far larger size than the present wave 4{-10} that, if it behaves typically in the degree of retracement, could carry the price back up to a range between 3900 and 4020, more or less. No guarantees, of course. Waves don’t always behave typically.

Wave 2{-7}, when complete, will be followed by a powerful decline, wave 3{-7}, which will carry the price well below 3500.

Wave 1{-7} began about two months ago, and wave 3{-7}, following the upward correction, may well last twice that amount of time, given the power of 3rd waves. So while the wave 2{-7} upward correction may provide some short-term bullish trading opportunities, for my own trading I plan to focus intently on the larger downtrend that will follow.

We Are Here.

These are the waves currently in progress under my principal analysis. Each line on the list shows the wave number, with the subscript in curly brackets, the traditional degree name, the starting date, the starting price of the S&P 500 E-mini futures, and the direction of the wave.

  • S&P 500 Index:
  • 5{+3} Supercycle, 7/8/1932, 4.40 (up)
  • 5{+2} Cycle, 12/9/1974, 60.96 (up)
  • 5{+1} Primary, 3/6/2009, 666.79 (up)
  • 5{0} Intermediate, 12/26/2018, 2346.58 (up)
  • 4{-1} Minor, 1/4/2022 4818.62 (down)
  • 1{-2} Minute, 1/4/2022 4818.62 (down)
  • S&P 500 Futures and index:
  • 1{-3} Minuette, 1/4/2022, 4808.25 (down) (futures), 4818.62 (down) (index)
  • S&P 500 Futures:
  • 1{-4} Subminuette, 1/4/2022, 4808.25 (down)
  • 1{-5} Micro, 1/4/2022, 4808.25 (down)
  • 3{-6} Submicro, 8/16/2022, 4327.50 (down)
  • 1{-7} Minuscule, 8/16/2022, 4327.50 (down)
  • 5{-8} Subminuscule, 9/13/2022, 4175 (down)

Learning and other resources. Elliott wave analysis provides context, not prophecy. As the 20th century semanticist Alfred Korzybski put it in his book Science and Sanity (1933), “The map is not the territory … The only usefulness of a map depends on similarity of structure between the empirical world and the map.” And I would add, in the ever-changing markets, we can judge that similarity of structure only after the fact.

See the menu page Analytical Methods for a rundown on where to go for information on Elliott wave analysis.

By Tim Bovee, Portland, Oregon, October 12, 2022

Disclaimer

Tim Bovee, Private Trader tracks the analysis and trades of a private trader for his own accounts. Nothing in this blog constitutes a recommendation to buy or sell stocks, options or any other financial instrument. The only purpose of this blog is to provide education and entertainment.

No trader is ever 100 percent successful in his or her trades. Trading in the stock and option markets is risky and uncertain. Each trader must make trading decisions for his or her own account, and take responsibility for the consequences.

License
Creative Commons License

All content on Tim Bovee, Private Trader by Timothy K. Bovee is licensed under a Creative Commons Attribution-ShareAlike 4.0 International License.

Based on a work at www.timbovee.com.
Trader’s Notebook

3:30 p.m. New York time

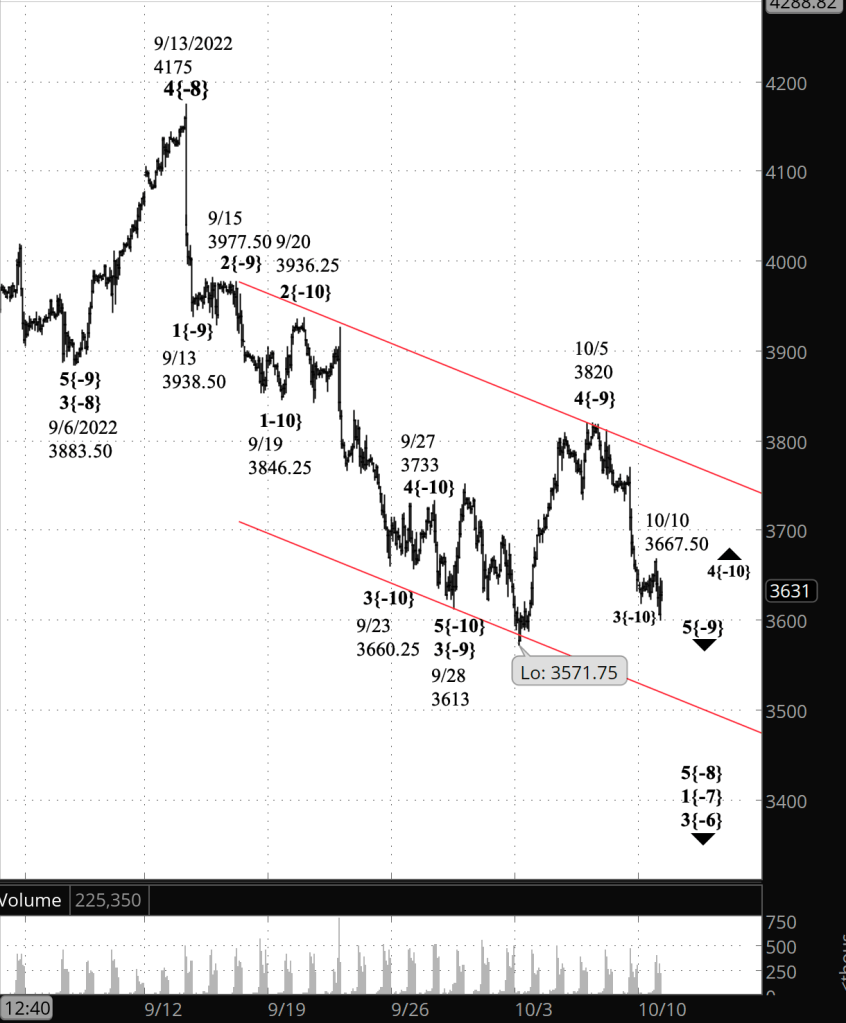
Half an hour before the closing bell. The S&P 500 fell a bit further early in the session, to 3580.25 on the futures, and then rose to 3649.50 before falling again, reaching below the morning’s low point. The rise was sufficiently high to be a final wave proportionate to the rest of the structure within the upward correction that began on October 5. There’s no certainly yet that the session marked the end of wave C{-11} within the upward correction, wave 4{-10}, nor is there certainty that the correction has not yet ended.

I’ve updated the chart, retaining the labeling from this morning’s analysis. The further the price falls, the more likely it is that wave 4{-10} ended today at 3649.50 and that wave 5{-10} has begun. If the price reverses without falling much further, then it becomes more likely that the session high was the peak of a subwave of an ongoing wave 4{-10}.

12:05 p.m. New York time

LVS options trade exit. I’ve exited my short bear call options spread on LVS for 100% of maximum potential loss and have updated the trade analysis with full results.

9:35 a.m. New York time

What’s happening now? The S&P 500 E-mini futures fell in overnight trading, reaching a low of 3584.25 before rising back into the 3620s.

What does it mean? The downtrend that began on October 5 continues and is now in the last leg of a small upward correction, which when complete will be followed by the final leg of the downtrend. A far larger upward correction will ensue.

What are the alternatives? The small upward correction ended on October 10 at 3667.50, and the final leg of the downtrend is now in its early stages.

[S&P 500 E-mini futures at 9:35 a.m., 80-minute bars, with volume]

What does Elliott wave theory say? Under the principal analysis, a small upward correction, wave 4{-10} is under way and internally is in wave C{-11}, its final wave unless the correction forms a compound structure composed of two or three corrective patterns.

Under the alternative analysis, wave 4{-10} ended on October 10 and downtrending wave 5{-10} is now underway.

The price has moved below the starting point of wave 4{-10}, from 3668, not an unusual condition for a 4th wave. If wave C{-11} within wave 4{-10} is still underway, then the price will rise higher, likely reaching above 3667.50, the peak of wave A{-11}. If wave 5{-10} is underway, then the price will fall further, likely reaching or coming close to 3500, the lower boundary of the price channel (marked in red on the chart).

This is all happening within wave 5{-9}, whose end will mark the end of its parent, wave 5{-8}, and grand-parent, wave 1{-7}, which began on August 16 from 4327.50. Wave 2{-7}, an upward correction, will follow, retracing a portion of the decline from 4327.50 to the end of wave 1{-7].

Assuming that wave 1{-7} ends near the lower boundary of the price channel, around 3500, then a common 50% Fibonacci retracement in wave 2{-7} would carry the price back up to the 3910s, and an also common 61.8% retracement, up to the 4010s, levels last seen in mid-September.

We Are Here.

These are the waves currently in progress under my principal analysis. Each line on the list shows the wave number, with the subscript in curly brackets, the traditional degree name, the starting date, the starting price of the S&P 500 E-mini futures, and the direction of the wave.

  • S&P 500 Index:
  • 5{+3} Supercycle, 7/8/1932, 4.40 (up)
  • 5{+2} Cycle, 12/9/1974, 60.96 (up)
  • 5{+1} Primary, 3/6/2009, 666.79 (up)
  • 5{0} Intermediate, 12/26/2018, 2346.58 (up)
  • 4{-1} Minor, 1/4/2022 4818.62 (down)
  • 1{-2} Minute, 1/4/2022 4818.62 (down)
  • S&P 500 Futures and index:
  • 1{-3} Minuette, 1/4/2022, 4808.25 (down) (futures), 4818.62 (down) (index)
  • S&P 500 Futures:
  • 1{-4} Subminuette, 1/4/2022, 4808.25 (down)
  • 1{-5} Micro, 1/4/2022, 4808.25 (down)
  • 3{-6} Submicro, 8/16/2022, 4327.50 (down)
  • 1{-7} Minuscule, 8/16/2022, 4327.50 (down)
  • 5{-8} Subminuscule, 9/13/2022, 4175 (down)

Learning and other resources. Elliott wave analysis provides context, not prophecy. As the 20th century semanticist Alfred Korzybski put it in his book Science and Sanity (1933), “The map is not the territory … The only usefulness of a map depends on similarity of structure between the empirical world and the map.” And I would add, in the ever-changing markets, we can judge that similarity of structure only after the fact.

See the menu page Analytical Methods for a rundown on where to go for information on Elliott wave analysis.

By Tim Bovee, Portland, Oregon, October 11, 2022

Disclaimer

Tim Bovee, Private Trader tracks the analysis and trades of a private trader for his own accounts. Nothing in this blog constitutes a recommendation to buy or sell stocks, options or any other financial instrument. The only purpose of this blog is to provide education and entertainment.

No trader is ever 100 percent successful in his or her trades. Trading in the stock and option markets is risky and uncertain. Each trader must make trading decisions for his or her own account, and take responsibility for the consequences.

License
Creative Commons License

All content on Tim Bovee, Private Trader by Timothy K. Bovee is licensed under a Creative Commons Attribution-ShareAlike 4.0 International License.

Based on a work at www.timbovee.com.

Trader’s Notebook

3:30 p.m. New York time

Half an hour before the closing bell. The S&P 500 fell further during the session, to 3600 on the futures, and the rose back to the 3650s. The downtrend that began on October 5 continues and is now in its next-to-the-last leg, an upward correction that will be followed by a further decline.

In Elliott wave terminology, downtrending wave 5{-9} is still underway and internally, is in wave 4{-10}, an upward correction. A 4th wave generally has three waves internally. I see it as being in its middle wave, B{-11}. True, the price has gone below the starting point of wave 4{-10}, but that’s not uncommon for 4th waves. By this analysis, the rise that followed the session low is either a subwave of wave B{-11}, or the start of the final wave, C{-11}.

Alternatively, if the price falls further to a noticeable extent, then wave 4{-10} ended at this morning’s high, 3667.50, and wave 5{-10}, the final wave within wave 5{-9} has begun.

I’ve updated the chart.

10:10 a.m. New York time

CORRECTION: In this morning’s post and also in Friday’s, I erroneously said that U.S. markets will be closed on Monday — today — for a holiday. The bond markets will be closed, but the stock markets are open.

9:35 a.m. New York time

What’s happening now? The S&P 500 E-mini futures gapped 22 points below Friday’s close when trading resumed Sunday night, opening at 3628.76. The price pushed a bit lower to 3618 and then reversed, rising back into the 3660s.

U.S. bond markets are closed today for a holiday, variously called Indigenous People’s Day or Columbus Day, depending upon which part of the country is doing the naming. The stock markets will be open. (This corrects an earlier post that said the stock market would be closed.)

What does it mean? The middle leg has ended within a downtrend that began on October 5 from 3820, and a small upward correction has begun. When the correction is complete, then the final leg of the downtrend will carry the price further down.

The price target, based on the price channel, shown in red on the chart, would be in the low 3500s. However, market movements don’t always stay within the price channels, so the price target is a maybe, not a certainty.

What are the alternatives? I’ve counted the upward correction as being one level down from the full downtrend. It’s possible to count it as being one level smaller, making it a correction within the middle leg of the downtrend.

I think the principal analysis is more likely because of how close the price has come to the lower boundary of the price channel. The alternative analysis gives more room for the downtrend to continue, and that would carry the price noticeably beyond the channel’s lower boundary.

[S&P 500 E-mini futures at 3:30 p.m., 80-minute bars, with volume]

What does Elliott wave theory say? The downtrend is wave 5{-9}, and the upward correction, under my principal analysis, is wave 4{-10}. Fourth waves usually have three subwaves, and the second subwave can move below the starting point of the correction –3618 in this case — without triggering a re-analysis.

Under the alternative analysis, the upward correction is wave 4{-11} within wave 3{-10}, which in turn is a subwave of wave 5{-9}.

In either case, the end of wave 5{-9} will also be the end of its parent wave, 5{-8}, which began on September 13 from 4175, and the start of an much larger upward correction, wave 2{-7}, correcting wave 1{-7}, which began on August 16 from 4327.50.

We Are Here.

These are the waves currently in progress under my principal analysis. Each line on the list shows the wave number, with the subscript in curly brackets, the traditional degree name, the starting date, the starting price of the S&P 500 E-mini futures, and the direction of the wave.

  • S&P 500 Index:
  • 5{+3} Supercycle, 7/8/1932, 4.40 (up)
  • 5{+2} Cycle, 12/9/1974, 60.96 (up)
  • 5{+1} Primary, 3/6/2009, 666.79 (up)
  • 5{0} Intermediate, 12/26/2018, 2346.58 (up)
  • 4{-1} Minor, 1/4/2022 4818.62 (down)
  • 1{-2} Minute, 1/4/2022 4818.62 (down)
  • S&P 500 Futures and index:
  • 1{-3} Minuette, 1/4/2022, 4808.25 (down) (futures), 4818.62 (down) (index)
  • S&P 500 Futures:
  • 1{-4} Subminuette, 1/4/2022, 4808.25 (down)
  • 1{-5} Micro, 1/4/2022, 4808.25 (down)
  • 3{-6} Submicro, 8/16/2022, 4327.50 (down)
  • 1{-7} Minuscule, 8/16/2022, 4327.50 (down)
  • 5{-8} Subminuscule, 9/13/2022, 4175 (down)

Learning and other resources. Elliott wave analysis provides context, not prophecy. As the 20th century semanticist Alfred Korzybski put it in his book Science and Sanity (1933), “The map is not the territory … The only usefulness of a map depends on similarity of structure between the empirical world and the map.” And I would add, in the ever-changing markets, we can judge that similarity of structure only after the fact.

See the menu page Analytical Methods for a rundown on where to go for information on Elliott wave analysis.

By Tim Bovee, Portland, Oregon, October 10, 2022

Disclaimer

Tim Bovee, Private Trader tracks the analysis and trades of a private trader for his own accounts. Nothing in this blog constitutes a recommendation to buy or sell stocks, options or any other financial instrument. The only purpose of this blog is to provide education and entertainment.

No trader is ever 100 percent successful in his or her trades. Trading in the stock and option markets is risky and uncertain. Each trader must make trading decisions for his or her own account, and take responsibility for the consequences.

License
Creative Commons License

All content on Tim Bovee, Private Trader by Timothy K. Bovee is licensed under a Creative Commons Attribution-ShareAlike 4.0 International License.

Based on a work at www.timbovee.com.

Trader’s Notebook

3:30 p.m. New York time

Half an hour before the closing bell. The S&P 500 has fallen continually during the session, reaching into the 3630s on the futures. Downtrending wave 5{-9} continues. This morning’s analysis remains unchanged. I’ve updated the chart.

2:35 p.m. New York time

Bond market holiday on Monday. U.S. bond markets will be closed on Monday for a holiday, Indigenous People’s Day or Columbus Day, depending upon the state. The stock exchanges will be open. (This corrects an earlier post that said stock markets would be closed.)

9:35 a.m. New York time

What’s happening now? The S&P 500 E-mini futures fell sharply before the opening bell, moments after a data release showing that the economy added 263,000 jobs in September.

What does it mean? The decline was sufficient to resolve the question that has dominated this analysis over the last few days: Has the upward correction that began on September 28 ended yet? And the answer is “Yes”. It ended on October 5, having reached 3820. The decline from that level had a reached a low so far of 3700.25 as the opening bell sounded.

The decline is the resumption of a larger downtrend that began on September 13 from 4175. I’ve placed a price channel on the chart showing a target of around 3500 for the present decline. As always in the ambiguous world of market charts, the price could wildly exceed that target, or it could come up short.

What are the alternatives? There are two.

Alternative #1: If the price reverses quickly and exceeds 3820, then the third leg of the upward correction is still underway and the resumption of the downtrend lies in the future.

Alternative #2: The three-wave corrective pattern that began on September 28 ended at the October 5 peak, and the upward correction is taking a compound form. The subsequent decline will connect the first corrective pattern with a second pattern that is yet to come, and even with a third pattern. After the compound correction is complete, the downtrend will resume.

[S&P 500 E-mini futures at 3:30 p.m., 75-minute bars, with volume]

What does Elliott wave theory say? Under the principal analysis, the downtrend now underway is wave 5{-9}, whose parent, wave 5{-8}, began on September 13. The preceding upward correction, wave 4{-9}, ended on October 5.

The price channel for wave 5{-8}, shown on the chart in red, connects the starting points of declining wave 3{-9} and 5{-9} as its upper boundary, with a lower boundary formed by a parallel line intersecting the end point of wave 3{-9}. Wave 5{-8} is downtrending, and so the lower boundary is a moving target for wave 5{-9}; the longer it takes the wave to reach the lower boundary, the lower that boundary has sunk.

Also, 5th waves, famously, are fickle creatures. Sometimes they hit the lower boundary precisely or nearly so, sometimes they are truncated and end before reaching the boundary, and sometimes they are extended and move far beyond the boundary.

Wave 5{-9} is the final wave within wave 5{-8} and one degree higher, within wave 1{-7}. So the end of wave 5{-9} will also be the end of waves 5{-8} and 1{-7}. Wave 2{-7}, a larger upward correction than the one ended this week, will ensue.

Second waves never move beyond the starting point of the preceding 1st wave, so the absolute cap for wave 2{-7} is 4327.50, attained on August 16. A typical retracement is one of the major Fibonacci levels, perhaps a 50% retracement, a bit shy of 4337, or a 61.8% retracement, back to 3900 or a bit higher, both assuming a low of 3500.

There are a lot of assumptions in those guesses, and they are not information that I would use for trading at this early stage. Nonetheless, they give an idea of the possible magnitude of wave 2{-7}; it wouldn’t be unusual for the price, in wave 2{-7}, to return to levels above the October 5 peak of wave 4{-9}.

Under alternative analysis #1, wave 4{-9} is still underway and the overnight decline is a subwave within wave C{-10} of the the rising correction.

Under alternative analysis #2, wave 4{-9} is taking a compound form. The first corrective pattern ended with wave C{-10} on October 5 and the subsequent decline is wave X{-10}, which will connect the first corrective pattern to a second corrective pattern.

All of this is happening within a far larger downtrend, wave 4{-1}, which began on January 4 from 4818.62 on the index.

We Are Here.

These are the waves currently in progress under my principal analysis. Each line on the list shows the wave number, with the subscript in curly brackets, the traditional degree name, the starting date, the starting price of the S&P 500 E-mini futures, and the direction of the wave.

  • S&P 500 Index:
  • 5{+3} Supercycle, 7/8/1932, 4.40 (up)
  • 5{+2} Cycle, 12/9/1974, 60.96 (up)
  • 5{+1} Primary, 3/6/2009, 666.79 (up)
  • 5{0} Intermediate, 12/26/2018, 2346.58 (up)
  • 4{-1} Minor, 1/4/2022 4818.62 (down)
  • 1{-2} Minute, 1/4/2022 4818.62 (down)
  • S&P 500 Futures and index:
  • 1{-3} Minuette, 1/4/2022, 4808.25 (down) (futures), 4818.62 (down) (index)
  • S&P 500 Futures:
  • 1{-4} Subminuette, 1/4/2022, 4808.25 (down)
  • 1{-5} Micro, 1/4/2022, 4808.25 (down)
  • 3{-6} Submicro, 8/16/2022, 4327.50 (down)
  • 1{-7} Minuscule, 8/16/2022, 4327.50 (down)
  • 5{-8} Subminuscule, 9/13/2022, 4175 (down)

Learning and other resources. Elliott wave analysis provides context, not prophecy. As the 20th century semanticist Alfred Korzybski put it in his book Science and Sanity (1933), “The map is not the territory … The only usefulness of a map depends on similarity of structure between the empirical world and the map.” And I would add, in the ever-changing markets, we can judge that similarity of structure only after the fact.

See the menu page Analytical Methods for a rundown on where to go for information on Elliott wave analysis.

By Tim Bovee, Portland, Oregon, October 7, 2022

Disclaimer

Tim Bovee, Private Trader tracks the analysis and trades of a private trader for his own accounts. Nothing in this blog constitutes a recommendation to buy or sell stocks, options or any other financial instrument. The only purpose of this blog is to provide education and entertainment.

No trader is ever 100 percent successful in his or her trades. Trading in the stock and option markets is risky and uncertain. Each trader must make trading decisions for his or her own account, and take responsibility for the consequences.

License
Creative Commons License

All content on Tim Bovee, Private Trader by Timothy K. Bovee is licensed under a Creative Commons Attribution-ShareAlike 4.0 International License.

Based on a work at www.timbovee.com.

Trader’s Notebook

3:30 p.m. New York time

Half an hour before the closing bell. The S&P 500 has remained below yesterday’s closing high during the session, rising to touch the upper price channel and then retreating to a slightly lower level than before.

The lower the price drops, the more likely this morning’s alternative #1 scenario becomes: The upward correction ended at yesterday’s high of 3820 on the futures. For now, I’m leaving the analysis unchanged from the morning’s principal scenario: The upward correction of the last few days is still underway.

I’ve updated the chart.

9:35 a.m. New York time

What’s happening now? The S&P 500 E-mini futures fell overnight from yesterdays high of 3820, and then rose again, remaining below that peak.

What does it mean? Different day, same song. The final leg of the upward correction that began on September 28 is still underway, although it is nearing completion. The subsequent decline and rise are movements of smaller scale within that final portion of the correction.

What are the alternatives? Or, equally likely — alternative #1 — the upward correction ended at yesterday’s peak, and the subsequent decline and rise are the first steps in a resumption of the downtrend that began on September 13.

Or, less likely — alternative #2 — the upward correction is taking a compound form, made up of two or three corrective patterns. The overnight decline and rise are movements within a downward movement that will connect the first corrective pattern, now complete, with a second correction pattern, which has not yet begun.

I’ve labeled the chart according to the principal analysis. The price channel, in red, has been set as though yesterday’s high was in fact the end of the correction. I think of it as a hypothetical price channel, since the real channel, which sets a lower target once the downtrend resumes, will need wait for the end of the correction.

[S&P 500 E-mini futures at 3:30 p.m., 70-minute bars, with volume]

What does Elliott wave theory say? Wave C{-10}, the final wave within wave 4{-9}, an upward correction that began on September 28 from 3613, is still underway. It set a high yesterday of 3820, and then pulled back slightly in a movement of lower degree within wave C{-10}. Wave 4{-9}, when complete, will be followed by wave 5{-9}, the final wave in a downtrend, wave 5{-8}, that began on September 13 from 4175.

A 4th wave cannot move beyond the end of the preceding 1st wave, setting an upward limit on wave 4{-9} of 3938.20, about 118 points above yesterday’s high. If the 5th wave that will follow wave 4{-9} adheres to the hypothetical price channel, which assumes that yesterday’s high was the end of the upward correction, then wave 5{-9} will come close to 3500 and will perhaps reach below it..

Under the 1st alternative analysis, wave 4{-9} ended at yesterday’s high and wave 5{-9} is underway.

Under the 2nd alternative analysis, wave 4{-9} is forming a compound correction, yesterday’s high was the end of the first corrective pattern, and the subsequent decline is wave X{-10}, connecting the first pattern with a second corrective pattern to come.

The parent wave of all of this Sturm und Drang, wave 5{-8}, is the final wave within wave 1{-7}, a downtrend that began on August 16 from 4325.28. Both the parent and the subwave will end simultaneously and wave 2{-7} will begin, an upward correction two degrees higher in size than our present concern, wave 4{-9}.

Wave 2{-7} will provide bulls some respite from the major bear trend that began on January 4 from 4818.62 on the index. That bear trend is wave 4{-1}, the penultimate wave within wave 5{0}, an expanding Diagonal Triangle that began on on December 26, 2018.

We Are Here.

These are the waves currently in progress under my principal analysis. Each line on the list shows the wave number, with the subscript in curly brackets, the traditional degree name, the starting date, the starting price of the S&P 500 E-mini futures, and the direction of the wave.

  • S&P 500 Index:
  • 5{+3} Supercycle, 7/8/1932, 4.40 (up)
  • 5{+2} Cycle, 12/9/1974, 60.96 (up)
  • 5{+1} Primary, 3/6/2009, 666.79 (up)
  • 5{0} Intermediate, 12/26/2018, 2346.58 (up)
  • 4{-1} Minor, 1/4/2022 4818.62 (down)
  • 1{-2} Minute, 1/4/2022 4818.62 (down)
  • S&P 500 Futures and index:
  • 1{-3} Minuette, 1/4/2022, 4808.25 (down) (futures), 4818.62 (down) (index)
  • S&P 500 Futures:
  • 1{-4} Subminuette, 1/4/2022, 4808.25 (down)
  • 1{-5} Micro, 1/4/2022, 4808.25 (down)
  • 3{-6} Submicro, 8/16/2022, 4325.28 (down)
  • 1{-7} Minuscule, 8/16/2022, 4325.28 (down)
  • 5{-8} Subminuscule, 9/13/2022, 4175 (down)

Learning and other resources. Elliott wave analysis provides context, not prophecy. As the 20th century semanticist Alfred Korzybski put it in his book Science and Sanity (1933), “The map is not the territory … The only usefulness of a map depends on similarity of structure between the empirical world and the map.” And I would add, in the ever-changing markets, we can judge that similarity of structure only after the fact.

See the menu page Analytical Methods for a rundown on where to go for information on Elliott wave analysis.

By Tim Bovee, Portland, Oregon, October 6, 2022

Disclaimer

Tim Bovee, Private Trader tracks the analysis and trades of a private trader for his own accounts. Nothing in this blog constitutes a recommendation to buy or sell stocks, options or any other financial instrument. The only purpose of this blog is to provide education and entertainment.

No trader is ever 100 percent successful in his or her trades. Trading in the stock and option markets is risky and uncertain. Each trader must make trading decisions for his or her own account, and take responsibility for the consequences.

License
Creative Commons License

All content on Tim Bovee, Private Trader by Timothy K. Bovee is licensed under a Creative Commons Attribution-ShareAlike 4.0 International License.

Based on a work at www.timbovee.com.
Trader’s Notebook

3:30 p.m. New York time

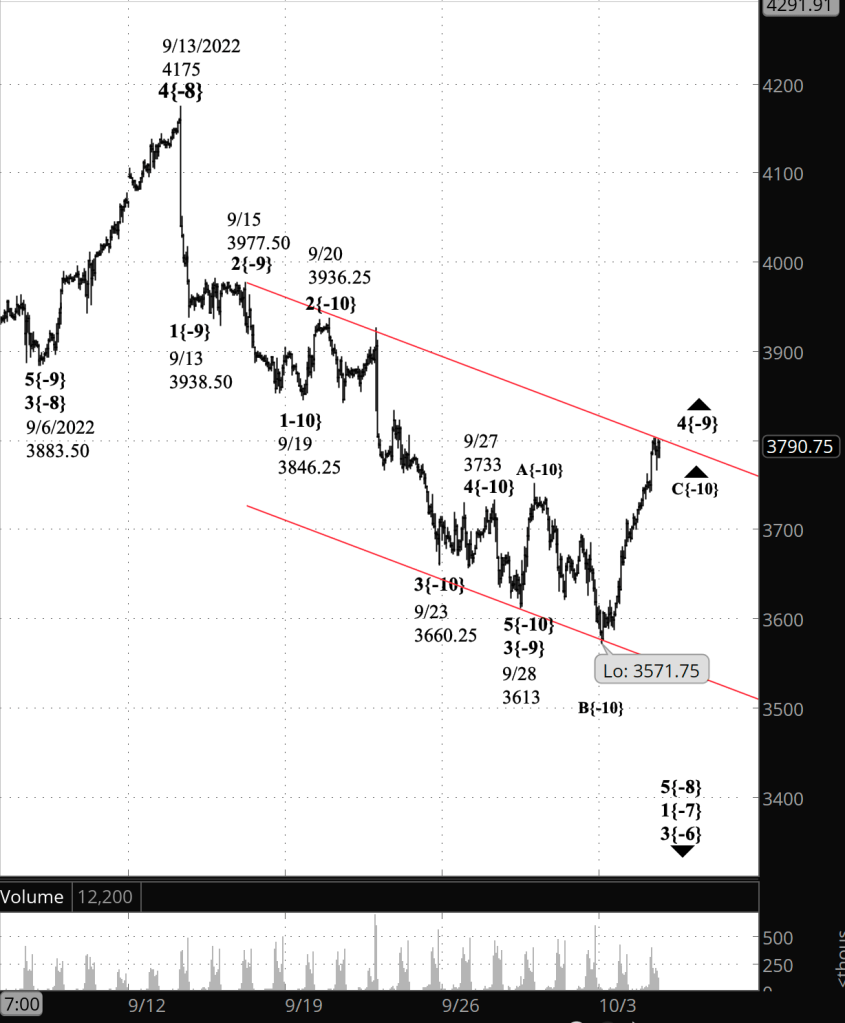
Half an hour before the closing bell. The S&P 500 futures declined and then rose during the session, breaking above the overnight high. The new high confirms the principal analysis from this morning: The third subwave, C{-10}, within an upward correction, wave 4{-9}, is still underway. I’ve updated the chart, leaving the upper boundary of the price channel where it was this morning, touching the overnight high, in order to illustrate the extent of the session’s breakout.

9:35 a.m. New York time

What’s happening now? The S&P 500 E-mini futures peaked at 3808.75 two minutes after yesterday’s closing bell sounded and then began an overnight decline that so far has reached the 3760s.

What does it mean? I see two choices of equal likelihood. For the principal analysis, appearing on the chart, I’ve arbitrarily chosen a scenario where the upward correction that began on September 28 has not yet reached its end, although it’s in its final stages.

What are the alternatives? There are two.

Alternative #1: Of equal likelihood with the principal analysis is a scenario that sees the 3808.75 peak as the end of the upward correction and the subsequent decline as the first tentative steps of a resumption of the downtrend that began on September 13.

Alternative #2: Also possible, although less likely, is a scenario that sees the 3808.75 peak as the end of the first corrective pattern within a compound correction that will contain two or three corrective patterns. This analysis sees the decline from the peak as the beginning of a connecting wave, which will be followed by a second corrective pattern.

If the price rises above yesterday’s peak, then the principal analysis is correct. If the price falls, then one of the alternatives is correct. The further the price falls, the more likely it is that alternative #1 matches the chart: The upward correction ended yesterday and the downtrend has resumed.

Note that the price channel on the chart assumes, for the sake of convenience, that 3808.75 was the end of the upward correction.

[S&P 500 E-mini futures at 3:30 p.m., 70-minute bars, with volume]

What does Elliott wave theory say? Under the principal analysis, the upward correction, wave 4{-9}, is still underway and is in its third and final leg, wave C{-10}.

The first alternative analysis has it that wave 4{-9} ended yesterday at 3808.75, and that price is the beginning of declining wave 5{-9}, the final wave within a larger downtrend, wave 5{-8}, that began on September 13 from 4175. This scenario matches the price channel on the chart. The channel’s upper boundary connects the starting points of waves 3 and 5, and we don’t yet know the starting point of wave 5, not as a certainty.

The second alternative sees the decline from the peak as wave X{-10}, a wave connecting the corrective pattern that ended yesterday with a future second pattern within a compound correction.

In any of the three possibilities presently on the table, wave 5{-9} will eventually begin, if it hasn’t already, and will carry the price down toward or below 3500.

But what happens next? The end of wave 5{-9} is also the end of wave 5{-8}, which began on September 13, and of its parent, wave 1{-7}, which began on August 16 from 4325.28. The fractal nature of a market chart means that any trend contains smaller trends and counter trends. Wave 1{-7} is the first wave within a larger downtrend, wave 3{-6}, which also began on August 16 from 4325.28. The wave that follows, wave 2{-7}, will be an upward correction that will take back a portion of the entire decline from 4325.38 to 3500 or wherever wave 5{-9} ends. It will be followed by downtrending wave 3{-7}, a powerful decline that will carry the price still lower, beyond the end of wave 5{-9}.

And so it goes, waves within waves, all the way the up the present set of downtrending waves to the largest of them all, wave 4{-1}, which began on January 4, 2022 from 4818.62.

Wave 4{-1} is the next-to-the-last wave within an expanding Diagonal Triangle, wave 5{0}, that began on December 26, 2018 from 2346.58 on the index. Prices will remain below wave 4{-1}’s starting point, 4818.62, until the wave is complete. Afterward, wave 5{-1} will likely carry the price to heights, above that wave 4{-1} beginning.

Until then markets will be downtrending, but with a lot of bullish opportunities in the mix as the price works its way downward. The thing to remember in interpreting the chart within wave 4{-1} is this: Waves 1, 3 and 5, bearish, and waves 2 and 4, bullish.

We Are Here.

These are the waves currently in progress under my principal analysis. Each line on the list shows the wave number, with the subscript in curly brackets, the traditional degree name, the starting date, the starting price of the S&P 500 E-mini futures, and the direction of the wave.

  • S&P 500 Index:
  • 5{+3} Supercycle, 7/8/1932, 4.40 (up)
  • 5{+2} Cycle, 12/9/1974, 60.96 (up)
  • 5{+1} Primary, 3/6/2009, 666.79 (up)
  • 5{0} Intermediate, 12/26/2018, 2346.58 (up)
  • 4{-1} Minor, 1/4/2022 4818.62 (down)
  • 1{-2} Minute, 1/4/2022 4818.62 (down)
  • S&P 500 Futures and index:
  • 1{-3} Minuette, 1/4/2022, 4808.25 (down) (futures), 4818.62 (down) (index)
  • S&P 500 Futures:
  • 1{-4} Subminuette, 1/4/2022, 4808.25 (down)
  • 1{-5} Micro, 1/4/2022, 4808.25 (down)
  • 3{-6} Submicro, 8/16/2022, 4325.28 (down)
  • 1{-7} Minuscule, 8/16/2022, 4325.28 (down)
  • 5{-8} Subminuscule, 9/13/2022, 4175 (down)

Learning and other resources. Elliott wave analysis provides context, not prophecy. As the 20th century semanticist Alfred Korzybski put it in his book Science and Sanity (1933), “The map is not the territory … The only usefulness of a map depends on similarity of structure between the empirical world and the map.” And I would add, in the ever-changing markets, we can judge that similarity of structure only after the fact.

See the menu page Analytical Methods for a rundown on where to go for information on Elliott wave analysis.

By Tim Bovee, Portland, Oregon, October 5, 2022

Disclaimer

Tim Bovee, Private Trader tracks the analysis and trades of a private trader for his own accounts. Nothing in this blog constitutes a recommendation to buy or sell stocks, options or any other financial instrument. The only purpose of this blog is to provide education and entertainment.

No trader is ever 100 percent successful in his or her trades. Trading in the stock and option markets is risky and uncertain. Each trader must make trading decisions for his or her own account, and take responsibility for the consequences.

License
Creative Commons License

All content on Tim Bovee, Private Trader by Timothy K. Bovee is licensed under a Creative Commons Attribution-ShareAlike 4.0 International License.

Based on a work at www.timbovee.com.
Trader’s Notebook

3:30 p.m. New York time

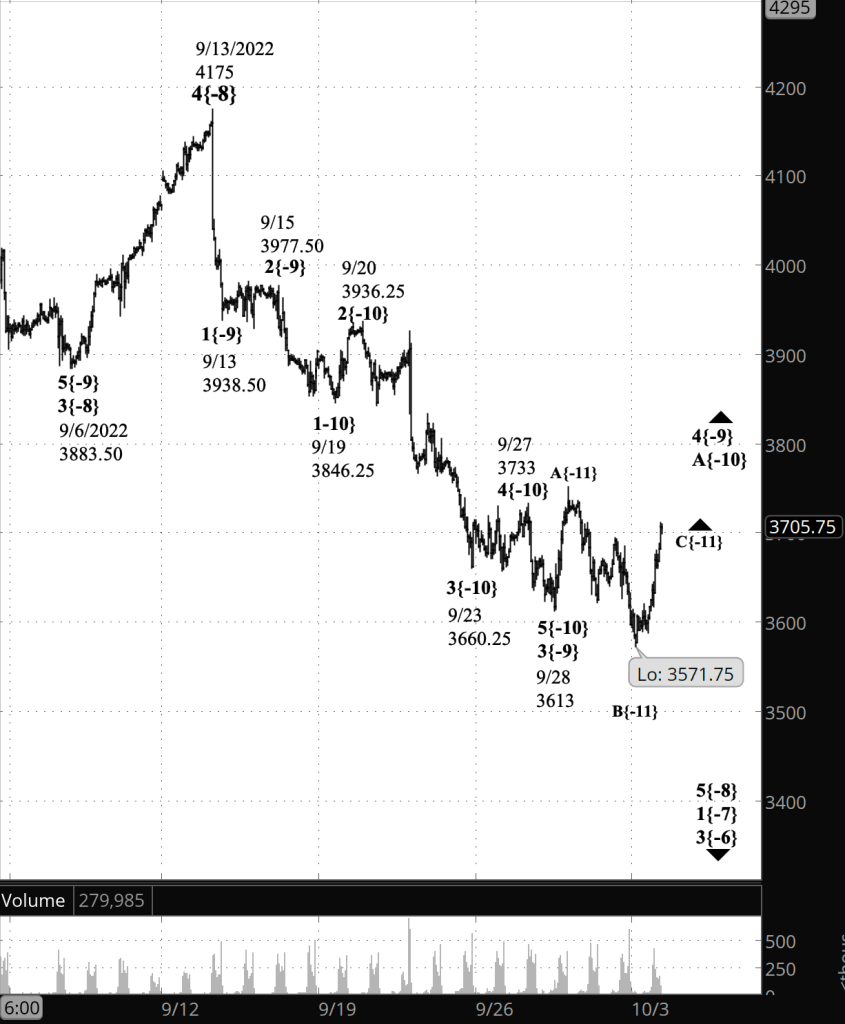
Half an hour before the closing bell. The S&P 500 continued to rise during the session, reaching just above 3800 and confirming the principal analysis from this morning.

I’ve updated the chart, including an adjustment to the price channel that places the upper boundary on today’s new high, with the understanding that this high may be just a stopping point before the price increases further.

The upper limit for a 4th wave is the end of the preceding 1st wave, which wave 1{-9), ending at 3938.50. If wave C{-10} should carry its parent, wave 4{-9}, above that level, then the analysis no longer matches the chart and will cry out for revision.

I’ve updated the chart, below.

9:35 a.m. New York time

What’s happening now? The S&P 500 E-mini futures continued to rise in overnight trading, reaching into the 3760s.

What does it mean? An upward correction that began on September 28 is still underway and is in its final leg. It has exceeded the price target that would be typical of a formation of its type, 3660.25 to 3733 in this case. The correction, when complete, will be followed by a resumption of the downtrend that began on September 13 from 4175, a move that likely will carry the price into the low 3500s and perhaps lower still.

I’ve placed a tentative price channel on the chart below, in red, that assumes the upward correction has ended at the overnight high. That’s probably not the case, but nonetheless, the channel gives some idea of how far the resumed downtrend is likely to fall.

What are the alternatives? The present task is to identify an endpoint of the the upward correction. There are several possibilities.

Alternative #1: The present high is the end of the upward correction. This scenario will be tentatively confirmed if the price reverses to the downside, the first leg of the resumed downtrend. (The price channel assumes this scenario, but the chart labeling reflects the principal analysis: The correction has further to go.)

Alternative #2: The correction takes a compound form, linking together two or three corrective patterns. This scenario will also be tentatively confirmed if the price reverses to the downside, except in this case, the decline will be a connector wave, linking the first corrective pattern with a second one to come.

The lower the price goes, the more likely alternative #1 is. A reversal upward from the low or mid-3600s suggests that alternative #2 is more likely.

[S&P 500 E-mini futures at 3:30 p.m., hourly bars, with volume]

What does Elliott wave theory say? The price channel now in place has an upper boundary linking the end of wave 2{-9} and the presumed (uncertain) end of wave 4{-9}, with a lower boundary passing through the end of wave 3{-9}.

The present upward correction, wave 4{-9}, is internally in late stage of wave C{-10}. This is a change from yesterday’s labeling, which placed the present rise as wave C{-11} within wave A{-10}, the first leg of the parent wave 4{-9}. The price channel suggested to me that raising the {-11} degree to {-10} better matched the reality on the chart.

The C wave in a three-wave correction must have five waves internally, and wave C{-10} has met that requirement.

Fourth waves tend to end within the range of the 4th wave within the preceding 3rd wave. Wave 4{-10} within wave 3{-9} ranged from 3660.25 to 3733. Wave 4{-9} has already exceeded that range, have reached a high of 3761.50.

Wave 4{-9}, when complete, will be followed by a resumption of its parent, wave 5{-8}, which began on September 13 from 4175. The price channel’s lower boundary gives an indication of how far wave 5{-9} might fall before reaching its end. Presently, the lower boundary is at 3571.75, and it moves lower every minute of every day. If the present wave 4{-9} peak is indeed the end, and if it takes wave 5{-9} four trading days to reach its completion, then the price target would be around 3500.

But 5th waves are inconsistent beasts. Sometimes they fall short of the price channel boundary, a condition called “truncation” in Elliott wave parlance, and sometimes they move far past the target, a condition called “extension”.

Under the principal analysis, wave C{-10} has not yet reached its end, and the upper boundary of the price channel will require adjustment for each new peak.

Under the first alternative, the present peak is the end of wave C{-10} and wave 5{-9} has already begun. If that’s the case, then the price channel stands as it is now.

Under the second alternative, the present peak, or a future peak, marks the end of the first corrective pattern within wave 4{-9} and willing followed by downward wave X{-10}, connecting the first pattern with a second one, in a compound correction that can take a wide variety of forms. Only after the compound correction is over will wave 5{-9} begin.

Wave 5{-8} is the smallest of a series of nested downtrending waves, reaching up seven degrees to wave 4{-1}, which began on January 4 from 4818.62 on the index.

Its parent is wave 5{0}, an expanding Diagonal Triangle that began on December 26, 2018 from 2346.58 on the index. Wave 4{-1} within wave 5{0} will be followed by wave 5{-1}, a large uptrend that will most likely carry the price to new highs, above the low 4800s. The end of wave 5{-1} will also complete wave 5{0} and a series of larger waves, up to wave 5{+3}, which began in 1932. A decades-long downward correction will follow. (See the We Are Here section below for a list of current waves from 5{-8} up to 5{+3}.)

We Are Here.

These are the waves currently in progress under my principal analysis. Each line on the list shows the wave number, with the subscript in curly brackets, the traditional degree name, the starting date, the starting price of the S&P 500 E-mini futures, and the direction of the wave.

  • S&P 500 Index:
  • 5{+3} Supercycle, 7/8/1932, 4.40 (up)
  • 5{+2} Cycle, 12/9/1974, 60.96 (up)
  • 5{+1} Primary, 3/6/2009, 666.79 (up)
  • 5{0} Intermediate, 12/26/2018, 2346.58 (up)
  • 4{-1} Minor, 1/4/2022 4818.62 (down)
  • 1{-2} Minute, 1/4/2022 4818.62 (down)
  • S&P 500 Futures and index:
  • 1{-3} Minuette, 1/4/2022, 4808.25 (down) (futures), 4818.62 (down) (index)
  • S&P 500 Futures:
  • 1{-4} Subminuette, 1/4/2022, 4808.25 (down)
  • 1{-5} Micro, 1/4/2022, 4808.25 (down)
  • 3{-6} Submicro, 8/16/2022, 4325.28 (down)
  • 1{-7} Minuscule, 8/16/2022, 4325.28 (down)
  • 5{-8} Subminuscule, 9/13/2022, 4175 (down)

Learning and other resources. Elliott wave analysis provides context, not prophecy. As the 20th century semanticist Alfred Korzybski put it in his book Science and Sanity (1933), “The map is not the territory … The only usefulness of a map depends on similarity of structure between the empirical world and the map.” And I would add, in the ever-changing markets, we can judge that similarity of structure only after the fact.

See the menu page Analytical Methods for a rundown on where to go for information on Elliott wave analysis.

By Tim Bovee, Portland, Oregon, October 4, 2022

Disclaimer

Tim Bovee, Private Trader tracks the analysis and trades of a private trader for his own accounts. Nothing in this blog constitutes a recommendation to buy or sell stocks, options or any other financial instrument. The only purpose of this blog is to provide education and entertainment.

No trader is ever 100 percent successful in his or her trades. Trading in the stock and option markets is risky and uncertain. Each trader must make trading decisions for his or her own account, and take responsibility for the consequences.

License
Creative Commons License

All content on Tim Bovee, Private Trader by Timothy K. Bovee is licensed under a Creative Commons Attribution-ShareAlike 4.0 International License.

Based on a work at www.timbovee.com.

Trader’s Notebook

3:30 p.m. New York time

Half an hour before the closing bell. The S&P 500 continued to rise during the session, reaching into the 3710s on the futures. The upward reversal confirms this morning’s principal analysis and eliminates the alternative analysis. In Elliott wave terminology, wave C{-11} within wave A{-10} within wave 4{-9}, an upward correction, are underway. I’ve updated the chart.

9:35 a.m. New York time

What’s happening now? The S&P 500 E-mini futures fell overnight, to 3571.75, and then rose, reaching back into the 3640s.

What does it mean? The overnight low ended the second leg of an upward correction within the first leg of a larger upward correction.

What are the alternatives? If the price reverses and falls significantly lower, with five waves internally, then it means that the larger correction is in fact over and the downtrend has resumed, requiring a reanalysis of the decline from September 20.

[S&P 500 E-mini futures at 3:30 p.m., hourly bars, with volume]

What does Elliott wave theory say? Under the principal analysis, wave A{-10}, an upward correction within wave 4{-9}, has been underway since September 28. Wave A{-10} has three waves internally if the parent wave’s pattern in a Flat, or five waves if it is a Zigzag. It has completed two waves, A{-11} and B{-11}, and has begun wave C{-11}. If the pattern is a Flat, then the present wave C{-11} is the end of wave A{-10} and will be followed by a declining wave B{-10}. If the pattern is a Zigzag, then wave C{-11} will be followed by two more waves, waves D{-11} and E{-11}. After E{-11} is complete, then wave B{-11} will continue the larger wave 4{-9}.

The overnight price fell below the start of wave 4{-9}, and although such a fall below the starting point isn’t done in 2nd waves, it happens routinely in 4th waves. A short rising wave C{-11} and then a large decline would, however, trigger the alternative count: Wave 4{-9} ended on September 28, at the peak of what is now labeled wave A{-11} on the principal analysis, and wave 5{-9} has begun.

The recount would most likely put the end of wave 4{-10} at the peak of what is now wave A{-11} and label the ensuing decline as wave 5{-10}.

All of this is happening within downtrending wave 5{-8}, which began on September 13 from 4175, the low wave of a nested series of downtrending waves stretching up seven degrees, to declining wave 4{-1}, which began on January 4 from 4818.62, the next to the last wave within an expanding Diagonal Triangle, wave 5{0}, that began on December 26, 2018, from 2346.58 on the index. Wave 4{-1} will be followed by rising wave 5{-1}, which will carry the price above the January 4 start of wave 4{-1}, perhaps significantly higher.

We Are Here.

These are the waves currently in progress under my principal analysis. Each line on the list shows the wave number, with the subscript in curly brackets, the traditional degree name, the starting date, the starting price of the S&P 500 E-mini futures, and the direction of the wave.

  • S&P 500 Index:
  • 5{+3} Supercycle, 7/8/1932, 4.40 (up)
  • 5{+2} Cycle, 12/9/1974, 60.96 (up)
  • 5{+1} Primary, 3/6/2009, 666.79 (up)
  • 5{0} Intermediate, 12/26/2018, 2346.58 (up)
  • 4{-1} Minor, 1/4/2022 4818.62 (down)
  • 1{-2} Minute, 1/4/2022 4818.62 (down)
  • S&P 500 Futures and index:
  • 1{-3} Minuette, 1/4/2022, 4808.25 (down) (futures), 4818.62 (down) (index)
  • S&P 500 Futures:
  • 1{-4} Subminuette, 1/4/2022, 4808.25 (down)
  • 1{-5} Micro, 1/4/2022, 4808.25 (down)
  • 3{-6} Submicro, 8/16/2022, 4325.28 (down)
  • 1{-7} Minuscule, 8/16/2022, 4325.28 (down)
  • 5{-8} Subminuscule, 9/13/2022, 4175 (down)

Learning and other resources. Elliott wave analysis provides context, not prophecy. As the 20th century semanticist Alfred Korzybski put it in his book Science and Sanity (1933), “The map is not the territory … The only usefulness of a map depends on similarity of structure between the empirical world and the map.” And I would add, in the ever-changing markets, we can judge that similarity of structure only after the fact.

See the menu page Analytical Methods for a rundown on where to go for information on Elliott wave analysis.

By Tim Bovee, Portland, Oregon, October 3, 2022

Disclaimer

Tim Bovee, Private Trader tracks the analysis and trades of a private trader for his own accounts. Nothing in this blog constitutes a recommendation to buy or sell stocks, options or any other financial instrument. The only purpose of this blog is to provide education and entertainment.

No trader is ever 100 percent successful in his or her trades. Trading in the stock and option markets is risky and uncertain. Each trader must make trading decisions for his or her own account, and take responsibility for the consequences.

License
Creative Commons License

All content on Tim Bovee, Private Trader by Timothy K. Bovee is licensed under a Creative Commons Attribution-ShareAlike 4.0 International License.

Based on a work at www.timbovee.com.