Trader’s Notebook

Note: Over the weekend, I posted a discussion of changes that I’m making in my earnings play strategy.

3:30 p.m. New York time

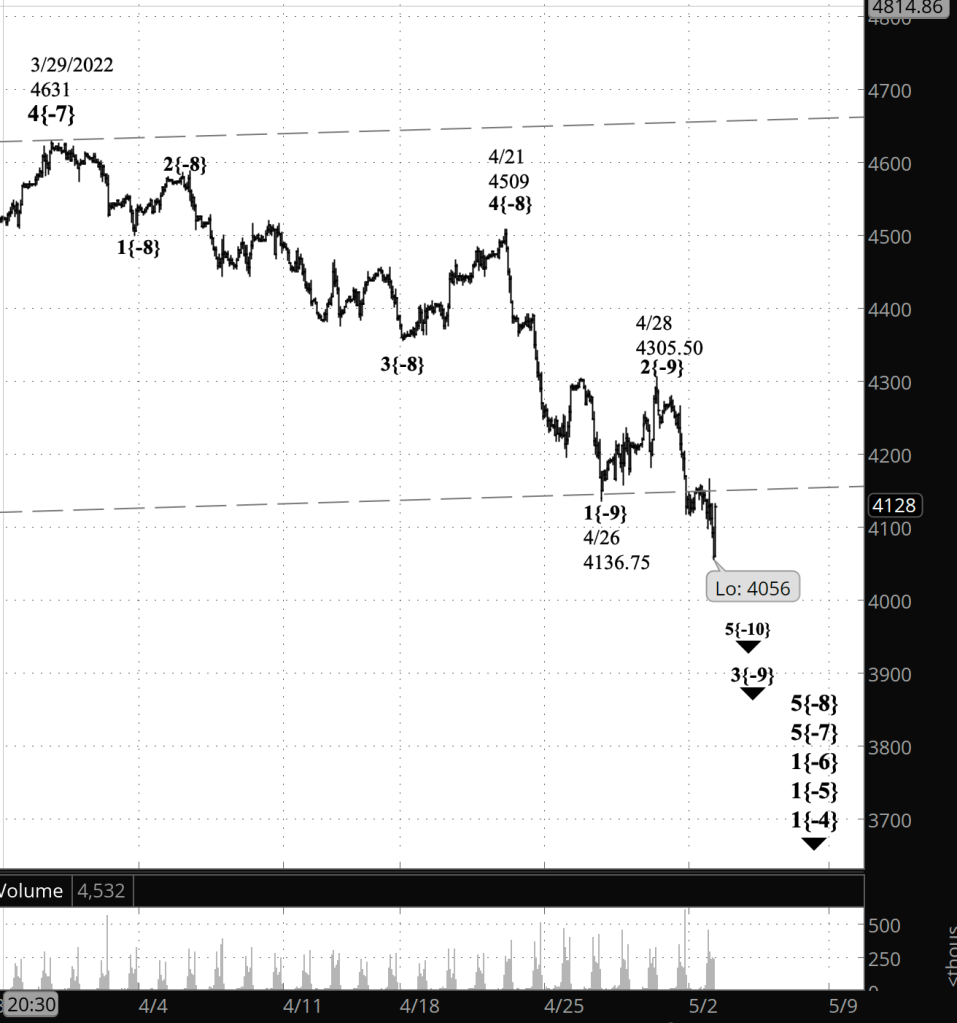
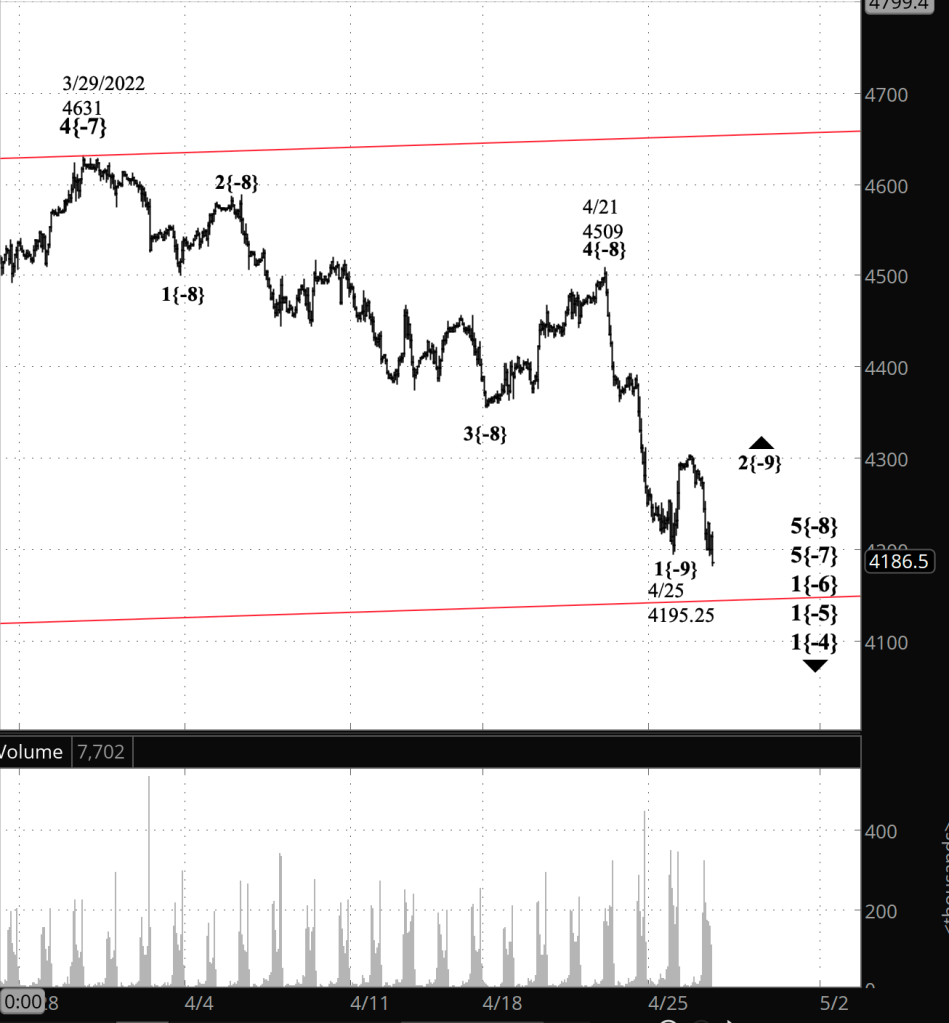
Half an hour before the closing bell. The S&P 500 continued to decline during the session, with each tick lower adding credibility to the scenario that says the decline that began on April 21 has resumed as a 3rd wave. Whether it’s wave 3{-9}, as I have it in my principal analysis, or something smaller, wave 3{-10} or even wave 3{-11}, is still up in the air. In any case, internally it is in its 5th wave — wave 5{-10} as I’ve marked the chart, but it could turn out to be wave 5{-11} or even something smaller. I’ve the updated the chart.

2:45 p.m. New York time

MOS earnings play entry. I’ve entered a bull put vertical spread on MOS and have posted an analysis of the trade.

2:35 p.m. New York time

MGM earnings play entry. I’ve entered a bull put vertical spread on MGM and have posted an analysis of the trade.

9:35 a.m. New York time

What’s happening now? The S&P 500 E-mini futures continued to fall after trading resumed overnight, in a pattern that places the end of the upward correction at the April 28 peak.

What does it mean? Under my principal analysis, the downtrend that began on April 21 has resumed.

What’s the alternative? The ambiguity lies in the placement of the present decline in relation to the April 21 downtrend. I discuss the question in the Elliott wave theory section, below.

[S&P 500 E-mini futures at 3:30 p.m., 75-minute bars, with volume]

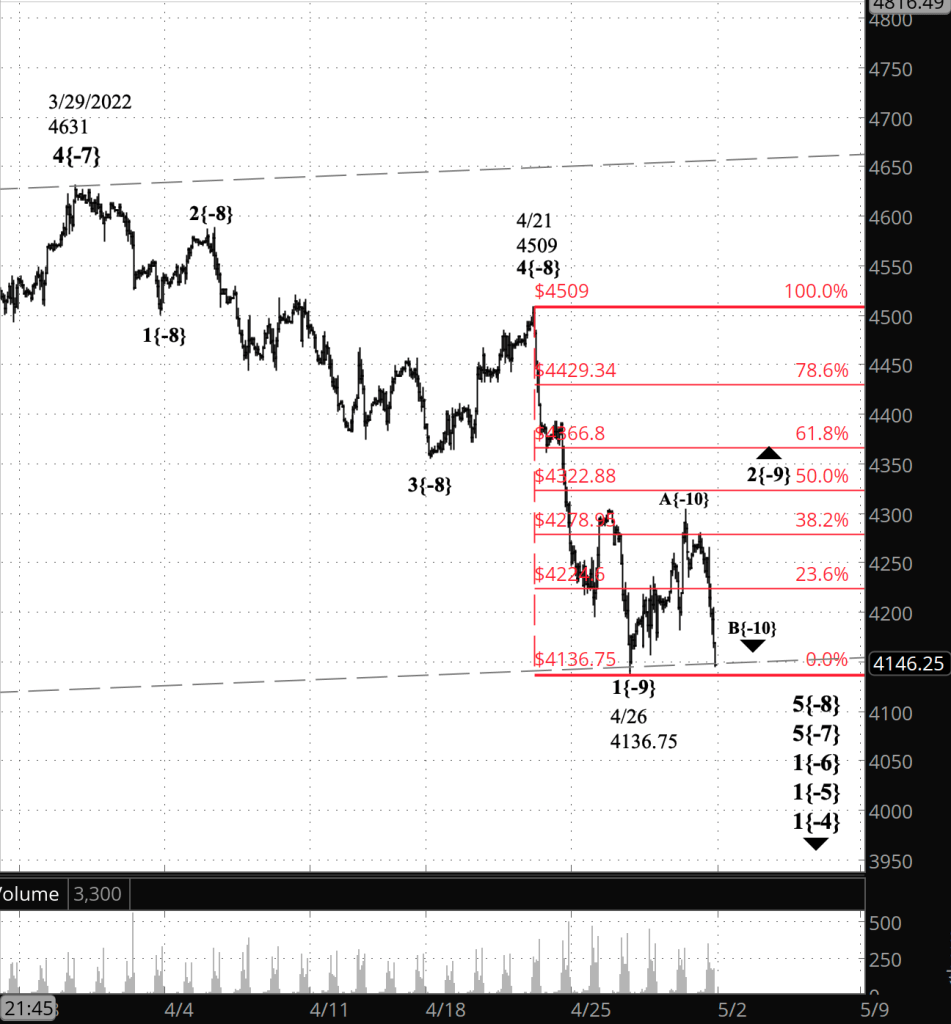
What does Elliott wave theory say? Under my principal analysis, the upward correction, wave 2{-9} within wave 5{-8}, ended on April 28 at 4305.50, close to the 38.2% Fibonacci retracement level. It seems a bit short for the full correction. Nonetheless, it would break no rules, and it’s possible to see three waves internally within the rise that ended on April 28.

I had labled the decline from April 28 as wave B{-10} within wave 2{-9}. But the decline has five waves internally, and a B wave must have three waves.

I labeled the decline from April 28 as wave 1{-10} within wave 3{-9}. To make it one degree higher, it seemed to me, would make the wave disproportionate to the preceding wave 1{-9}. Generally, 3rd waves are longer than both waves 1 and 5 in a set, and it’s a firm rule that wave 3 can’t be shorter than both. So as an alternative analysis, it may be that the developing chart will require wave 1{-10} to be relabeled as wave 3{-9}, or perhaps pushed down a level to wave 1{-11}.

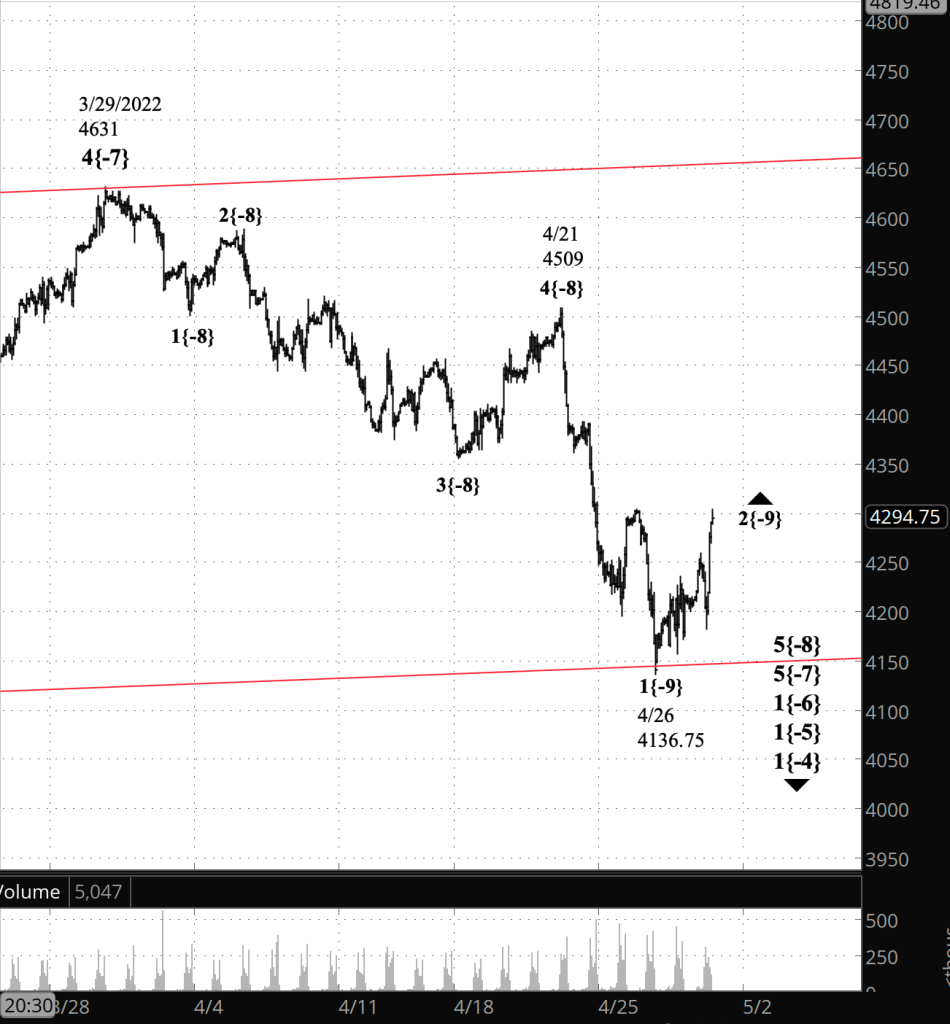
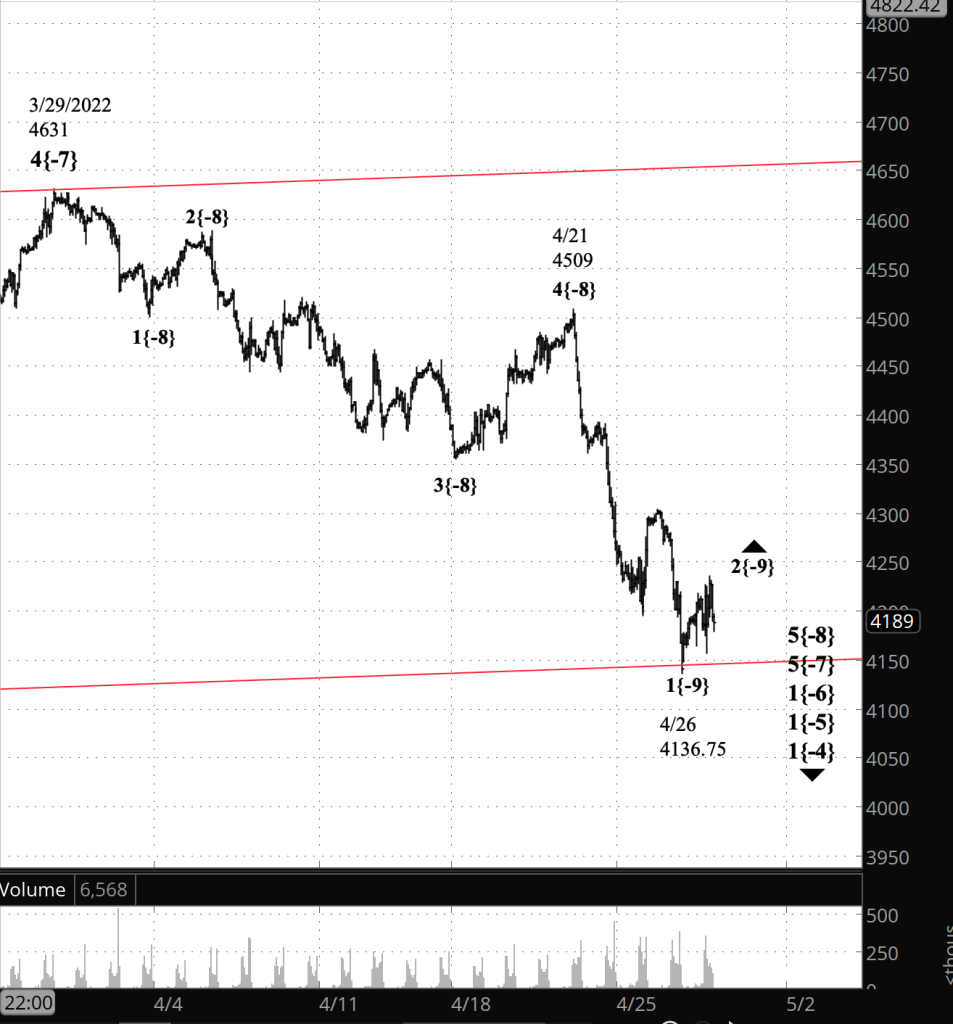
All of this is happening within wave 5{-7}, which began on March 29 from 4631, and wave 1{-6}, which began on January 4 from 4808.25. The two horizontal lines on the chart are the price channel for wave 1{-6}. Wave formations have a tendency to stay more or less within their price channels, but it’s not a certainty. Sometimes the price breaks free of such restraints.

We Are Here.

These are the waves currently in progress under my principal analysis. Each line on the list shows the wave number, with the subscript in curly brackets, the traditional degree name, the starting date, the starting price of the S&P 500 E-mini futures, and the direction of the wave.

  • Index:
  • 5{0} Intermediate, 12/26/2018, 2346.58 (up)
  • 4{-1} Minor, 1/4/2022 4818.62 (down)
  • 1{-2} Minute, 1/4/2022 4818.62 (down)
  • Futures and index:
  • 1{-3} Minuette, 1/4/2022, 4808.25 (down) (futures), 4818.62 (down) (index)
  • Futures:
  • 1{-4} Subminuette, 1/4/2022, 4808.25 (down)
  • 1{-5} Micro, 1/4/2022, 4808.25 (down)
  • 1{-6} Submicro, 1/4/2022, 4808.25 (down)
  • 5{-7} Minuscule, 3/29/2022, 4631 (down)
  • 5{-8} Subminuscule, 4/21/2022, 4509, (down)

Learning and other resources. Elliott wave analysis provides context, not prophecy. As the 20th century semanticist Alfred Korzybski put it in his book Science and Sanity (1933), “The map is not the territory … The only usefulness of a map depends on similarity of structure between the empirical world and the map.” And I would add, in the ever-changing markets, we can judge that similarity of structure only after the fact.

See the menu page Analytical Methods for a rundown on where to go for information on Elliott wave analysis.

By Tim Bovee, Portland, Oregon, May 2, 2022

Disclaimer

Tim Bovee, Private Trader tracks the analysis and trades of a private trader for his own accounts. Nothing in this blog constitutes a recommendation to buy or sell stocks, options or any other financial instrument. The only purpose of this blog is to provide education and entertainment.

No trader is ever 100 percent successful in his or her trades. Trading in the stock and option markets is risky and uncertain. Each trader must make trading decisions for his or her own account, and take responsibility for the consequences.

License
Creative Commons License

All content on Tim Bovee, Private Trader by Timothy K. Bovee is licensed under a Creative Commons Attribution-ShareAlike 4.0 International License.

Based on a work at www.timbovee.com.

Earnings Plays: A Change in Method

April was the fourth month in which I focused my options trading on earnings announcements. With 49 trades on the ledger, I now have enough data to evaluate the strategy.

The methodology is a model of simplicity:

  • Pick a direction for after an earnings announcement.
  • Place the trade in the last session before the announcement.
  • Exit immediately at 25% of maximum potential profit or greater.

Apart from those simple rules, I handled the trades the way I do all options positions: Hold on to the unprofitable ones in the hope that they’ll become profitable, and manage the positions 21 days (3 weeks) before the options expire, exiting positions that are profitable but below the target, and make a decision on unprofitable positions: Sell them or hold on hoping for a reversal in those three weeks.

The Problem

And it has worked. For those 49 trades, the average return, before fees, has been 50.9%, not bad at all. That works out to a daily average return of 27.6%. It’s lower because I tended to hold the losing trades longer, under my general rules for managing positions. And indeed, when I converted the daily return to an annualized return, the difference showed, as a loss of 69.1% per day.

That loss figure is a quite fascinating. Out of 49 total trades, 40 were profitable. Nine trades pushed the results down to a considerable degree.

So what’s going on here? During the last four months my instincts told me that holding on to a losing trade generally increased the loss and led to complications, such as early assignment. And I think these numbers back that up.

Which leads to another question: What makes earnings plays different from general options trades? My theory goes like this: Most market movements are unfocused. Millions of traders all have their own different reasons for trading long or short, for choosing the trade price. As a mass they create patterns in their trades, as shown by the S&P 500 Elliott wave analysis I post each day. But their various motivations offset each other to a degree, making it more likely that today’s rise will be reversed tomorrow.

Earnings plays, however, are focused. When the price rises after earnings, the traders are motivated by the company’s announcement. Each of them has the same reason for trading as they do. That makes for bigger price movements, and greater certainty in those price movements. And so a price rise or decline will tend to be stickier than is the case with general trading. I think that makes it less likely that a losing trade will turn profitable.

That’s my idea, at least. The next question is, what to do with it?

Over the past four months, trades lasting one day have been the big winners, with a 61.9% return. The return declines to 11.0% for two-day trades, bumps up to 24.5% for three-day trades, and sinks to a sad dismal 6.9% for five-day trades. (I had no four-day trades in the sample.)

The return for positions held more than 10 days was 1.5% on average, and more than 20 days, a loss of 0.1%. The four trades kept more than 30 days produced a loss of 0.5%.

And of course those losing trades kept money tied up that could have been used for other trades.

The Solution

So, yes, the methodology I’ve used up to now has worked. But I think it can be made better. My goal will be to get out of my earnings plays quickly, win or lose. Here’s how I plan to do it.

For any position:

  • First day after entry: Exit at 25% of maximum potential profit or higher.
  • Second day: Exit at any profit, no matter how small.
  • Third day: Exit, loss or profit.

That ensures quick turnover and therefore a more efficient use of my trading funds. And so, I think it will improve the overall profit.

My plan is to use this method through July, and then assess the results.

I’ve updated my Earnings Plays rules in the Trading Rules dropdown on the menu. Here’s the new version:

Earnings Plays Trading Rules

  • Enter a position on the final trading day before the earnings announcement.
  • Select highly liquid stocks with options having an implied volatility rank of 30% or higher.
  • Select liquid monthly options.
  • Pick a direction for the expected move. There are many ways to do this. I use stock analyst opinion as tracked by Zacks Investment Research out of Chicago.
    • My method: I choose stocks with a Zacks Rank, a longer term measure, that’s 1 or 2 for a bullish trade, or 4 or 5 for bearish. A 3 rank means hold and so is neutral and I avoid it. I also use the Zacks Expected Surprise Prediction (ESP), which relies on analysts changing their evaluation shortly before earnings. It is stated as a percentage, positive for bullish and negative for bearish.  Zacks says that the tool is 70% accurate positive surprises, less for negative surprises. 
    • Other methods: Since traders bid the price of a stock up or down prior to earnings, a momentum indicator such as the RSI or MACD or Bollinger Bands can also be used as directional indicators, as can fundamental analysis or looking directly at analyst assessments
  • Directional strategies: For lower risk (and lower returns), use short bull put spreads if a rise is expected, short bear call spreads if a fall is expected. For higher risk (and higher returns), short puts if a rise is expected, short calls if a fall is expected.
  • If the stock has no clear directional bias, avoid the trade.
  • The short strikes for each strategy ideally will placed be far enough out of the money to enclose the expected move. However, I will sometimes move closer in to improve the risk/reward ratio.

The expected move is calculated by taking the value of three positions and weighting them according to their distance from the at-the-money (ATM) mark.

  1. Using the options closest to expiration…
  2. take the price of an ATM short straddle and multiply it by 60% (0.6)…
  3. take the price of strangle one strike price away from ATM, and multiply it by 30% (0.3)…
  4. and take the price of a strange two strikes away from ATM, and multiply it by 10% (0.1).
  5. The expected move is the average of the weighted prices — add them together and divide by 3.
  6. Note that the expected move doesn’t anticipate the direction of the move — could be up, could be down.

By Tim Bovee, Portland, Oregon, May 1, 202

Disclaimer

Tim Bovee, Private Trader tracks the analysis and trades of a private trader for his own accounts. Nothing in this blog constitutes a recommendation to buy or sell stocks, options or any other financial instrument. The only purpose of this blog is to provide education and entertainment.

No trader is ever 100 percent successful in his or her trades. Trading in the stock and option markets is risky and uncertain. Each trader must make trading decisions for his or her own account, and take responsibility for the consequences.

License
Creative Commons License

All content on Tim Bovee, Private Trader by Timothy K. Bovee is licensed under a Creative Commons Attribution-ShareAlike 4.0 International License.

Based on a work at www.timbovee.com.

Trader’s Notebook

4 p.m. New York time

PHM earnings play exit. I’ve exited my short bear call spread on PHM two days after entry for 6.2% of maximum potential profit and have updated the trade analysis with results.

3:45 p.m. New York time

KO earnings play exit. I’ve exited my short bull put spread on KO seven days after entry for 39.2% of maximum potential loss and have updated the trade analysis with results. This exit is under a new rapid turnover tactic that I’m trying out and that I will describe in detail in a post this weekend.

3:30 p.m. New York time

Half an hour before the closing bell. The S&P 500 fell throughout the session, reaching a low so far of 4145.50 on the futures, slightly above where the rise began, from 4136.75. The initial rise, to a peak of 4303.50, was wave A{-10} within the upward correction, wave 2{-9}. The subsequent decline was wave B{-10}. It will be followed by a wave C{-10} rise that will likely move higher than the wave A{-10} did. No change in the analysis. I’ve updated the chart below.

1:15 p.m. New York time

LW earnings play exit. I’ve exited my short bear call vertical spread on LW, 21 days before expiration, for 89% of maximum loss and have posted updated the trade analysis with results.

10:35 a.m. New York time

UAL earnings play exit. I’ve exited my short bear call vertical spread on UAL for 73% of maximum potential loss, managing the position 21 days before expiration, my normal management date. I structured the position in expectation of a decline after earnings were announced. The price rose instead. I’ve updated the trade analysis with results.

9:35 a.m. New York time

What’s happening now? The S&P 500 E-mini futures rose to 4303.50 in overnight trading and then fell back slightly.

What does it mean? The upward correction that began on April 26 continues, taking back some of the decline that began on April 21 from 4509. The overnight rise briefly pierced the 38.2% Fibonacci retracement level before retreating.

What’s the alternative? The upward correction could be larger than my principal analysis would have it, retracing a portion of the decline that began on January 4 from 4808.25. The high the price rises, the more like the alternative scenario becomes.

[S&P 500 E-mini futures at 3:30 p.m., 75-minute bars, with volume]

What does Elliott wave theory say? I’ve placed a Fibonacci retracement ladder on the chart to better track the progress of the correction. To avoid confusion, I’ve changed the two parallel lines that are the price channel for wave 1{-6} from red lines to dotted black lines.

Under my principal analysis, the upward correction, wave 2{-9}, continues retracing a portion of the wave 1{-9} decline, which began on April 21. The correction began on April 26.

Under my secondary analysis, April 26 was the beginning of a far larger correction, wave 2{-6}, retracing a portion of the decline that began on January 6.

A 2nd wave typically will take the form of a Zigzag, and there’s one firm rule that applies to a 2nd wave correction: It never moves beyond the start of the preceding 1st wave Wave 1{-9} began on April 21 from 4509, and that’s the ceiling for the present wave 2{-9}. If the price does move above that level, then the analysis doesn’t match the chart and must be revised.

Within wave 2{-9}, the rise that began April 26 from 4136.75 is wave A{-10}. Since the corrective pattern is a Zigzag, the A wave will have five waves internally, followed by a B wave back down, usually with three waves internally, and finally a C wave back up, with five waves usually carrying the price to new heights within the correction. Wave B can follow one of several different patterns. If wave B is a Zigzag, which it seems to usually be in charts I’ve worked with, then it will retrace roughly 50% to 80% of the preceding A wave.

Once wave C has ended, then things get interesting. Most often the end of that C will be will the end of the parent 2nd wave, and a 3rd wave will begin, taking the price below the end of the preceding 1st wave — 4136.75 in the case of wave 1{-9} — and perhaps significantly below that level. Alternatively, the 2nd wave can trace through a separator wave, called an X wave, and then go through a second corrective pattern in a compound correction. Some compound structures will contain three corrective patterns.

Under the alternative scenario, the analysis is the same, except the maximum price of the correction is higher than under the principal analysis. Under the alternative, the wave 2{-6} correction must remain below 4808.25, the start of wave 1{-6}.

We Are Here.

These are the waves currently in progress under my principal analysis. Each line on the list shows the wave number, with the subscript in curly brackets, the traditional degree name, the starting date, the starting price of the S&P 500 E-mini futures, and the direction of the wave.

  • Index:
  • 5{0} Intermediate, 12/26/2018, 2346.58 (up)
  • 4{-1} Minor, 1/4/2022 4818.62 (down)
  • 1{-2} Minute, 1/4/2022 4818.62 (down)
  • Futures and index:
  • 1{-3} Minuette, 1/4/2022, 4808.25 (down) (futures), 4818.62 (down) (index)
  • Futures:
  • 1{-4} Subminuette, 1/4/2022, 4808.25 (down)
  • 1{-5} Micro, 1/4/2022, 4808.25 (down)
  • 1{-6} Submicro, 1/4/2022, 4808.25 (down)
  • 5{-7} Minuscule, 3/29/2022, 4631 (down)
  • 5{-8} Subminuscule, 4/21/2022, 4509, (down)

Learning and other resources. Elliott wave analysis provides context, not prophecy. As the 20th century semanticist Alfred Korzybski put it in his book Science and Sanity (1933), “The map is not the territory … The only usefulness of a map depends on similarity of structure between the empirical world and the map.” And I would add, in the ever-changing markets, we can judge that similarity of structure only after the fact.

See the menu page Analytical Methods for a rundown on where to go for information on Elliott wave analysis.

By Tim Bovee, Portland, Oregon, April 29, 2022

Disclaimer

Tim Bovee, Private Trader tracks the analysis and trades of a private trader for his own accounts. Nothing in this blog constitutes a recommendation to buy or sell stocks, options or any other financial instrument. The only purpose of this blog is to provide education and entertainment.

No trader is ever 100 percent successful in his or her trades. Trading in the stock and option markets is risky and uncertain. Each trader must make trading decisions for his or her own account, and take responsibility for the consequences.

License
Creative Commons License

All content on Tim Bovee, Private Trader by Timothy K. Bovee is licensed under a Creative Commons Attribution-ShareAlike 4.0 International License.

Based on a work at www.timbovee.com.

GILD Trade

Gilead Sciences Inc. (GILD)

Update 5/4/2022: I exited my short bull put vertical spread on GILD, 45 days before expiration, for a $1.66 debit per contract/share, a loss before fees of $27 per contract. Shares were trading at $60.17, down $1.22 from the entry level.

The Implied Volatility Rank at exit was 36.8, down eight points from the entry level.

I exited on the third trading day after entry for 44.9% of maximum loss as the position reached failed to become profitable. This is part of a new exit rule system that put into place, explained in my post “Earnings Plays: A Change in Method“.

Shares declined by 2.0% over five days for a -145% annual rate. The options position produced a 16.3% loss for a -1,187% annual rate.


I have entered a short bull put options spread on GILD, using options that trade for the last time 50 days hence, on June 17. The premium is a $1.39 credit per contract share and the stock at the time of entry was priced at $61.39.

The Implied Volatility Ratio stood at 44.8%.

Premium:$1.39Expire OTM
GILD-bull put spreadStrikeOddsDelta
Puts
Long55.0078.0%18
Break-even61.3966.0%29
Short60.0054.0%40

The premium is 55.6% of the width of the position’s short/long spread. The profit zone covers a no move to the downside and an unlimited move to the upside.

The risk/reward ratio is 2.6:1, with maximum risk of $361 and maximum reward of $139 per contract.

How I chose the trade. The trade was placed to coincide with GILD’s earnings announcement, after the closing bell on the day of entry. In placing the trade I considered the expected move of $1.80 either way, based on options pricing, which gives a price range of $59.59 to $63.19.

By Tim Bovee, Portland, Oregon, April 28, 2022

Disclaimer

Tim Bovee, Private Trader tracks the analysis and trades of a private trader for his own accounts. Nothing in this blog constitutes a recommendation to buy or sell stocks, options or any other financial instrument. The only purpose of this blog is to provide education and entertainment.

No trader is ever 100 percent successful in his or her trades. Trading in the stock and option markets is risky and uncertain. Each trader must make trading decisions for his or her own account, and take responsibility for the consequences.

License
Creative Commons License

All content on Tim Bovee, Private Trader by Timothy K. Bovee is licensed under a Creative Commons Attribution-ShareAlike 4.0 International License.

Based on a work at www.timbovee.com.

Trader’s Notebook

3:30 p.m. New York time

Half an hour before the closing bell. The S&P 500 has risen during the session, exceeding 4300 on both the index and the futures. The upward correction that began on April 26 from 4136.75 on the futures — wave 2{-9} — is underway. This morning’s second alternative was that downtrending wave 1{-9} is still underway and the present rise is a lower degree correction; the higher the present rise goes, the less likely that second alternative becomes. I’d say it’s chances are fading fast. I’ve updated the chart below.

12:55 p.m. New York time

GILD earnings play entry. I’ve entered a short bull put optIons spread on GILD, timed to coincide with the company’s earnings announcement, and have posted an analysis of the trade.

9:35 a.m. New York time

What’s happening now? The S&P 500 E-mini futures price continued to work its way higher overnight, reaching a high of 4258.75.

What does it mean? The upward correction that began on April 26 is still underway, taking back some of the downtrend that began on April 21.

What’s the alternative? It’s possible that the correction is larger than I have labeled it and will take back a portion of the decline that began on January 4.

It’s also possible that the decline that began on April 21 has not yet ended and no correction has begun.

It is a very ambiguous chart.

[S&P 500 E-mini futures at 3:30 p.m., 75-minute bars, with volume]

What does Elliott wave theory say? Under my principal analysis, wave 1{-9} ended on April 26 and wave 2{-9} began, retracing part of the decline that began from 4509.

Under my first alternative analysis, wave 5{-8}, which began on April 21, ended on on April 26, also triggering the end of parent waves 5{-7}, which began on March 29, and 1{-6}, which, as noted above, ended on January 4. In this case, wave 2{-6} is underway and will retrace part of the decline that began from 4808.25 — a much bigger correction.

Under my second alternative analysis, wave 1{-9} within wave 5{-8} within wave 5{-7} within wave 1{-6} is still underway — downtrends all the way down the list.

The red lines on the chart are the price channel of wave downtrending 1{-7}.

We Are Here.

These are the waves currently in progress under my principal analysis. Each line on the list shows the wave number, with the subscript in curly brackets, the traditional degree name, the starting date, the starting price of the S&P 500 E-mini futures, and the direction of the wave.

  • Index:
  • 5{0} Intermediate, 12/26/2018, 2346.58 (up)
  • 4{-1} Minor, 1/4/2022 4818.62 (down)
  • 1{-2} Minute, 1/4/2022 4818.62 (down)
  • Futures and index:
  • 1{-3} Minuette, 1/4/2022, 4808.25 (down) (futures), 4818.62 (down) (index)
  • Futures:
  • 1{-4} Subminuette, 1/4/2022, 4808.25 (down)
  • 1{-5} Micro, 1/4/2022, 4808.25 (down)
  • 1{-6} Submicro, 1/4/2022, 4808.25 (down)
  • 5{-7} Minuscule, 3/29/2022, 4631 (down)
  • 5{-8} Subminuscule, 4/21/2022, 4509, (down)

Learning and other resources. Elliott wave analysis provides context, not prophecy. As the 20th century semanticist Alfred Korzybski put it in his book Science and Sanity (1933), “The map is not the territory … The only usefulness of a map depends on similarity of structure between the empirical world and the map.” And I would add, in the ever-changing markets, we can judge that similarity of structure only after the fact.

See the menu page Analytical Methods for a rundown on where to go for information on Elliott wave analysis.

By Tim Bovee, Portland, Oregon, April 28, 2022

Disclaimer

Tim Bovee, Private Trader tracks the analysis and trades of a private trader for his own accounts. Nothing in this blog constitutes a recommendation to buy or sell stocks, options or any other financial instrument. The only purpose of this blog is to provide education and entertainment.

No trader is ever 100 percent successful in his or her trades. Trading in the stock and option markets is risky and uncertain. Each trader must make trading decisions for his or her own account, and take responsibility for the consequences.

License
Creative Commons License

All content on Tim Bovee, Private Trader by Timothy K. Bovee is licensed under a Creative Commons Attribution-ShareAlike 4.0 International License.

Based on a work at www.timbovee.com.

PHM Trade

PulteGroup Inc. (PHM)

Update 4/29/2022: I exited my short bear call vertical spread on PHM, 50 days before expiration, for a $1.06 debit per contract/share, a profit before fees of $7 per contract. Shares were trading at $42.13, down $0.24 from the entry level.

The Implied Volatility Rank at exit was 50.8%, down 17.5 points from the entry level.

I exited because the position was minimally profitable, two days after entry. Rather than risking a possible loss, I decided to free up the funds for future trades.

Shares declined by 0.6% over two days for a -103% annual rate. The options position produced a 6.6% return for a +1,205% annual rate.


I have entered a short bear call options spread on PHM, using options that trade for the last time 51 days hence, on June 17. The premium is a $1.13 credit per contract share and the stock at the time of entry was priced at $42.37.

The Implied Volatility Ratio stood at 68.3%.

Premium:$1.13Expire OTM
PHM-bear call spreadStrikeOddsDelta
Calls
Long50.0086.0%20
Break-even46.1377.0%31
Short45.0068.0%42

The premium is 45.2% of the width of the position’s short/long spread. The profit zone covers an 8.9% move to the upside and an unlimited move to the downside.

The risk/reward ratio is 3.4:1, with maximum risk of $387 and maximum reward of $113 per contract.

How I chose the trade. The trade was placed to coincide with PHM’s earnings announcement, before the opening bell on the day after entry. The short strikes were set to coincide with the expected move of $3.33 either way, based on options pricing, which gives a price range of $39.49 to $46.15.

By Tim Bovee, Portland, Oregon, April 27, 2022

Disclaimer

Tim Bovee, Private Trader tracks the analysis and trades of a private trader for his own accounts. Nothing in this blog constitutes a recommendation to buy or sell stocks, options or any other financial instrument. The only purpose of this blog is to provide education and entertainment.

No trader is ever 100 percent successful in his or her trades. Trading in the stock and option markets is risky and uncertain. Each trader must make trading decisions for his or her own account, and take responsibility for the consequences.

License
Creative Commons License

All content on Tim Bovee, Private Trader by Timothy K. Bovee is licensed under a Creative Commons Attribution-ShareAlike 4.0 International License.

Based on a work at www.timbovee.com.

Trader’s Notebook

3:30 p.m. New York time

Half an hour before the closing bell. The S&P 500 has continued to rise during the session, with small pullbacks along the way, reaching a high today of 4236.25 on the futures. No change in my analysis. An upward correction, wave 2{-9}, continues. In this morning’s analysis I said there was no way to choose between the principal analysis and the first alternative analysis, and that remains true as the session approaches its end. I’ve updated the chart.

12:55 p.m. New York time

PHM earnings play entry. I’ve entered a short bear call vertical spread on PHM and have posted a trade analysis.

12:45 p.m. New Yorktime

GM earnings play exit. I’ve exited my short bear call options spread on GM for 25% of maximum potential profit and have updated the trade analysis with results.

9:35 a.m. New York time

What’s happening now? The S&P 500 E-mini futures rose in overnight trading after Tuesday’s low touched the lower boundary of the price channel (the red lines on the chart) tracking the decline that began January 4.

What does it mean? The length of the decline on Tuesday suggests that the April 25 low wasn’t the end of the first leg of the decline that began on April 21, and I have moved that end point to Tuesday’s low. From that point an upward correction began and is still an an early stage.

What’s the alternative? There is huge ambiguity on this chart regarding the proper position of the decline from April 21 in the hierarchy of waves, what some call the fractal structure of stock price movements, where small movements and large movements all have the same structure. More on this in the Elliott wave theory section, below.

Or, another alternative: The decline may still be underway.

[S&P 500 E-mini futures at 3:30 p.m., hourly bars, with volume]

What does Elliott wave theory say? Under my principal analysis, I’ve retained yesterday’s view of the chart, aside from moving the end of wave 1{-9} to yesterday’s low, which is almost perfectly at the lower boundary of the wave 5{-7} price channel, two degrees larger.

But is that low the end of wave 1{-9}, or, as an alternative analysis, is it the end of the parent wave 5{-8}? Based on this chart, at this moment in time, there is no way to choose between the two.

I’ll begin with a caveat. Price channels mark tendencies, not mandates. Prices break through boundaries often. Nonetheless, they also, quite often, respect price channel boundaries.

The under the price channel for wave 1{-6}, the lower boundary marks the likely end of wave 5{-7}, which began on March 29, and the end also of the child wave 5{-8}, which began on April 21. And when 5{-7} ends, that’s also the end of wave 1{-6}, which began on January 4 from 4808.25.

What’s at stake with those two scenarios is the magnitude of the upward correction. Under the principal analysis, the correction is a fairly small wave 2{-9}, likely carrying the price back into the 4300s. Under the alternative analysis, it is a large wave 2{-6}, carrying the price perhaps into the 4600s or even the 4700s.

And as a second alternative, yesterday’s low may not be the end of wave 1{-9} under the principal analysis or wave 5{-8} under the first alternative, but instead may be a pause as the decline continues.

So in a conservative manner, I’ve retained yesterday’s scenario but will be quite willing to change the scenario depending upon how the price moves. A small wave A within the upward correction would suggest that the principal analysis is correct; a large wave A, that the first alternative analysis is correct; and a quick reversal and decline would suggest the second alternative is correct.

We Are Here.

These are the waves currently in progress under my principal analysis. Each line on the list shows the wave number, with the subscript in curly brackets, the traditional degree name, the starting date, the starting price of the S&P 500 E-mini futures, and the direction of the wave.

  • Index:
  • 5{0} Intermediate, 12/26/2018, 2346.58 (up)
  • 4{-1} Minor, 1/4/2022 4818.62 (down)
  • 1{-2} Minute, 1/4/2022 4818.62 (down)
  • Futures and index:
  • 1{-3} Minuette, 1/4/2022, 4808.25 (down) (futures), 4818.62 (down) (index)
  • Futures:
  • 1{-4} Subminuette, 1/4/2022, 4808.25 (down)
  • 1{-5} Micro, 1/4/2022, 4808.25 (down)
  • 1{-6} Submicro, 1/4/2022, 4808.25 (down)
  • 5{-7} Minuscule, 3/29/2022, 4631 (down)
  • 5{-8} Subminuscule, 4/21/2022, 4509, (down)

Learning and other resources. Elliott wave analysis provides context, not prophecy. As the 20th century semanticist Alfred Korzybski put it in his book Science and Sanity (1933), “The map is not the territory … The only usefulness of a map depends on similarity of structure between the empirical world and the map.” And I would add, in the ever-changing markets, we can judge that similarity of structure only after the fact.

See the menu page Analytical Methods for a rundown on where to go for information on Elliott wave analysis.

By Tim Bovee, Portland, Oregon, April 27, 2022

Disclaimer

Tim Bovee, Private Trader tracks the analysis and trades of a private trader for his own accounts. Nothing in this blog constitutes a recommendation to buy or sell stocks, options or any other financial instrument. The only purpose of this blog is to provide education and entertainment.

No trader is ever 100 percent successful in his or her trades. Trading in the stock and option markets is risky and uncertain. Each trader must make trading decisions for his or her own account, and take responsibility for the consequences.

License
Creative Commons License

All content on Tim Bovee, Private Trader by Timothy K. Bovee is licensed under a Creative Commons Attribution-ShareAlike 4.0 International License.

Based on a work at www.timbovee.com.

GM Trade

General Motors Co. (GM)

Lot 2022-2

Update 4/27/2022: I exited my short bear fall vertical spread on GM, 51 days before expiration, for a $1.01 debit per contract/share, a profit before fees of $54 per contract. Shares were trading at $38.01, down $1.19 from the entry level.

The Implied Volatility Rank at exit was 89.4, up 17.8 points from the entry level.

I exited because the position reached 25% of maximum potential profit, my normal exit point for earnings plays.

Shares fell by 3.0% over one day for a -1,108% annual rate. The options position produced a 32.7% return for a +11,926% annual rate.


I have entered a short bear call vertical spread on GM, using options that trade for the last time 52 days hence, on June 17. The premium is a $1.34 credit per contract share and the stock at the time of entry was priced at $39.20.

The Implied Volatility Ratio stood at 71.6%.

Premium:$1.34Expire OTM
GM-bear call spreadStrikeOddsDelta
Calls
Long46.0085.0%20
Break-even42.3474.5%31.5
Short41.0064.0%43

The premium is 53.6% of the width of the position’s short/long spread. The profit zone covers an 8% move to the upside and an unlimited move to the downside.

The risk/reward ratio is 2.7:1, with maximum risk of $366 and maximum reward of $134 per contract.

How I chose the trade. The trade was placed to coincide with GM’s earnings announcement, after the closing bell on the day of entry. The short strikes were set to coincide with the expected move of $2.14 either way, based on options pricing, which gives a price range of $37.06 to $41.34.

By Tim Bovee, Portland, Oregon, April 26, 2022

Disclaimer

Tim Bovee, Private Trader tracks the analysis and trades of a private trader for his own accounts. Nothing in this blog constitutes a recommendation to buy or sell stocks, options or any other financial instrument. The only purpose of this blog is to provide education and entertainment.

No trader is ever 100 percent successful in his or her trades. Trading in the stock and option markets is risky and uncertain. Each trader must make trading decisions for his or her own account, and take responsibility for the consequences.

License
Creative Commons License

All content on Tim Bovee, Private Trader by Timothy K. Bovee is licensed under a Creative Commons Attribution-ShareAlike 4.0 International License.

Based on a work at www.timbovee.com.

Trader’s Notebook

3:30 p.m. New York time

Half an hour before the closing bell. The S&P 500 fell during the session, moving below Monday’s low of 4195.25. Under my principal analysis, wave A{-10} within wave 2{-9} continues.

10:55 a.m. New York time

GM earnings play entry. I’ve entered a short bear call options spread on GM and have posted a trade analysis.

10:45 a.m. New York time

GE earnings play exit. I’ve exited my short bear call options spread on GE for 28.7% of maximum potential profit and have updated the trade analysis with results.

9:35 a.m. New York time

What’s happening now? The S&P 500 E-mini futures rose in overnight trading to 4303.50, which is 108.25 points above Monday’s low. The price then declined slightly.

What does it mean? A low level upward correction is now underway, within the downtrend that began on April 21. When the correction is complete, the downtrend will resume, reaching prices below yesterday’s reversal point.

What’s the alternative? As is often the case, there is ambiguity as to the size of the correction in comparison with the decline that has occurred so far since April 21. It could be one level smaller.

[S&P 500 E-mini futures at 3:30 p.m., hourly bars, with volume]

What does Elliott wave theory say? Under my principal analysis, the overnight rise is wave A{-10} within wave 2{-9}, both within declining wave 5{-8} within wave 5{-7} with wave 1{-6}, the largest degree in the list, the 1st wave, having begun on January 4 from 48087.25.

The red lines on the chart are the price channel for wave 1{-6}, connecting the 2nd and 4th wave peaks of the subwaves, with a parallel line through the 2nd wave low.

We Are Here.

These are the waves currently in progress under my principal analysis. Each line on the list shows the wave number, with the subscript in curly brackets, the traditional degree name, the starting date, the starting price of the S&P 500 E-mini futures, and the direction of the wave.

  • Index:
  • 5{0} Intermediate, 12/26/2018, 2346.58 (up)
  • 4{-1} Minor, 1/4/2022 4818.62 (down)
  • 1{-2} Minute, 1/4/2022 4818.62 (down)
  • Futures and index:
  • 1{-3} Minuette, 1/4/2022, 4808.25 (down) (futures), 4818.62 (down) (index)
  • Futures:
  • 1{-4} Subminuette, 1/4/2022, 4808.25 (down)
  • 1{-5} Micro, 1/4/2022, 4808.25 (down)
  • 1{-6} Submicro, 1/4/2022, 4808.25 (down)
  • 5{-7} Minuscule, 3/29/2022, 4631 (down)
  • 5{-8} Subminuscule, 4/21/2022, 4509, (down)

Learning and other resources. Elliott wave analysis provides context, not prophecy. As the 20th century semanticist Alfred Korzybski put it in his book Science and Sanity (1933), “The map is not the territory … The only usefulness of a map depends on similarity of structure between the empirical world and the map.” And I would add, in the ever-changing markets, we can judge that similarity of structure only after the fact.

See the menu page Analytical Methods for a rundown on where to go for information on Elliott wave analysis.

By Tim Bovee, Portland, Oregon, April 26, 2022

Disclaimer

Tim Bovee, Private Trader tracks the analysis and trades of a private trader for his own accounts. Nothing in this blog constitutes a recommendation to buy or sell stocks, options or any other financial instrument. The only purpose of this blog is to provide education and entertainment.

No trader is ever 100 percent successful in his or her trades. Trading in the stock and option markets is risky and uncertain. Each trader must make trading decisions for his or her own account, and take responsibility for the consequences.

License
Creative Commons License

All content on Tim Bovee, Private Trader by Timothy K. Bovee is licensed under a Creative Commons Attribution-ShareAlike 4.0 International License.

Based on a work at www.timbovee.com.

GE Trade

General Electric Co. (GE)

Lot 2022-2

Update 4/26/2022: I exited my short bear call vertical spread on GE, 52 days before expiration, for a $1.29 debit per contract/share, a profit before fees of $52 per contract. Shares were trading at $83.24, down $4.05 from the entry level.

The Implied Volatility Rank at exit was 61.8%, down 14.3 points from the entry level.

I exited because the position reached 28.7% of maximum potential profit, a few points beyond my normal exit point for earnings plays, 25% of max.

Shares fell by 4.6% over one day for a -1,694% annual rate. The options position produced a 40.3% return for a +14,713% annual rate.


I have entered a short bear call vertical spread on GE, using options that trade for the last time 53 days hence, on June 17. The premium is a $1.81 credit per contract share and the stock at the time of entry was priced at $87.29.

The Implied Volatility Ratio stood at 76.1%.

Premium:$1.81Expire OTM
GE-bear call spreadStrikeOddsDelta
Calls
Long95.0085.0%31
Break-even91.8173.0%38
Short90.0061.0%45

The premium is 72.4% of the width of the position’s short/long spread. The profit zone covers a 5.2% move to the upside and an unlimited move to the downside.

The risk/reward ratio is 1.8:1, with maximum risk of $319 and maximum reward of $181 per contract.

How I chose the trade. The trade was placed to coincide with GE’s earnings announcement, before the opening bell on the day after entry. The short strikes were set to coincide with the expected move of $4.28 either way, based on options pricing, which gives a price range of $82.93 to $91.49. I skewed the short call in the position toward the at-the-money mark in order to get a better risk/reward ratio.

By Tim Bovee, Portland, Oregon, April 25, 2022

Disclaimer

Tim Bovee, Private Trader tracks the analysis and trades of a private trader for his own accounts. Nothing in this blog constitutes a recommendation to buy or sell stocks, options or any other financial instrument. The only purpose of this blog is to provide education and entertainment.

No trader is ever 100 percent successful in his or her trades. Trading in the stock and option markets is risky and uncertain. Each trader must make trading decisions for his or her own account, and take responsibility for the consequences.

License
Creative Commons License

All content on Tim Bovee, Private Trader by Timothy K. Bovee is licensed under a Creative Commons Attribution-ShareAlike 4.0 International License.

Based on a work at www.timbovee.com.