Live: Wednesday, June 10, 2020

10:55 a.m. New York time

Why a recession? The easy answer to the question is, “Duh. Covid-19, Dummy.” But as is always true in the economy and in life generally, things aren’t always so simple.

Recessions in the U.S. are declared by the National Bureau of Economic Research, a private think-tank. In declaring on Monday that the U.S. has entered a recession in February, the NBER was only saying what everybody already knew.

But that’s only half the story. The NBER does two calculations, a monthly peak of economic activity, based on indicators that are published each month, and a quarterly peak, based on averages of monthly indicators with quarterly indicators added in.

And what’s the biggest quarterly indicator? GDP — the Gross Domestic Product. So while the monthly indicators but the peak of economic activity and the start of the recession in February, in the 1st quarter of this year, after Covid-19 had made its debut, the quarterly calculation places the peak in the 4th quarter of 2019, before Covid-19 had made the leap to humans and begun its rapid spread through the world population.

It means that we were in deep economic trouble, in a recession, before the pandemic began. Politicians will blame the recession on the coronavirus, I have no doubt, but the real cause lies elsewhere.

The conventional wisdom has been that since the pandemic caused the recession, control of Covid-19 will allow for a quick recovery. But if the recession began before Covid-19 existed in humans, then there’s no reason to think it will be any different than past recessions: A slow and painful limping toward recovery.

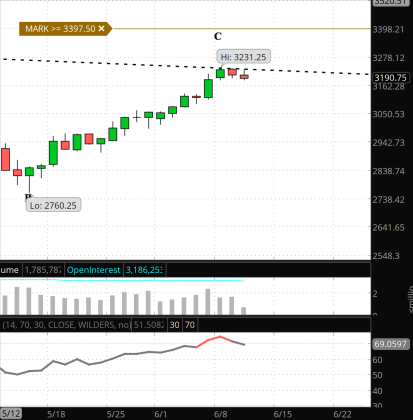
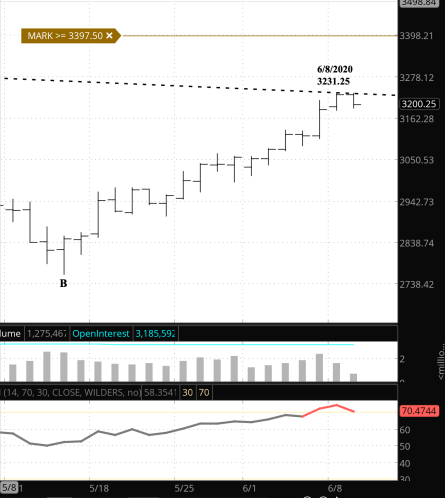
What’s happening now? The S&P 500 E-mini futures continue to hold near the level of their high two days ago, at 3231.25.

What does it mean? The analysis is unchanged from yesterday. A move above 3397.50 would force a complete rethinking of everything that has happened since February 19. The Relative Strength Indicators (RSI, at the bottom of the chart) has dropped below 70, which indicates that the market is ready to retreat from its overbought level.
Screen Shot 2020-06-10 at 7.33.30 AM
S&P 500 E-mini futures, daily chart

What does Elliott wave theory say? Monday’s peak by my count is (maybe) the end of Intermediate wave C within a Primary wave 2 upward correction. The next wave, Primary 3, will produce a significant decline.

What is the alternative? Two alternatives, really. The index could be still rising in Primary wave 2. Or what I’ve labelled as a major reversal of the rise over the past decades might in be a small correction that will be followed in short order by a resumption of the rise. Primary 2 could have some upside remaining. The second alternative, a minor downward correction rather than the start of a major downtrend, seems very unlikely to me. I don’t buy it.
Read More »

Live: Tuesday, June 9, 2020

10:30 a.m. New York time

What’s happening now? The S&P 500 E-mini futures peaked at the end of the trading yesterday, at 3231.25 and then declined slightly.

What does it mean? The peak was accompanied by a decline in volume — often a sign that a trend is weakening. Also, the Relative Strength Index (RSI) declined this morning, falling below the 70 mark that divides overbought territory from neutrality for the first time since January 22. RSI is a metric that compares the rising and falling days adjusted for the magnitude of each, and a fall back into neutrality often will presage a significant decline. Certainly the January move did. It has since risen a bit above the 70 mark, but the trend for the daily continues to point down.

Screen Shot 2020-06-09 at 7.24.38 AM
S&P 500 E-mini futures, daily bars, with volume and RSI

What does Elliott wave theory say? At the peak we were in the final wave, upward trending Intermediate wave C, of the Primary wave 2 upward correction of downtrending Cycle wave 1, which began on February 19 at 3397.50.

The question now is whether yesterday’s peak marks the end of Intermediate C. The wave has risen 17.1%, which compares favorably with the 19% rise of the prior C wave in this compound correction. And Primary wave 2 has retraced 86.4% of  Primary wave 2, about what I would expect from an energetic 2nd wave. Combined with the declining RSI and volume, the evidence makes it plausible, although not certain, that Primary wave 3 has begun.

What is the alternative? The index could certainly reverse and continue rising in a whipsaw of the sort not uncommon in the markets. If it does, then we continue to face the possibility that what is now counted as wave 2 will move beyond the start of wave 1, possibly negating the idea that the rise that began in 1974 is in fact not yet over. I discussed the prospect in detail in Monday’s post.

Read More »

Live: Monday, June 8, 2020

11:35 a.m. New York time

Little has changed from Friday’s analysis, and so I’m going to take a closer look at the alternative, which would kick in if the index rises above its high of February 19, which was 3397.50 on the E-mini futures. I said in Friday’s analysis that a break above that level would force a “rethinking of the entire analysis since February”. That raises the question, Is such an alternative even possible, within the rules of Elliott wave analysis? That’s the question I hope to answer this morning.

What’s happening now? The S&P 500 E-mini futures on Sunday set a higher high in the rise from March 22, at 3211.50, just one point above the prior high set on Friday.

What does it mean? There’s no clear indicator as to whether the correction of the decline from March is yet complete. So far the movement has retraced 84.8% of the decline.

What does Elliott wave theory say? The retracement is Primary wave 2 within Cycle wave 1, the early stages of a major decline that will eventually erase decades worth of market advance. It will have uptrends and downtrends within it, some of them quite significant, but the overall trend by this analysis will be down in a movement so large that the high school Class of 2020 will be grandparents before the major correction ends.

What is the alternative? If the Primary wave 2 price moves back above the beginning of Primary wave 1, the high set in February of 3397.50, then the whole major end-of-the-world-as-we-know-it crash gets tossed into the trash, and something else is going on. Is that even possible, given the devastating losses we’ve seen in a period that has stretched out to nearly four months?

Screen Shot 2020-06-08 at 8.08.08 AM
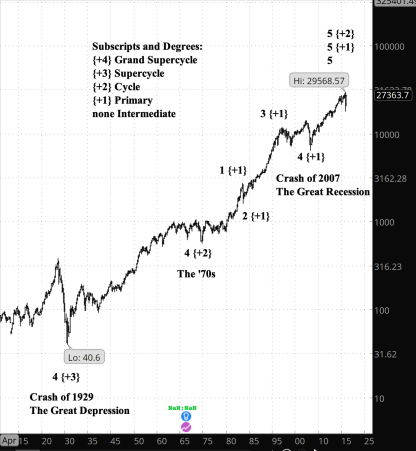
Dow Jones Industrial Average, weekly bars

It turns out that it is possible. The final leg up before the February crash began in 2009, at the low point of the Crash of 2007, which kicked off the Great Recession. On a chart of the Dow Jones Industrial Average, the decline so far is not outsized for a correction within Primary wave 5 of the rise since 2009. The Great Recession crash that ended a Primary wave 4 was bigger. The present decline so far has been in the ballpark of the Crash of ’87, a Primary wave 2 decline, or the downward corrections of the stagflation 1970s. And there’s sufficient ambiguity in the rise since 2009 to count the February peak a 3rd wave rather than a 5th, which would make the decline since February a Primary 4th wave correction.

If the hypothetical 4th wave correction is taking the form of an expanding triangle, then the B wave — the one we’re in now — would be expected to move above beginning of the A wave. The gotcha is that each of the five waves of the expanding triangle would have three subwaves, so I think it would take some creative wave counting to make this scenario work.

The sheer velocity, the power, of the decline in February steers me away from this alternative scenario. I’ll be shocked if the S&P 500 price exceeds 3397.50. But, as we near that point, it’s a possibility we must consider.

Read More »

Live: Friday, June 5, 2020

10:05 a.m. New York time

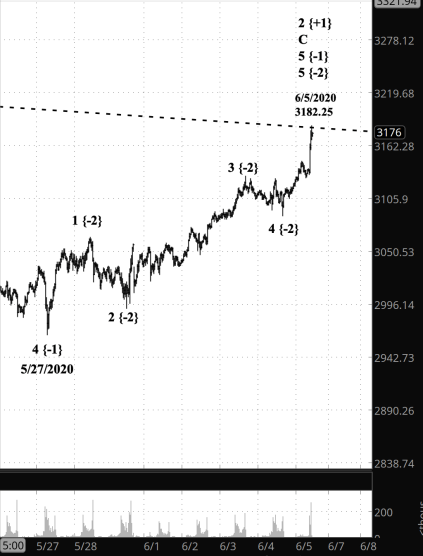
What’s happening now? The S&P 500 E-mini futures continue to make new highs, most recently at 3182.25 in the first half hour after the opening bell.

What does it mean? The final leg up of the upward correction that began on March 22 continues, having retraced more than 80% of the decline that began on February 19.

Screen Shot 2020-06-05 at 7.02.31 AM


What does Elliott wave theory say? The index is in Intermediate wave C within Primary wave 2, which is correcting the downward Cycle wave 1, the beginning of a very large decline. I’ve redone my count of the waves internal to C, and they show that C is in its 5th and final wave to the upside, beginning yesterday at the Minute degree within the 5th wave of the Minor degree, which began May 27.

Next move: Primary wave 3 to the downside, carrying the price below 2000.


What is the alternative? A push above 3397.50 would require a rethinking of the entire analysis since February 19. I don’t expect this to happen.

Read More »

Live: Thursday, June 4, 2020

10:40 a.m. New York time

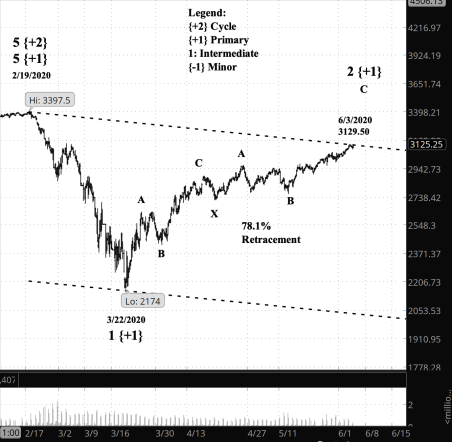
What’s happening now? The S&P 500 E-mini futures yesterday, throughout the day, kept bumping up high for the rise since March 22, pulling back after peaking at 3129.50. In the chart I’ve drawn the channel as though that peak were the end of correction to the upside, but the reality is that I can’t rule out a bit more upside remaining.

What does it mean? The rise has retraced 78.1% of the decline from February 19 to March 22. If there is a more rise remaining, it will be a fairly short movement, stopping short of 3397.50. If 3129.50 is indeed the peak of the rise, then the next move will be down. What I’ll be looking for is a drop that shows some commitment — the short of drop where you look at the chart and without analysis, say, Something has changed. A decline below 2760.25, where the present leg up of the correction, will increase the odds that the correction is over.

By the way, note the volume at the bottom of the chart, how much it has fallen off during the correction, a sign that the energy of the upward movement is fading.

Screen Shot 2020-06-04 at 7.36.08 AM

What does Elliott wave theory say? The meaning of the 3129.50 point depends upon how we interpret the internals of the wave that led to that peak: Intermediate wave C within the Primary wave 2 upward correction.

My count yesterday placed index nearing the end of Minute wave 3 within Intermediate C. If that’s correct then there will be a small pullback and then a final Minor wave 5 rise above that prior peak.

What is the alternative? I noted yesterday that I found the wave pattern to be somewhat ambiguous, and that the present position might be well Minor wave 5. If that’s the case, then 3129.50 could indeed mark the end of the Primary wave 2 correction. The resumption of the downtrend, Primary wave 3, will be energetic and without ambiguity as it pushes down to the lower boundary of the channel, almost certainly below 2000.

Read More »

Live: Wednesday, June 3, 2020

10:45 a.m. New York time

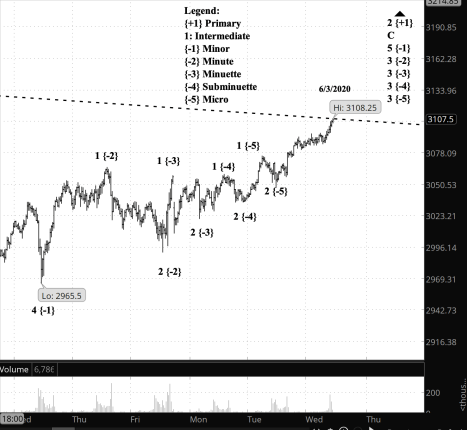
What’s happening now? The S&P 500 E-mini futures moved up to yet another higher high, 3108.25 so far, which is 32.75 points above the previous higher high set on Tuesday.

What does it mean? The upward correction that began March 22 continues. How close to complete it might be depends upon how we interpret the present leg up within that correction, which began May 27 at 2965.5

Screen Shot 2020-06-03 at 7.40.12 AM

What does Elliott wave theory say? How close the index is to a reversal depends upon how we count the waves internal to the rise from May 27, which is Minor wave 5. Within that wave, honestly, the structure is a bit messy, with ambiguities that are common to the paths traced by the markets.

I count our present positions as being:

  • Micro wave 3
  • of Subminuette 3
  • of Minuette 3
  • of Minute 3
  • of Minor 5
  • within Intermediate wave C
  • of the Primary wave 2 correction.

In other words, the middle wave of the Minor degree is stretching out quite bit. There are other ways of counting, but this one seems to best fit the form of the chart as of this moment. The sticking point is wave 3, which must never be the shortest of a five-wave impulse pattern. When a count shows it to be the shortest, then the count is wrong and standard practice is to move down a degree in order to make the 3rd wave length longer. This why Elliott wave analysis is more art than science.

Read More »

Live: Tuesday, June 2, 2020

10 a.m. New York time

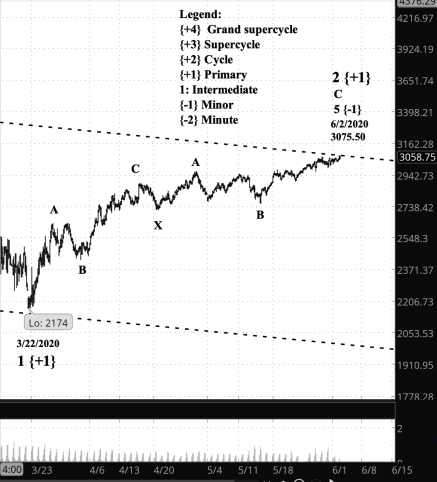
What’s happening now? Early this morning, before the opening bell, the S&P 500 E-mini futures exceeded its high of March 28 by 10 points, reaching 3075.50 before retreating a little.

What does it mean? The analysis is unchanged from yesterday. The final upward push of a correction to the decline that began February 19 is underway and nearing its end, or perhaps has already ended. I’ve drawn the channel on the chart based on the assumption that 3075.50 is the correction peak, but that’s not necessarily the case. It’s a what-if framing, not a certainty.

Screen Shot 2020-06-02 at 6.58.58 AM

What does Elliott wave theory say? By my count the final wave up of the correction, Intermediate wave C within Primary wave 2 within Cycle wave 1, began on May 14 and has covered 315.25 points, a rise of 11.4%. It has covered sufficient ground to be considered complete. When Primary 2 is done, it will be followed by a very significant decline, Primary wave 3.


Read More »

Live: Monday, June 1, 2020

9:45 a.m. New York time

What’s happening now? The S&P 500 E-mini futures remain below the May 28 peak of 3065.50.

What does it mean? The lack of a new high leaves open the possibility that the rise from March 22 is complete.

Screen Shot 2020-06-01 at 6.44.02 AM

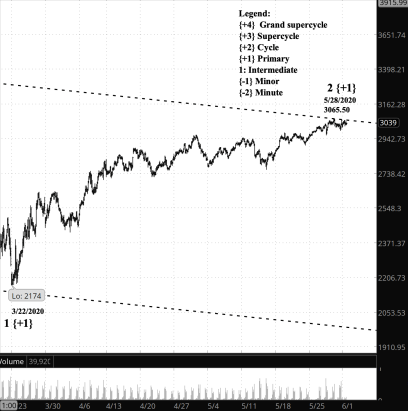
What does Elliott wave theory say? I’ve marked today’s chart showing a channel that assumes that the Primary wave 2 correction to the upside is complete. The price remains very close to the upper boundary of the channel but remans below it. If the correction is indeed over, the price will begin to fall down toward the lower boundary of the channel, which at present stands at 2000, more than 1,000 points below the present price.

What is the alternative? The channel’s upper boundary now stands at 3057, which is 24 points above the present price. So it’s a very short rise to the boundary, and if it is pierced, then it strengthens the case that Primary wave 2 is still in force, and there will be another movement to the upside before it reaches its conclusion.

What about my trades? No options are in my account at present. My shares in SDS profit when the S&P 500 goes down and lose when it rises. Now? Losing.

Learning and other resources. Elliott Wave International has long been the leading analytical house based on Elliott wave theory. They make available a number of free educational materials and other resources, in addition to their for-pay subscriptions.

I recommend two books, both by people associated with EWI.

First, Elliott Wave Principle by Robert Prechter and A.J. Frost is the book that, along with Prechter’s analyses, that created the revival of Elliott wave theory. I first read it in 1984, and it has had a profound influenced on my thinking about markets ever since.

Second, I’ve found Visual Guide to Elliott Wave Trading by Wayne Gorman and Jeffrey Kennedy, both of EWI, to be a useful book that relates Elliott wave theory to practical trading. The authors are hands-on Elliotticians, and for an active trader, that’s exactly what’s needed — less theory and more how-to. The first chapter of the book gives a very nice thumbnail run down of what Elliott wave theory is all about.

Terminology. Here are some links to information about some of the technical jargon I use.

Charts. On my charts, waves have a subscript showing the degree above or below the Intermediate degree. Here are the subscripts and the degree each represents:

  • {+3} Supercycle
  • {+2} Cycle
  • {+1} Primary
  • No subscript: Intermediate
  • {-1} Minor
  • {-2} Minute
  • {-3} Minuette

By Tim Bovee, Portland, Oregon, June 1, 2020

Disclaimer

Tim Bovee, Private Trader tracks the analysis and trades of a private trader for his own accounts. Nothing in this blog constitutes a recommendation to buy or sell stocks, options or any other financial instrument. The only purpose of this blog is to provide education and entertainment.

No trader is ever 100 percent successful in his or her trades. Trading in the stock and option markets is risky and uncertain. Each trader must make trading decisions for his or her own account, and take responsibility for the consequences.

License
Creative Commons License

All content on Tim Bovee, Private Trader by Timothy K. Bovee is licensed under a Creative Commons Attribution-ShareAlike 4.0 International License.

Based on a work at www.timbovee.com.

Live: Friday, May 29, 2020

9:40 a.m. New York time

What’s happening now? The S&P 500 E-mini futures retreated from yesterday’s peak of 3065.50.

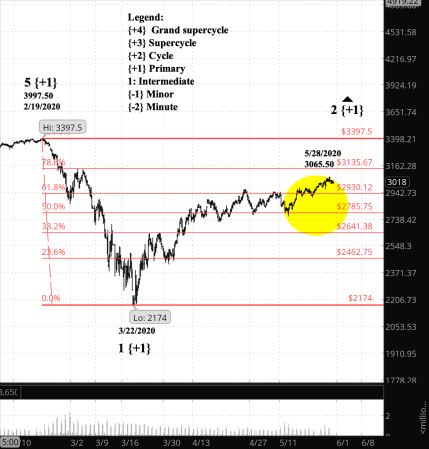
What does it mean? The price is approaching another Fibonacci stopping point, a 78.6% retracement of the decline from February 19 to March 22.

Screen Shot 2020-05-29 at 6.37.44 AM

What does Elliott wave theory say? I count the most recent push upward (highlighted in yellow) as a C wave showing a clear five waves to the upside. The 5th wave internal to wave C may not yet be complete, but it is nearing its end. There are two possibilities for what happens next: Either the end of wave C marks the end of Primary wave 2’s correction of the Primary wave 1 decline that began February 19, or the C wave will be followed by a wave down, an X wave, and then a third corrective pattern in the compound correction that is Primary 2.

Read More »

Live: Thursday, May 28, 2020

10:20 a.m. New York time

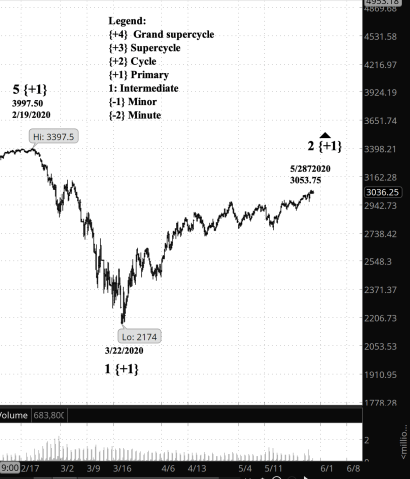
What’s happening now? The S&P 500 E-mini futures resumed their rise, peaking last night at 3053.75 before withdrawing slightly.

What does it mean? The correction that began March 22 is still under way, having risen 879.50 points in 58 days.

Screen Shot 2020-05-28 at 7.19.05 AM

What does Elliott wave theory say? The S&P 500 is in the 2nd wave upward correction of Primary degree within a 1st wave downward trend of Cycle. The rise last night means that among the options proposed in yesterday’s analysis for the subwaves of Primary 2 — 3rd wave or 5th wave — the 3rd wave hypothesis won.

What is the alternative? A move above 3997.50, the beginning of Cycle wave 1, would invalidate idea that the entire decline since February 19 is the beginning of a correction at degrees greater than Cycle.

What about my trades? No options are in my account at present. I’m waiting for Primary wave 3 to begin before entering. My shares in SDS profit when the S&P 500 goes down and loses when it rises. They are presently losing but since shares have no expiration so I intend to hold them through Primary 3.

Learning and other resources. Elliott Wave International has long been the leading analytical house based on Elliott wave theory. They make available a number of free educational materials and other resources, in addition to their for-pay subscriptions.

I recommend two books, both by people associated with EWI.

First, Elliott Wave Principle by Robert Prechter and A.J. Frost is the book that, along with Prechter’s analyses, that created the revival of Elliott wave theory. I first read it in 1984, and it has had a profound influenced on my thinking about markets ever since.

Second, I’ve found Visual Guide to Elliott Wave Trading by Wayne Gorman and Jeffrey Kennedy, both of EWI, to be a useful book that relates Elliott wave theory to practical trading. The authors are hands-on Elliotticians, and for an active trader, that’s exactly what’s needed — less theory and more how-to. The first chapter of the book gives a very nice thumbnail run down of what Elliott wave theory is all about.

Terminology. Here are some links to information about some of the technical jargon I use.

Charts. On my charts, waves have a subscript showing the degree above or below the Intermediate degree. Here are the subscripts and the degree each represents:

  • {+3} Supercycle
  • {+2} Cycle
  • {+1} Primary
  • No subscript: Intermediate
  • {-1} Minor
  • {-2} Minute
  • {-3} Minuette

By Tim Bovee, Portland, Oregon, May 28, 2020

Disclaimer

Tim Bovee, Private Trader tracks the analysis and trades of a private trader for his own accounts. Nothing in this blog constitutes a recommendation to buy or sell stocks, options or any other financial instrument. The only purpose of this blog is to provide education and entertainment.

No trader is ever 100 percent successful in his or her trades. Trading in the stock and option markets is risky and uncertain. Each trader must make trading decisions for his or her own account, and take responsibility for the consequences.

License
Creative Commons License

All content on Tim Bovee, Private Trader by Timothy K. Bovee is licensed under a Creative Commons Attribution-ShareAlike 4.0 International License.

Based on a work at www.timbovee.com.