Live: Thursday, May 14, 2020

3:45 p.m. New York time

I labelled the move up this morning as Minor degree; it could just as easily be one degree lower, at Minuette. Time will tell.

1:40 p.m. New York time

Minor wave 4 to the upside began at mid-morning from a low of 2760.25, rising 69.25 points so far, or 25%.

9:45 a.m. New York time

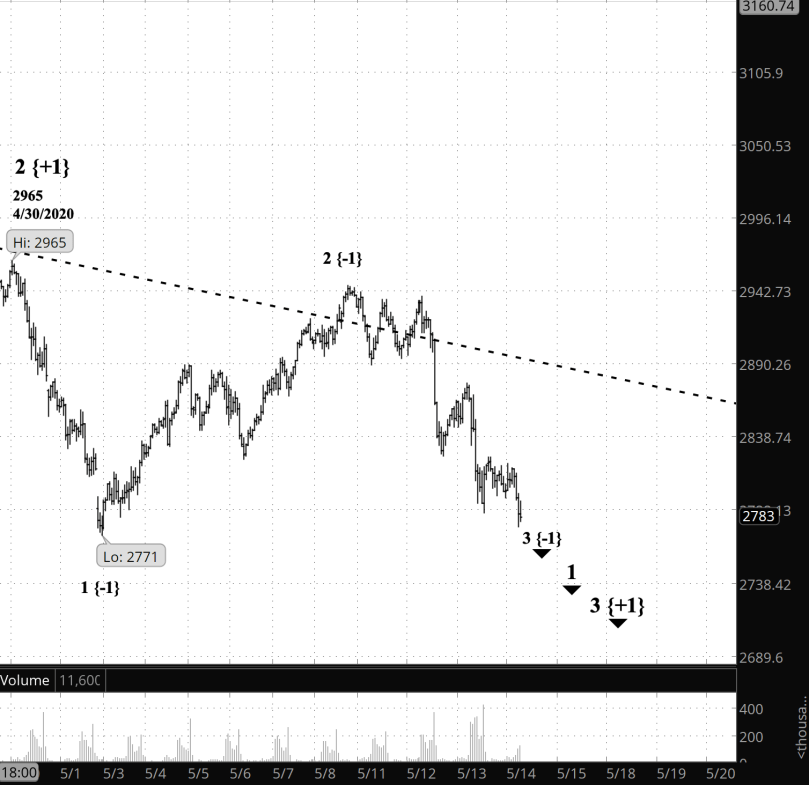
What’s happening now? The S&P 500 is continuing its decline that began April 30 from 2965. The low so far in the movement is 2777, about 45 minutes before the opening bell.

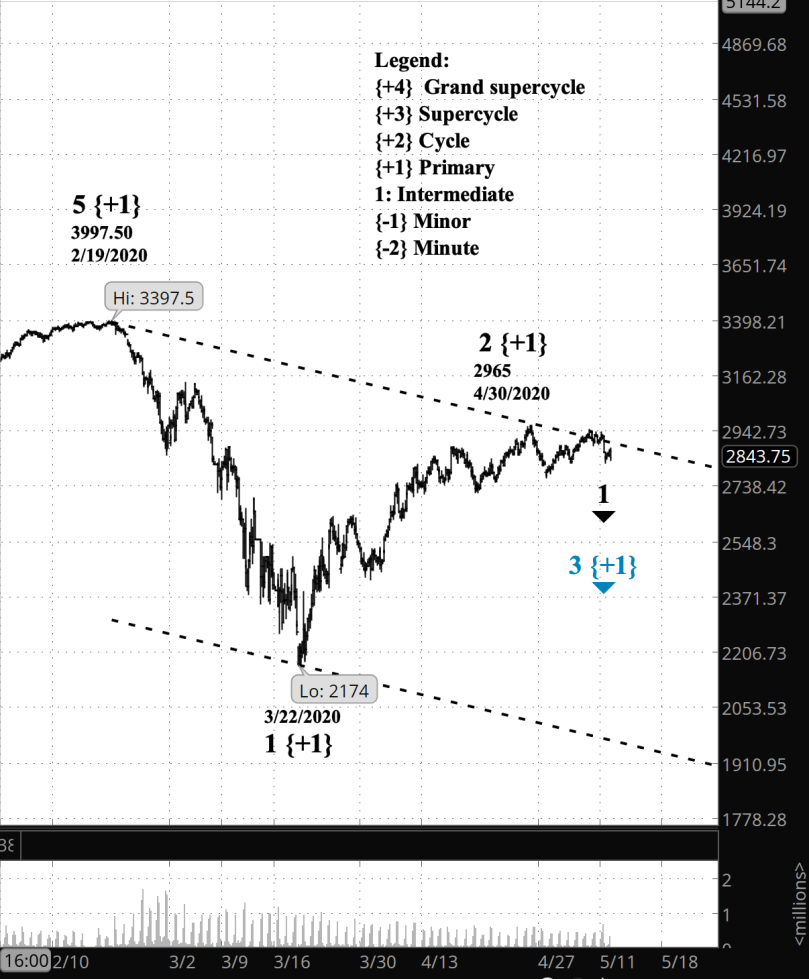
What does it mean? The decline so far has traced has only 188 points, down 6.3%, suggesting that it has much further to go. The current leg down is only 15% of the initial decline, from February 19 through March 22, and since the second leg down tends to be the most energetic, I would think that the bear market has miles to go before it sleeps (with a nod to the poet Robert Frost).
Screen Shot 2020-05-14 at 6.39.31 AM

What does Elliott wave theory say? The index continues to be in the Minor 3rd wave within the Intermediate 1st of the Primary 3rd, making it the middle of the present leg down within the Intermediate degree. There’s no set length for the duration of a wave at any degree. The way I think it: For Intermediate, think days to weeks, and for Primary, think weeks to months. In any case, the trend is down, with my target at the Intermediate degree being below 2000.

What is the alternative? It’s possible, although just barely, that the 2nd wave of Primary degree, which began April 30, is still working out a complex pattern. A decline below 2174, the start of Primary wave 1, would invalidate the alternative.

What about my trades? My three short bear call options spread positions on SPY, Lots 12, 13 and 14, expire tomorrow, May 15. I’ll make decisions today and tomorrow over whether I should exit before expiration, or wait until expiration. At present exiting would cost 15% to 22% over the cost of allowing the options to be exercised at expiration, which is an argument that I should wait.

Learning and other resources. Elliott Wave International has long been the leading analytical house based on Elliott wave theory. They make available a number of free educational materials and other resources, in addition to their for-pay subscriptions.

Terminology. Here are some links to information about some of the technical jargon I use.

Charts. On my charts, waves have a subscript showing the degree above or below the Intermediate degree. Here are the subscripts and the degree each represents:

  • {+3} Supercycle
  • {+2} Cycle
  • {+1} Primary
  • No subscript: Intermediate
  • {-1} Minor
  • {-2} Minute
  • {-3} Minuette

By Tim Bovee, Portland, Oregon, May 14, 2020
Read More »

Live: Wednesday, May 13, 2020

9:55 a.m. New York time

What’s happening now? The S&P 500 dropped below 2885.25, signaling that correction that began on March 22 has reached an end and that a major long-term decline has resumed. The first leg down will carry the price to the 1900s at the least, based on the price channel.

What does it mean? The resumption of the decline that began February 19 is in its early stages. Ultimately, the decline will be with us for months, punctuated by the usual downs and ups.

Screen Shot 2020-05-13 at 6.54.34 AM

What does Elliott wave theory say? The S&P 500 is in Minor wave 3 of Intermediate wave 3 of Primary wave 1, all downtrending.

By my count the 2885.25 level was the end of Minor wave 1 in the present Intermediate wave of the correction. When that level was pierced on May 12, that signaled that wave 2 of Primary degree — an upward correction within wave 1 of Cycle degree — had ended on April 30 at 2965, thus confirming the alternative count, which became the preferred count.

Here’s are the waves of Minor degree so far within Intermediate wave 1:

  • Wave 1, began 4/30/2020 at 2965, length down 194 points, or -6.5%.
  • Wave 2, began 5/3/2020 at 2771, length up 176 points, or 6.4%.
  • Wave 3, began 5/6/2020 at 2947, at this moment down 121.75 points, or 4.1%, and certain to go down further

What is the alternative? None in sight at this point. I’m sure ambiguities will develop later and the market with disentangle them in its own time.

What about my trades? The present downtrend has three more days to bring my three short bear call options spread positions on SPY back into profitability. Lots 12, 13 and 14 all expiring on Friday, May 15. A 200 point or so drop in the S&P 500 would bring those positions back into profitability.

Learning and other resources. Elliott Wave International has long been the leading analytical house based on Elliott wave theory. They make available a number of free educational materials and other resources, in addition to their for-pay subscriptions.

Terminology. Here are some links to information about some of the technical jargon I use.

Charts. On my charts, waves have a subscript showing the degree above or below the Intermediate degree. Here are the subscripts and the degree each represents:

  • {+3} Supercycle
  • {+2} Cycle
  • {+1} Primary
  • No subscript: Intermediate
  • {-1} Minor
  • {-2} Minute
  • {-3} Minuette

By Tim Bovee, Portland, Oregon, May 13, 2020

Read More »

Live: Tuesday, May 12, 2020

3:50 p.m. New York time

Elliott wave analysis: The S&P 500 has broken below 2885.25, the end of Minor wave 1, a movement that invalidates my preferred count. The alternative count is now my preferred, with Primary wave 3 to the downside beginning on April 30 from 2965. The current wave is Intermediate wave 3 to the downside.

10 a.m. New York time

I’ve added to my SDS holdings, buying 53 shares for $22.58 each. SDS moves double in the direction opposite the S&P 500.

9:40 a.m. New York time

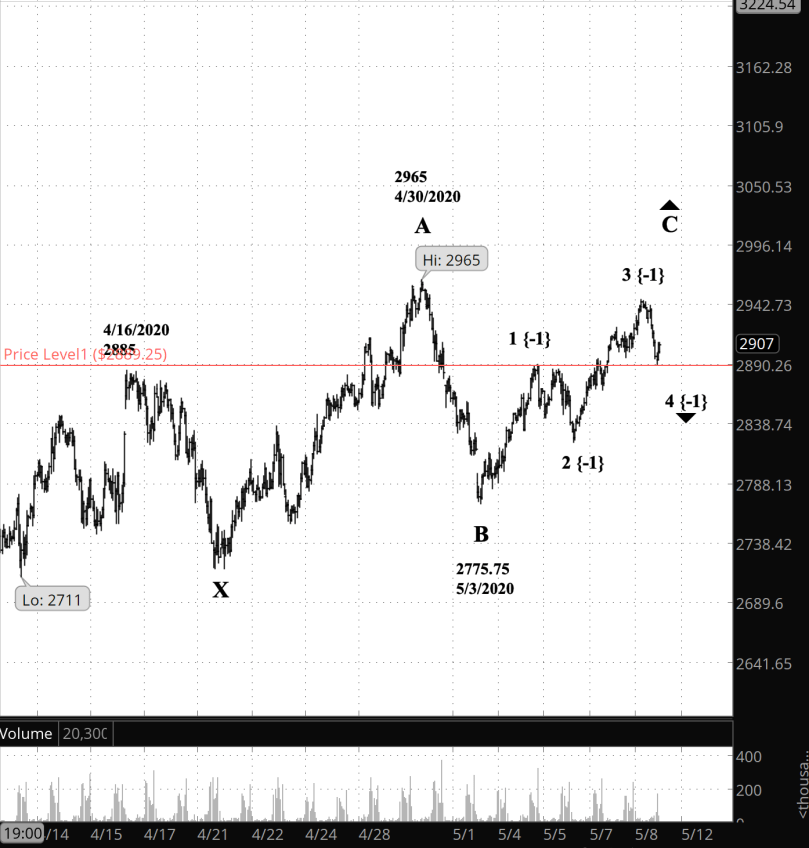
What’s happening now? The S&P 500 continues the sideways trend that began May 10.

What does it mean? The index is in a lower-scale correction within a larger correction. Once that correction is complete, there will be a final, perhaps brief, push to the upside followed by a significant, large decline.

Screen Shot 2020-05-12 at 6.41.31 AM

What does Elliott wave theory say? Minor wave 4 continues to work through a Flat pattern within Intermediate wave C of Primary wave 2. The end of the Flat will also be the start of the final wave of Intermediate wave C and Primary wave 2, unless the Minor 4th turns into a combination, a more complex correction. The next wave, Primary wave 3, will decline sharply, almost certainly below the 2,000 level.

What is the alternative? The chart can also be counted as Primary wave 2 having ended on April 30 at 2965, making the present move Minor wave 4 within Intermediate wave 2 to the upside. My preferred count and the alternative are identical under the Elliott wave analysis. A move above 2965 confirms my preferred count. A very energetic onset of a decline with the price since April 30 having stayed below 2965 will confirm the alternative count.

What about my trades? Still holding three short bear call options spread positions on SPY: Lots 12, 13 and 14, all expiring May 15. (The lot numbers link to the entry analyses.)

Like millions of Americans I have received my Covid-19 relief payment from the government, and like 40% of the recipients, and I shall save it, investing it in shares of SDS, the inverse S&P 500 exchange-traded fund.

Learning and other resources. Elliott Wave International has long been the leading analytical house based on Elliott wave theory. They make available a number of free educational materials and other resources, in addition to their for-pay subscriptions.

Terminology. Here are some links to information about some of the technical jargon I use.

Charts. On my charts, waves have a subscript showing the degree above or below the Intermediate degree. Here are the subscripts and the degree each represents:

  • {+3} Supercycle
  • {+2} Cycle
  • {+1} Primary
  • No subscript: Intermediate
  • {-1} Minor
  • {-2} Minute
  • {-3} Minuette

By Tim Bovee, Portland, Oregon, May 12, 2020

Read More »

Live: Monday, May 11, 2020

3:15 p.m. New York time

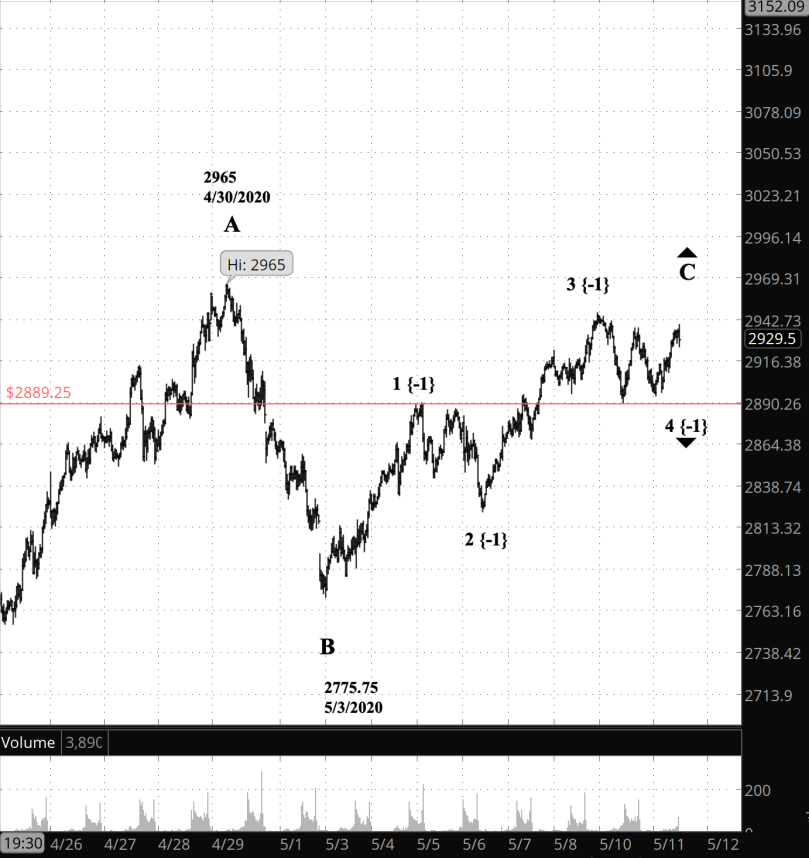
The S&P 500’s first Minuette degree leg, which is wave A down in Minor wave 4, ended a three-wave decline a couple of hours after the opening bell today, and has so far traced three waves to the upside. That confirms that wave 4 will be a Flat pattern, with not a lot more up and not a lot of down until it completes its work.

10:30 a.m. New York time

What’s happening now? The upward correction of the S&P 500 is nearing its end, with a decline that began on Sunday in the futures extending today. The decline as of this writing is 57.25 points, which is 1.9%.

What does it mean? The decline, which I expect to be shallow and sideways-trending, will be followed by a rise that will conclude the upward correction that began March 22. From the peak of that rise, a decline will begin, eventually dropping below 2000, perhaps by a significant amount.

Screen Shot 2020-05-11 at 7.09.34 AM

What does Elliott wave theory say? Minor wave 4 within Intermediate wave C has begun. Minor wave 3 is the longest wave of the series so far, 124 points against 118.25 for Minor wave 1. The rule is that a 3rd wave cannot be the shortest, and so the coming wave 5 to the upside has no limit on how low it can go, as long as it remains above 2889.25. the end of Minor wave 1 (the red line on the chart). The low so far has been 2889.75.

Minor wave 2 was a Zigzag, and I would expect Minor 4 to be a Flat, or perhaps a combination of some sort. This comes under a tendency for waves 2 and 4 to have different corrective patterns.

Big picture: The Intermediate C wave up has so far peaked at 2947, which is 71.0% of the length of the Intermediate A wave. The next Fibonacci point is 78.6%, which is a quote of 2965.73, and afterward, equality at 3018.75. The encompassing Primary wave 2, the whole upward correction, can’t go above the start of Primary wave 1, which is 3397.50. If it did, then the entire count of the decline that began February 19 would have to be re-analyzed.

What is the alternative? If the present wave 4 pierces 2889.25, then my count will need to be redone, probably by relabeling Minor wave 3 as Minor wave 5, and the subsequent decline as the beginning of Intermediate wave 1 down within Primary wave 3, also down.

What about my trades? My three short bear call options spread positions on SPY, Lots 12, 13 and 14, all expire on Friday. At present they stands between 21% and 27% above maximum loss at expiration. There is a significant likelihood of involuntary assignment, replacing an in-the-money call with shares of SPY. As long as the cost of getting out remains above 100% of the maximum at expiration, I shall allow unassigned positions to expire for max loss.

Learning and other resources. Elliott Wave International has long been the leading analytical house based on Elliott wave theory. They make available a number of free educational materials and other resources, in addition to their for-pay subscriptions.

Terminology. Here are some links to information about some of the technical jargon I use.

Charts. On my charts, waves have a subscript showing the degree above or below the Intermediate degree. Here are the subscripts and the degree each represents:

  • {+3} Supercycle
  • {+2} Cycle
  • {+1} Primary
  • No subscript: Intermediate
  • {-1} Minor
  • {-2} Minute
  • {-3} Minuette

By Tim Bovee, Portland, Oregon, May 11, 2020

Read More »

The R-word

11:30 a.m. New York time

OK. We can say the word now. No one likes to say it. No one wants to jinx the economy. Yet, we must face facts. We are, really and truly, in a recession.

No word on it yet from the National Bureau of Economic Research (NBER), the private organization that “officially” declares recessions, generally quite some time after they begin, but instead by something new, the Sahm Rule, created in 2019 by a Federal Reserve economist Claudia Sahm with the goal of providing an early signal for the Fed governors and bank presidents to identify the start of recessions.

Her system is based a moving average of the unemployment rate and backtested for decades has proven to be quite accurate in its calls. A Reuters article last year described her system.

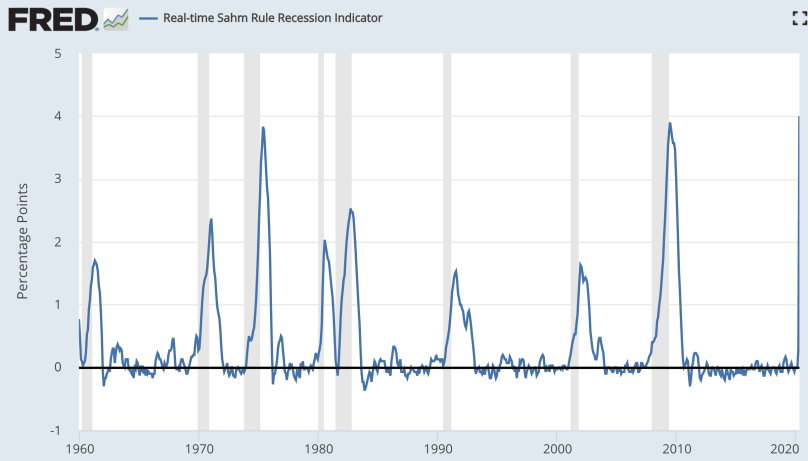
Today, based on a 14.7% unemployment, is the first real-time signal since the Fed added the Rule to its data toolkit, Fred.

Screen Shot 2020-05-08 at 8.26.37 AM

Recessions are shaded grey in the Fred chart. The trigger point for calling a recession with the Sahm Rule is 0.5 or above. Before the pandemic, in February, it stood at 0.00. In March, when job losses from the pandemic was just beginning, it reached 0.30. And a monthly later, in figures released today, it shot up to 4.00, an all time high since December 1959, when source data first became available.

The prior high came during the Great Recession of 2007-2009. The Sahm Rule, had it existed back then, reached the 0.50 trigger in April 2008, four months after the recession began, and peaked at 3.90 in June 2009, a year and a half into the recession.

The velocity this time around is, to say the least, somewhat higher. Astoundingly so, actually. The Coronavirus Recession has triggered the Sahm Rule and reached an all-time high all in a single month. The NBER committee will declare the recession when it has sufficient data — there’s a far more complex analysis than the Sahm Rule provides — but until then we have a basis now for adding the R-word to our lexicon.

By Tim Bovee, Portland, Oregon, May 8, 2020

Read More »

Live: Friday, May 8, 2020

10:50 a.m. New York time

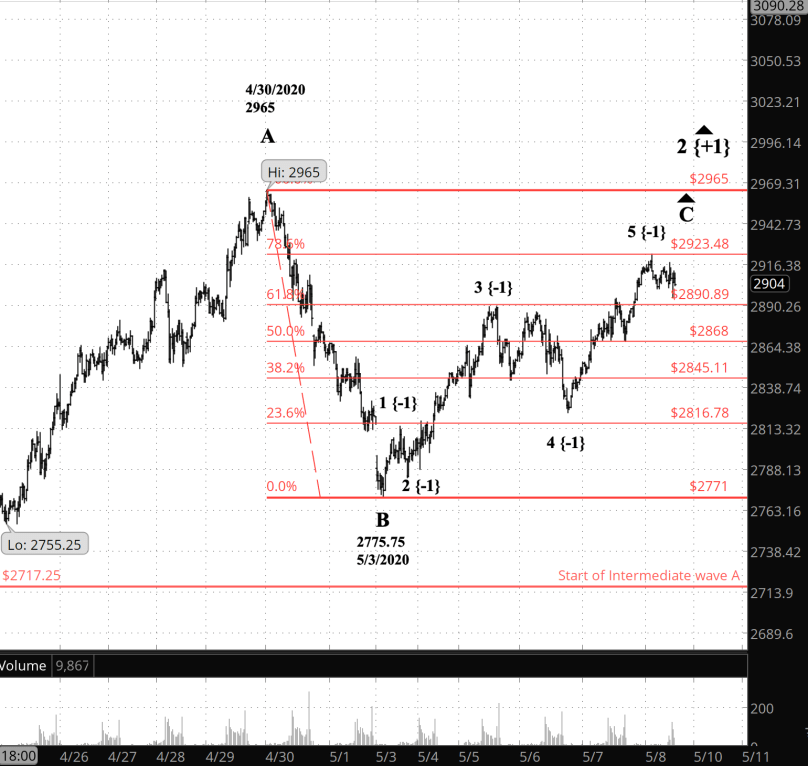
What’s happening now? The S&P 500 retraced 78% of its decline from April 30, reaching 2923, and then withdrew slightly.

What does it mean? The 78.5% retracement is a Fibonacci level, a not uncommon stopping point. However, that’s no guarantee that the price won’t rise more, even beyond 2965, the beginning of the decline from April 30.

Screen Shot 2020-05-08 at 7.48.12 AM

What does Elliott wave theory say? The present A-B-C pattern at the Intermediate degree, the second within a complex 2nd wave of Primary degree, is like the pattern before it a Zigzag, with five subwaves within the A wave, three within the B, and five within the C. From an Elliott standpoint, C has completed its pattern and the only question remaining is how high Minor wave 5 within Intermediate C will go.

What is the alternative? The alternative count has the decline from April 30 as Intermediate wave 1 within Primary wave 3 to the downside, with the present rise as Intermediate wave 2 to the upside. The count would be the same in either case.

The matter will be resolved if the price moves above the April 30 high of 2965, the start of wave 1 under the alternative count. A 2nd wave never moves beyond the start wave wave 1, so if it does slip higher than 2965, the preferred count is correct, buttressed by the fact that a wave C in a Zigzag almost always ends beyond the end of wave A.

If the price declines, then we’ll have to wait for closure of this knotty problem.

What about my trades? Seven days until my three short bear call options spread positions on SPY expire, next Friday. The lots with links to the entry analyses are Lots 12, 13 and 14.

Learning and other resources. Elliott Wave International has long been the leading analytical house based on Elliott wave theory. They make available a number of free educational materials and other resources, in addition to their for-pay subscriptions.

Terminology. Here are some links to information about some of the technical jargon I use.

Charts. On my charts, waves have a subscript showing the degree above or below the Intermediate degree. Here are the subscripts and the degree each represents:

  • {+3} Supercycle
  • {+2} Cycle
  • {+1} Primary
  • No subscript: Intermediate
  • {-1} Minor
  • {-2} Minute
  • {-3} Minuette

By Tim Bovee, Portland, Oregon, May 8, 2020

Read More »

Live: Thursday, May 7, 2020

10:10 a.m. New York time

What’s happening now? The S&P 500 has meandered sideways since May 5.

What does it mean? At this point the chart shows neither confirmation nor rebuttal that the upward correction that began March 22 is continuing.

Screen Shot 2020-05-07 at 7.10.10 AM

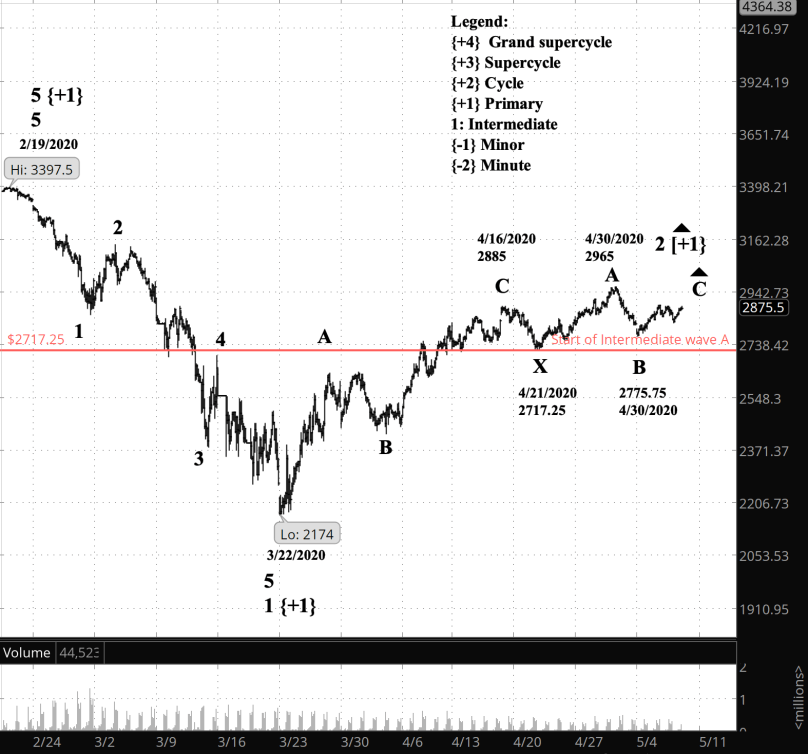
What does Elliott wave theory say? It will take a decline below 2717.25, the beginning of Intermediate wave A by my count, to confirm that the upward correction has ended and Primary wave 3 to the downside has begun.

What is the alternative? That Primary wave 3 began with the peak on April 30 at 2965.

What about my trades? Eight days until expiration of my three short bear call options spread positions on SPY — Lots 12, 13 and 14 — on May 15.

Learning and other resources. Elliott Wave International has long been the leading analytical house based on Elliott wave theory. They make available a number of free educational materials and other resources, in addition to their for-pay subscriptions.

Terminology. Here are some links to information about some of the technical jargon I use.

Charts. On my charts, waves have a subscript showing the degree above or below the Intermediate degree. Here are the subscripts and the degree each represents:

  • {+3} Supercycle
  • {+2} Cycle
  • {+1} Primary
  • No subscript: Intermediate
  • {-1} Minor
  • {-2} Minute
  • {-3} Minuette

By Tim Bovee, Portland, Oregon, May 7, 2020

Read More »

Live: Wednesday, May 6, 2020

9:55 a.m. New York time

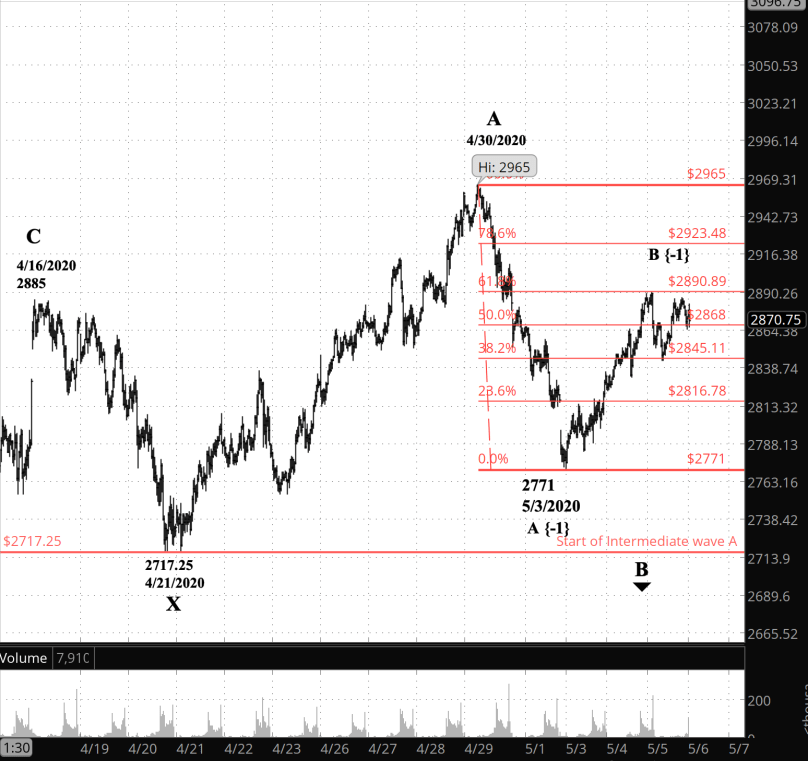
What’s happening now? In after hours trading the S&P 500 bounded off of the 61.8% Fibonacci retracement, fell back down to the lower Fibonacci level, 38.2%, and then climbed back toward 61.8%, falling short of its prior rise.

What does it mean? This could be the end game for the rise that began on May 3. Or maybe not. Given the state of the chart, I’m unable to see a definitive way forward for the near term.

Screen Shot 2020-05-06 at 6.52.07 AM

What does Elliott wave theory say? Minor wave B, which began on May 3 at 2771, has met its requirements. Whether it can continue to rise depends upon whether it has traced three subwaves. I can count it in a way that shows that it has, but I can also count in a way the shows that it hasn’t. As is often the case with Elliott wave analysis, conclusions are more a matter of probability rather than certainty. The big picture is clearer: Minor B will be followed by a Minor C to the downside, which will complete Intermediate wave B and which will be followed by an Intermediate wave C to the upside.

What is the alternative? It’s possible, although I think it’s a low probability, that the peak attained on April 30 ended Intermediate wave C, and the subsequent decline was the start of Primary wave 3 to the downside.

What about my trades? The downward movement Minor wave C will be my last chance to make a profit on my three short bear call options spread positions on SPY: Lots 12, 13 and 14, all expiring May 15. (The lot numbers link to the entry analyses.)

Learning and other resources. Elliott Wave International has long been the leading analytical house based on Elliott wave theory. They make available a number of free educational materials and other resources, in addition to their for-pay subscriptions.

Terminology. Here are some links to information about some of the technical jargon I use.

Charts. On my charts, waves have a subscript showing the degree above or below the Intermediate degree. Here are the subscripts and the degree each represents:

  • {+3} Supercycle
  • {+2} Cycle
  • {+1} Primary
  • No subscript: Intermediate
  • {-1} Minor
  • {-2} Minute
  • {-3} Minuette

By Tim Bovee, Portland, Oregon, May 6, 2020

Read More »

Live: Tuesday, May 5, 2020

10:25 a.m. New York time

What’s happening now? The S&P 500 continues its upward move within an upward correction of the decline that began in February. The price has retraced half of its initial correction decline and has continued past that Fibonacci level.

What does it mean? The upward movement has satisfied its target requirements — between 38% and 79% — and could enter a decline at any time.

Screen Shot 2020-05-05 at 7.23.40 AM

What does Elliott wave theory say? The present rise is a B wave of Minor degree within wave B of Intermediate degree within wave 2 of Primary degree. By the rules it must break into three waves, and at present it looks more like five waves to me. Given the normal ongoing uncertainty over what degree of wave is being counted, I’m unwilling to label it as three waves at this point.

What is the alternative? It is possible to label the high of April 30 as the end of the Primary wave 2, the low of May 3rd as the end of Intermediate wave 1  within Primary wave 3 and the present upward movement as Intermediate wave 2, although the internals in my count rule out that possibility. None the less, if the price moves below 2174, which is the end of Primary wave 1, then the alternative count is correct.

What about my trades? Continuing to hold three short bear call options spread positions on SPY: Lots 12, 13 and 14, all expiring May 15. (The lot numbers link to the entry analyses.) At this point, as is often the case with in-the-money short options positions, I would have a bigger loss if I exited down than I’ll have if they expire in-the-money.

Learning and other resources. Elliott Wave International has long been the leading analytical house based on Elliott wave theory. They make available a number of free educational materials and other resources, in addition to their for-pay subscriptions.

Terminology. Here are some links to information about some of the technical jargon I use.

Charts. On my charts, waves have a subscript showing the degree above or below the Intermediate degree. Here are the subscripts and the degree each represents:

  • {+3} Supercycle
  • {+2} Cycle
  • {+1} Primary
  • No subscript: Intermediate
  • {-1} Minor
  • {-2} Minute
  • {-3} Minuette

By Tim Bovee, Portland, Oregon, May 5, 2020

Read More »

Live: Monday, May 4, 2020

11:45 a.m. New York time

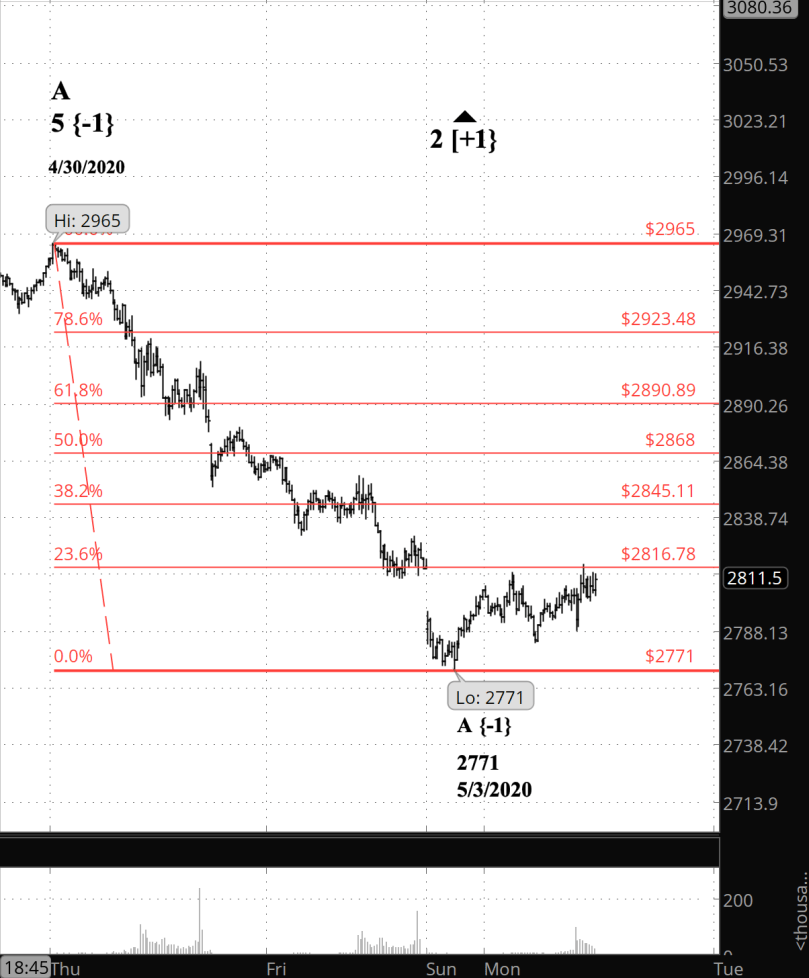
What’s happening now? The S&P 500 dropped to 2771 Sunday night and reversed to the upside, bouncing off of the 78.6% Fibonacci retracement level.

What does it mean? The price will next enter a short-term upward trend, the middle movement of three.

Screen Shot 2020-05-04 at 8.38.45 AM

What does Elliott wave theory say? By my count the Minor A wave to the downside is complete, having shows five sort-of-unclear waves (I really find Minor A hard to count). Minor A is a subwave of Intermediate B to the downside within Primary 2 to the upside, all within Cycle 1, a major downtrend that began on February 19.

B waves tends to correct anywhere from 38% to 79% of wave A, so we can place a tentative target between 2850 and 2925, give or take.

What is the alternative? The alternative posits that Minor wave B is still not complete. If it moves below a 90% retracement of wave A (2742 on the S&P 500), then it is a Flat rather than a Zigzag.)

What about my trades? The clock is running out on my three short bear call options spread positions on SPY: Lots 12, 13 and 14. They all expire May 15. If SPY reaches below 261, then all will be out of the money and will expire for maximum profit (or be sold for a profit). Anything below 263 makes one position profitable. (The lot numbers link to the entry analyses.)

I one had a lawyer who’s favorite line was “It is what it is.” That sentiment seems to apply here.

Learning and other resources. Elliott Wave International has long been the leading analytical house based on Elliott wave theory. They make available a number of free educational materials and other resources, in addition to their for-pay subscriptions.

Terminology. Here are some links to information about some of the technical jargon I use.

Charts. On my charts, waves have a subscript showing the degree above or below the Intermediate degree. Here are the subscripts and the degree each represents:

  • {+3} Supercycle
  • {+2} Cycle
  • {+1} Primary
  • No subscript: Intermediate
  • {-1} Minor
  • {-2} Minute
  • {-3} Minuette

By Tim Bovee, Portland, Oregon, May 4, 2020

Read More »