Live: Thursday, May 10, 2018

5/10 – 3:15 p.m. New York time

Having moved above the April 18 peak, SPY in my opinion will continue to zig and zag for weeks. My options position on SPY doesn’t expire until mid-June, and the declines within the complex correction will provide exit opportunities, especially as increasing Theta — the measure of time decay — decreases the cost of exiting the position.

Regarding my shares plays, I go by the rule that I play movements in the direction of the larger trend, which since Jan. 26 has been down at the Primary degree in Elliott wave analysis. However, the correction within that downtrend is uptrending. That implies that I would want to play the A and C waves, while sitting out the B waves.

And so I shall do, using the daily Fisher Transform as a signal for entering and exiting SPXL as a triple-leverage bull play on the S&P 500. (The bear leveraged counterpart is SPXU.)

No trades today.

5/10 – 12:40 p.m. New York time

SPY has moved above the April 18 high of $271.30, the 2nd wave peak in the primary degree. Therefore, I have altered my count to show a more complex pattern developing, composed of several patterns linked together.

A 30-day chart of SPY with 15-minute bars.

spy20100510b

5/10 – 10:25 a.m. New York time

SPY remain just barely below the $271.30 level. As of this morning there is no need to act on my bear position on SPY using options, nor to enter a shares trade.

Why is the $271.30 level important? It has to do with the rules and guidelines for Elliott wave analysis of charts.

The red line in the SPY chart below, taken just a few moments ago, marks the April 18 peak of $271.30. That peak marked the beginning of Wave 1 to the downside of the Minute degree.

SPY is now working through a Wave 2 correction to the upside in the same degree. The rules state that a 2nd wave cannot move beyond the starting point of the preceding 1st wave of the same degree. If the count shows it doing so, then the count is incorrect; something else going on.

So far, that rule has not come into play and the present count stands. If it the $271.30 level is breached, then I shall redo the count and figure out what that “something else going on” is.

The chart below covers SPY for 30 days with 15-minute bars.

spy20180510

By Tim Bovee, Portland, Oregon, May 10, 2018
Read More »

Live: Wednesday, May 9, 2018

5/9 – 3:10 p.m. New York time

No trades today. SPY has peaked so far at 269.97. A move above 271.30, the April 18 high, could cause me to rethink my Elliott wave analysis.

5/9 – 10:25 a.m. New York time

SPY continues its non-trending sideways correction within the frame of a larger downtrend. No trade in sight this morning.

By Tim Bovee, Portland, Oregon, May 9, 2018

Read More »

Live: Tuesday, May 8, 2018

5/8 – 3:10 p.m. New York time

My next anticipated trade is to re-enter a shares position on SPXU, the inverse S&P 500 fund, when the Fisher Transform signals a downtrend on the daily chart. It remains in uptrend mode, so no trades today.

5/8 – 10:30 a.m. New York time

I continue to operate on two bearish tracks.

The first, managing options plays on SPY, relies on Elliott wave analysis for entry/exit signals with the Fisher transform serving as a granular signal for when to make the trade. The positions expire in mid-June. The Elliott wave analysis is ambiguous but suggests a sideways correction within a larger downtrend.

The second, re-entry into a shares trade on the inverse S&P 500 fund SPXU, relies primarily on the Fisher transform for entry/exit signals within a major trend identified by Elliott wave analysis. The Fisher is presently showing an uptrend signal, so I am out of the shares position.

By Tim Bovee, Portland, Oregon, May 8, 2018

Read More »

Live: Monday, May 7, 2018

5/7 – 3:20 p.m. New York time

I exited my shares position on SPXU based on the Fisher Transform but retained my options-based bear position on SPY based on Elliott wave analysis.

5/7 – 1:30 p.m. New York time

I’ve updated my SPXU Analysis with results.

5/7 – 10:20 a.m. New York time

I have exited my shares position on SPXU for a loss, based on the Fisher Transform remaining in an uptrending posture. SPXU profits in a downtrend in the S&P 500. (See Friday’s Live post for a discussion.)

The chart this morning remains consistent with my analysis and I plan no action this morning on my bear positions on SPY using options. (See Thursday’s Live post for a chart discussion.)


By Tim Bovee, Portland, Oregon, May 7, 2018

Read More »

The Week Ahead: Prices

Price reports dominate economic statistics this week: The producer price index (final demand)  on Wednesday and the consumer price index on Thursday, each at 8:30 a.m. New York time

In Fedworld, Chairman Jerome Powell takes part in a panel discussion at a conference in Zurich sponsored by the Swiss National Bank and the International Monetary Fund, on Tuesday at 3:15 a.m. New York time (9:15 a.m. Zurich time). His topic: Monetary policy influences on global financial conditions and international capital flows. The event will be streamed live here.

Read More »

Live: Friday, May 4, 2018

5/4 – 3:50 p.m. New York time

The Fisher Transform on the SPY 10-minute chart remains downtrending, although the daily chart is uptrending. Without unanimity, I won’t exit the SPXL shares position now, but shall wait until Monday to evaluate my next action. No trades today.

5/4 – 3:20 p.m. New York time

The Fisher Transform on SPY, which tracks the S&P 500, has moved to uptrending on the daily chart, and yet is downtrending on the 10-minute chart. I unanimity between the two levels before acting.

If the 10-day bar movs to uptrending, then I shall exit my shares position on SPXU, a leveraged inverse ETF tracking the S&P 500 and replace it with SPXL, a non-inverse leveraged S&P 500 fund. Otherwise I shall retain my SPXU position.

5/4 – 11:45 a.m. New York time

SPY remains in downtrend mode on the Fisher Transform, and there has been no change in the Elliott wave analysis posted on Thursday.

By Tim Bovee, Portland, Oregon, May 4, 2018

Read More »

Shares: SPXU

ProShares UltraPro Short S&P500 (SPXU)

Update 5/7/2018: The Fisher Transform moved to uptrending on the SPY daily chart, and I exited my bear position on the SPXU inverse fund for a loss. I shall re-enter SPXU when the Fisher again signals a downtrend.


I have entered a bull position on SPXU using shares. SPXU is a short fund — it attempts to move the opposite of the S&P 500 — and a leveraged fund — it attempts to produce triple the return (or loss) for any given price move.

I entered the position because the daily chart Fisher Transform on SPXU is uptrending, and my Elliott wave analysis shows the S&P 500 in a third wave to the downside at multiple degrees. (See the SPY chart discussion in the May 3 Live post.)

So, a declining SPY equates to a rising SPXU.

The trade:

sym entry exit result (%) annualized (%) entry date exit date
SPXU 11.24  10.58  -5.9%  -535.8% 5/3  5/7

For my SPY options positions I’m relying on Elliott wave analysis to tell me that it’s time to get out. For SPXU, I’m eliminating the Elliott for exits and shall rely solely on the Fisher Transform to signal entries and exits.

I an do this because the position was placed the Robinhood Markets Inc. platform, which charges no commission on trades.

By Tim Bovee, Portland, Oregon, May 3, 2018

Read More »

SPY Analysis

SPDR S&P 500 ETF (SPY)

Update 6/11/2018: Exited. Results to be posted shortly.

I have entered a short vertical spread on SPY, using options that trade for the last time 43 days hence, on June 15. The premium is a 2.92 credit and the stock at the time of entry was priced at $262.50.

I made the decision to enter the trade in my account after concluding, based on Elliott wave analysis, that a 3rd wave down at the Minuette degree has begun. The Minuette is my preferred degree for trading options.

Read More »

Live: Thursday, May 3, 2018

5/3 – 3:20 p.m. New York time

I entered two positions today, a short bear position using options on SPY and a long bull position using shares on SPXU, which is an inverse fund with the same underlying as SPY, the S&P 500 index.

5/3 – 1:05 p.m. New York time

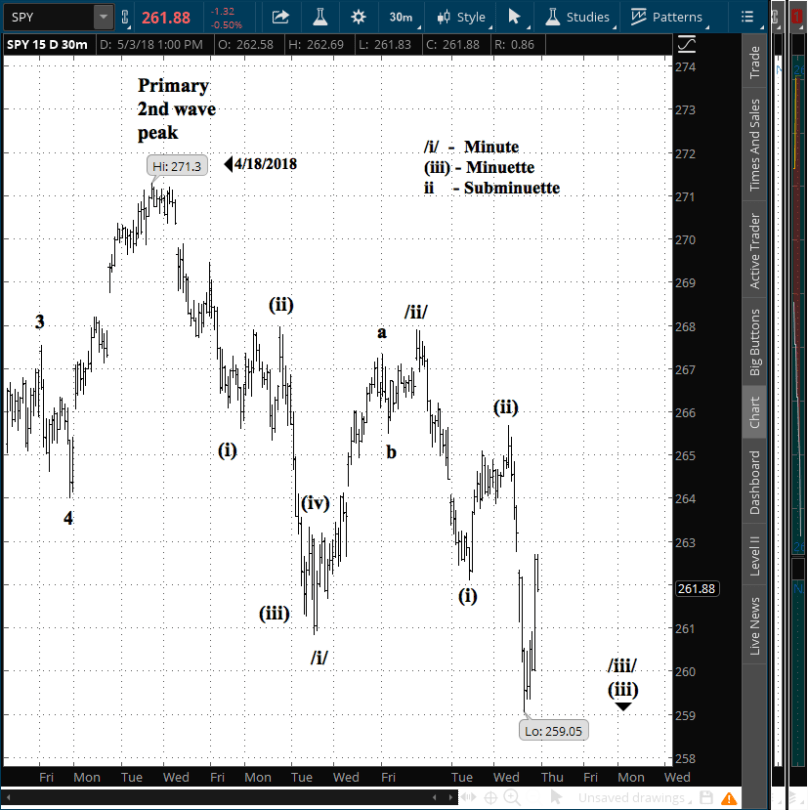
I have entered a bear-call-spread position on SPY after reworking my chart analysis. One problem with what I had before — and it is one that I have mentioned previously — is that the “feel” wasn’t right. The duration and span of the waves seemed somewhat inconsistent.

The new count considers the 3rd wave down of the Minuette degree to have begun on May 2. The Minuette is my preferred tell-tale for entering trades.

A 3rd wave at the Minuette degree is also a 3rd wave at the Minute degree, and indeed at the Primary degree, which is the level that began its 1st wave down on Jan. 26, kicking off the bear market.

Here is my reworked chart, covering 15 days with 30-minute bars:

spy20180503

5/3 – 11 a.m. New York time

My goal today will be to find a re-entry point into the large exchange-traded funds, SPY foremost, but others as well. No guarantees of success of course. As thte old market wisdom has it, “When in doubt, stay out.”

By Tim Bovee, Portland, Oregon, May 3, 2018

Read More »