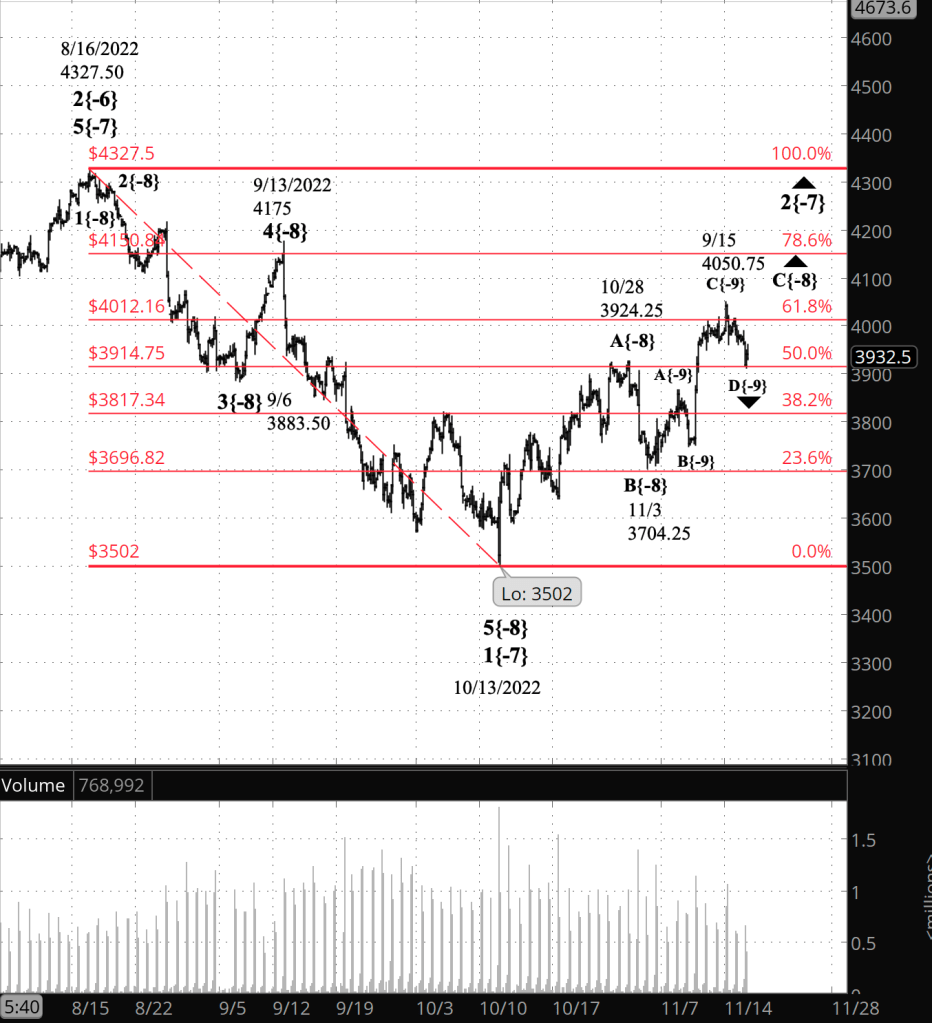
3:30 p.m. New York time
Half an hour before the closing bell. The S&P 500 rose rapidly after the Federal Open Market Committee minutes from early November were released, moving from 4020 to 4039.25 on the futures in 27 minutes. The price then fell back a bit while remaining above the 61.8% Fibonacci retracement level.
The price remained below the November 15 high, 4050.75 — the high point so far of the upward correction that began on October 13.
My analysis from this morning remains unchanged. Declining wave D{-9} within rising wave C{-8} within the upward correction, wave 2{-7} is underway. If the price moves above 4050.75, then I’ll reconsider the analysis.
I’ve updated the chart.
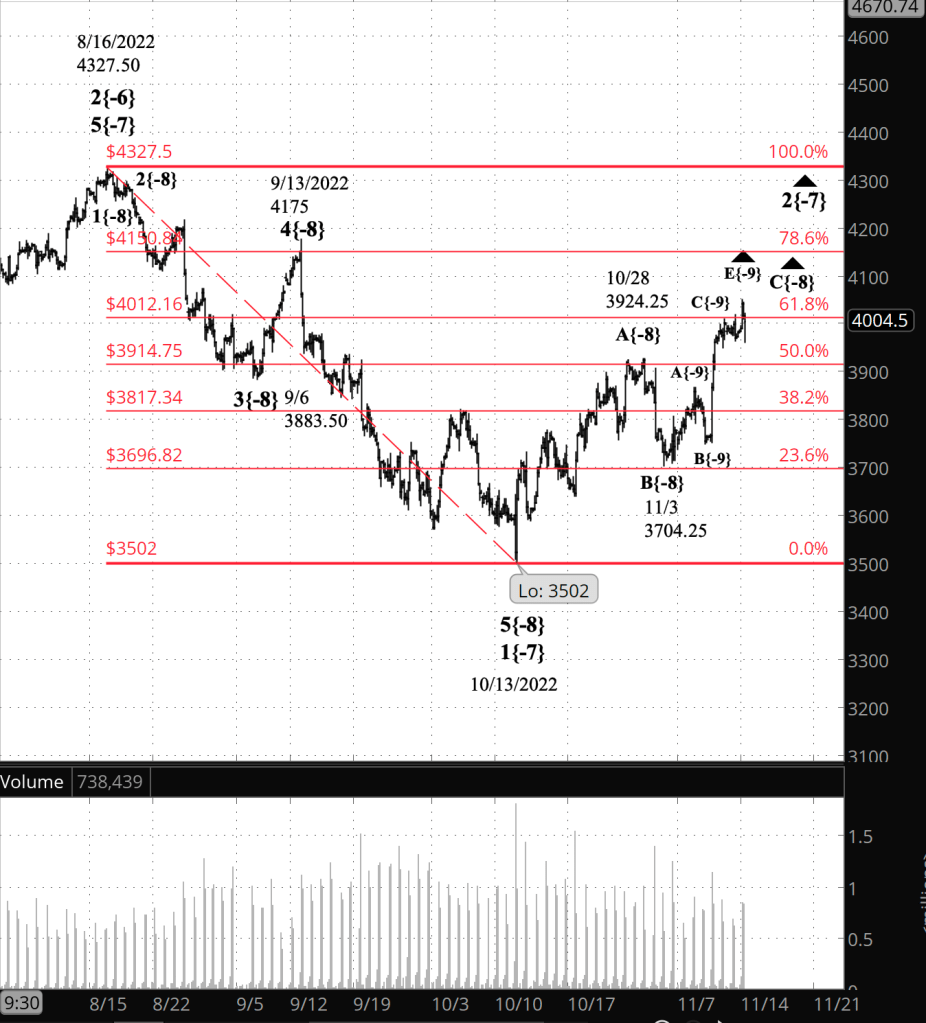
9:35 a.m. New York time
Market holiday. Tomorrow, Thursday, is the Thanksgiving Day holiday in the United States, and U.S. markets will be closed. They will re-open on Friday at the usual time for an abbreviated session ending at 1 p.m. I shall post analyses at 9:35 a.m. and 12:30 p.m. during Friday’s short session.
What’s happening now? The S&P 500 E-mini futures pushed almost 10 points above the 61.8% Fibonacci retracement level, to 4021.75, and then retreated, falling 10 points below that level. The Fibonacci levels are shown on the chart in red. After the opening bell the price rose back to the 61.8% retracement level.
What does it mean? The 61.8% retracement level is a common stopping point. The question on this chart is, What was it that was stopped? Or at least disrupted.
For my principal analysis, I’m staying with the scenario that I’ve had since last week: The upward correction that began on October 13 is still underway and is in its next-to-the-last subwave within its third and final wave. The fifth and final subwave will follow, likely taking the price above the November 15 high, 4050.75.
What is the alternative? The alternative scenario is also unchanged. The fifth and final subwave within the third wave of the upward correction began from the November 17 low, 3912.50. I consider this scenario to be less likely because the price has not exceeded the November 15 high, which was the end point of the middle wave of the five-subwave series. If the price moves above 4050.75, then the alternative will become the principal analysis.

[S&P 500 E-mini futures at 3:30 p.m., 4-hour bars, with volume]
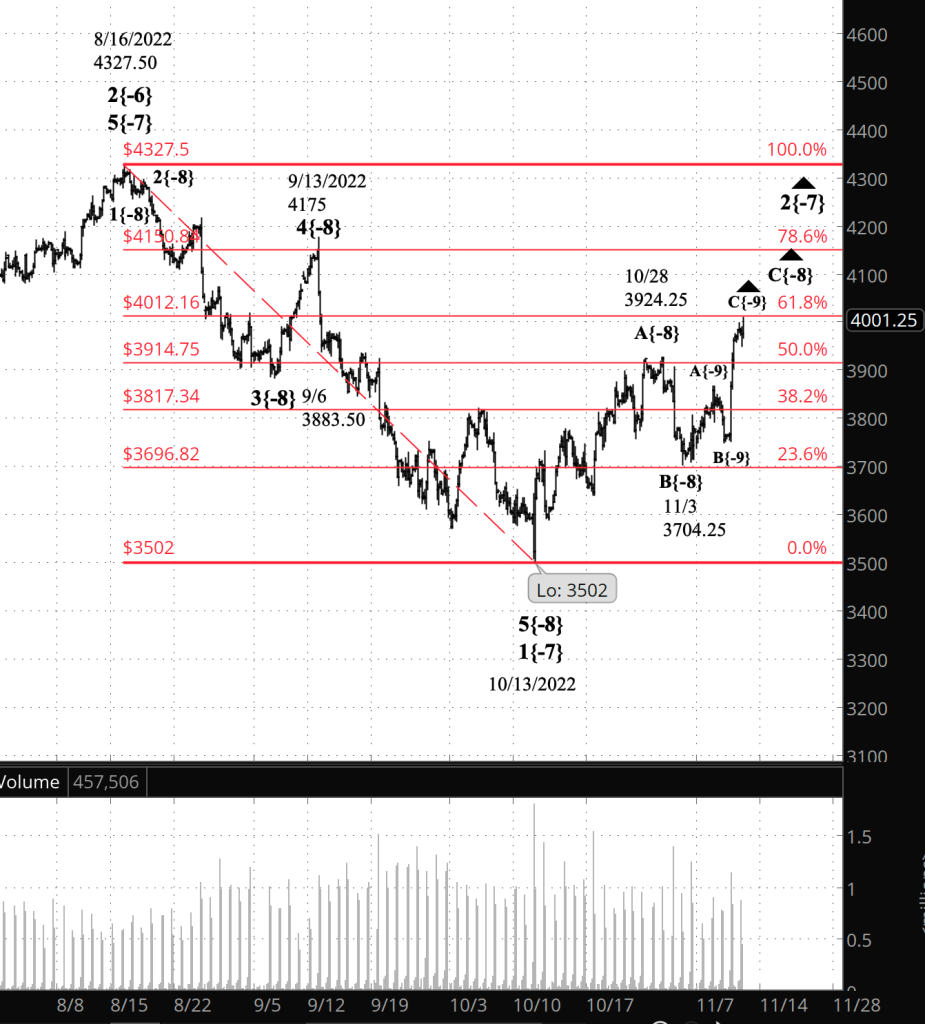
What does Elliott wave theory say? The upward correct that began on October 13 is wave 2{-7}, a correction within a downtrend, wave 3{-6}, that began on August 16 from 4327.50. The correction’s starting point was 3502.
Under the principal analysis, rising wave C{-8}, the final wave of the three-wave corrective pattern that has been the form of wave 2{-7} so far, is in the fourth of five subwaves, descending wave D{-9}, and will be followed by the rising final wave in the series, wave E{-9}.
Under the alternative analysis, wave D{-9} ended on November 15 at 4050.75 and wave E{-9} is underway.
Wave 2{-7} will be followed by wave 3{-7}, a powerful downtrend that will carry the price down 500 points and lower, perhaps much lower. Big picture, the state of the chart at present is downtrends, from wave 3{-6} up to wave 4{-1}, which began on January 4 from 4808.25. See the “We Are Here” section below for an inventory of waves now in progress.
We Are Here.
These are the waves currently in progress under my principal analysis. Each line on the list shows the wave number, with the subscript in curly brackets, the traditional degree name, the starting date, the starting price of the S&P 500 E-mini futures, and the direction of the wave.
- S&P 500 Index:
- 5{+3} Supercycle, 7/8/1932, 4.40 (up)
- 5{+2} Cycle, 12/9/1974, 60.96 (up)
- 5{+1} Primary, 3/6/2009, 666.79 (up)
- 5{0} Intermediate, 12/26/2018, 2346.58 (up)
- 4{-1} Minor, 1/4/2022 4818.62 (down)
- 1{-2} Minute, 1/4/2022 4818.62 (down)
- S&P 500 Futures and index:
- 1{-3} Minuette, 1/4/2022, 4808.25 (down) (futures), 4818.62 (down) (index)
- S&P 500 Futures:
- 1{-4} Subminuette, 1/4/2022, 4808.25 (down)
- 1{-5} Micro, 1/4/2022, 4808.25 (down)
- 3{-6} Submicro, 8/16/2022, 4327.50 (down)
- 2{-7} Minuscule, 10/13/2022, 3502 (up)
- C{-8} Subminuscule, 11/3/2022, 3704.25 (up)
Learning and other resources. Elliott wave analysis provides context, not prophecy. As the 20th century semanticist Alfred Korzybski put it in his book Science and Sanity (1933), “The map is not the territory … The only usefulness of a map depends on similarity of structure between the empirical world and the map.” And I would add, in the ever-changing markets, we can judge that similarity of structure only after the fact.
See the menu page Analytical Methods for a rundown on where to go for information on Elliott wave analysis.
By Tim Bovee, Portland, Oregon, November 23, 2022
Disclaimer
Tim Bovee, Private Trader tracks the analysis and trades of a private trader for his own accounts. Nothing in this blog constitutes a recommendation to buy or sell stocks, options or any other financial instrument. The only purpose of this blog is to provide education and entertainment.
No trader is ever 100 percent successful in his or her trades. Trading in the stock and option markets is risky and uncertain. Each trader must make trading decisions for his or her own account, and take responsibility for the consequences.
License
All content on Tim Bovee, Private Trader by Timothy K. Bovee is licensed under a Creative Commons Attribution-ShareAlike 4.0 International License.
Based on a work at www.timbovee.com.


You must be logged in to post a comment.