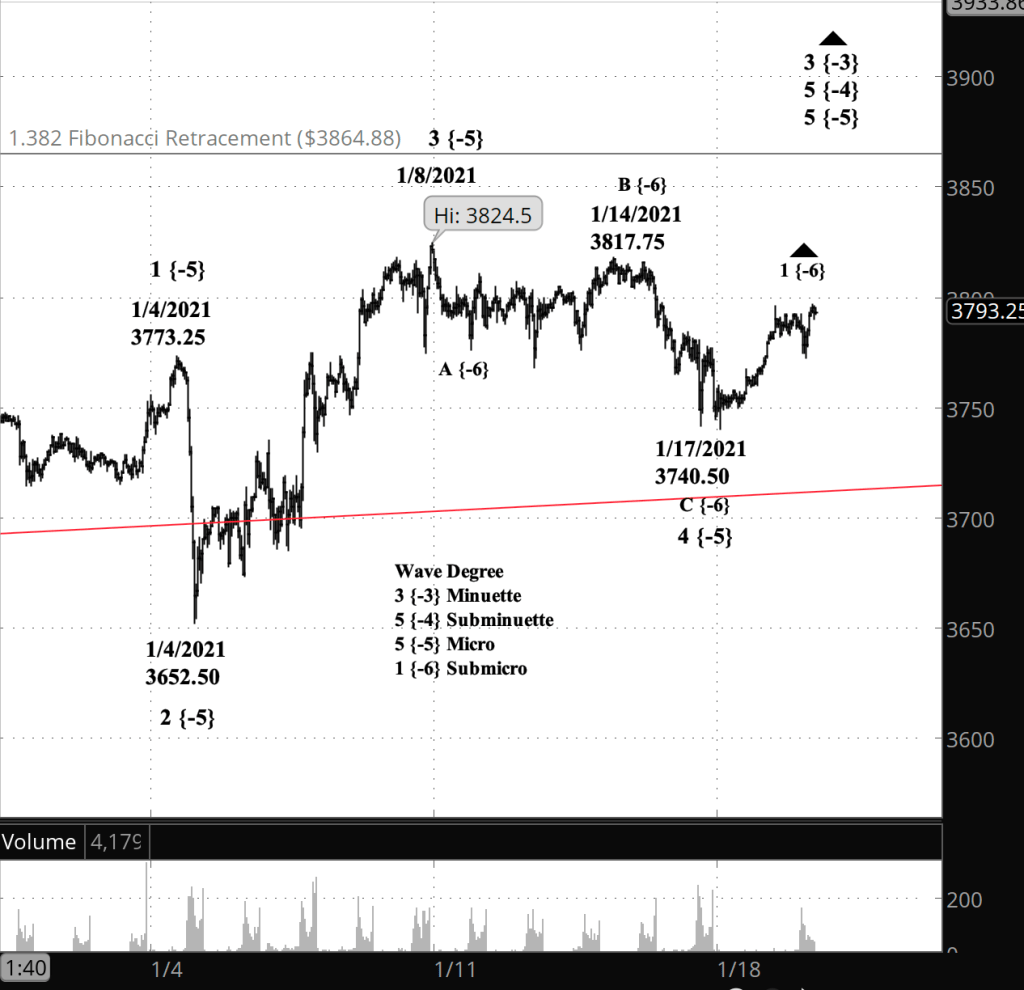
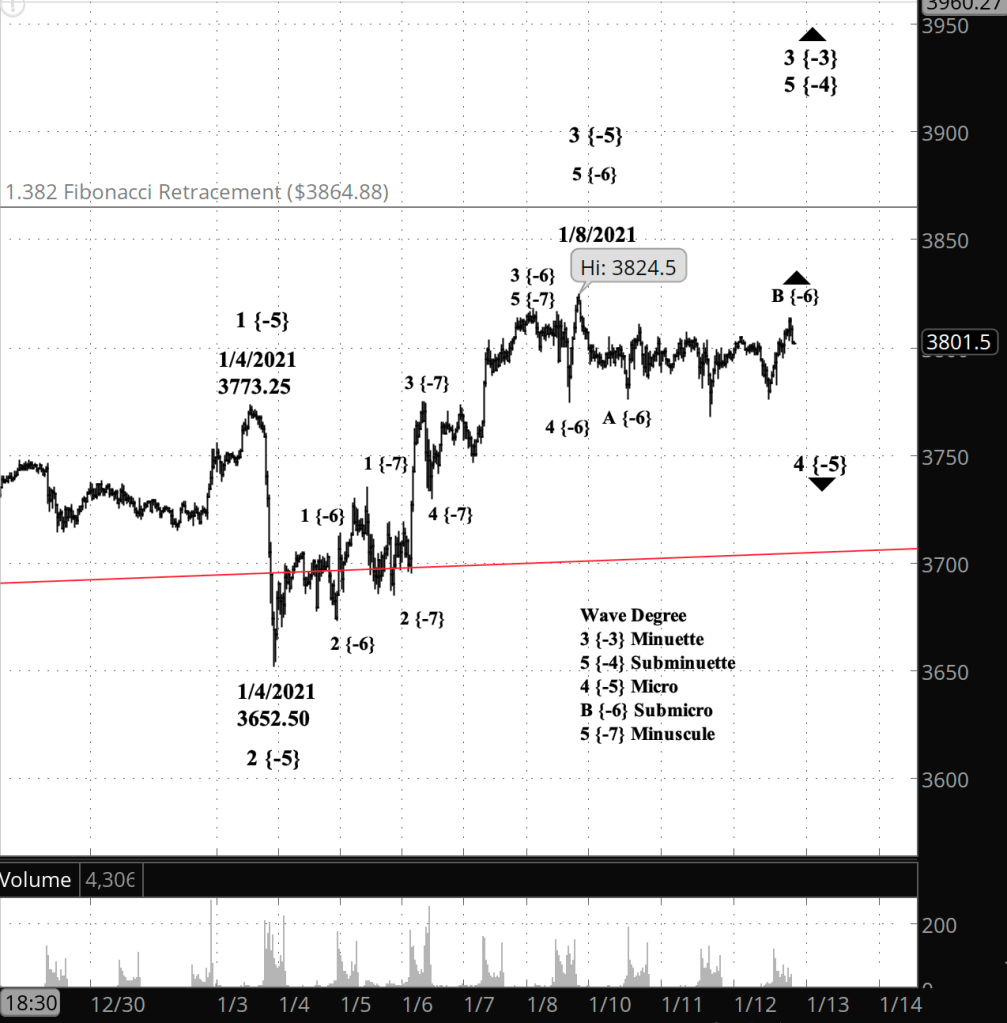
Half an hour before the closing bell. The S&P 500 E-mini futures continued to rise, reaching what can be counted as a 5th and final subwave wave of wave 1 of Submicro degree. I’ve updated the chart below.
9:35 a.m. New York time
What’s happening now? The S&P 500 E-mini futures continued the rise that began on January 17 from 3740.50.
What does it mean? The rise is the beginning of the end of the uptrend that began in October 2020. It will be followed by a downward correction, although a shallow one, likely reaching below 3000 and perhaps into the 2700s.
What is the alternative? The rise could be separating two, back-to-back corrective patterns. If that’s the case, then rise will be followed by a second corrective pattern.
[S&P 500 E-mini futures at 3:30 p.m., 40-minute bars, with volume]
What does Elliott wave theory say? Under my principle count, the rise from January 17 is wave 1 of Submicro degree within wave 5 of Micro degree within wave 5 of Subminuette degree, all of that happening within wave 3 of Minuette degree. Submicro wave 1 appears to be in its 4th subwave.
The alternative count labels the rise from January 17 as wave X of Submicro degree, a separator wave that will be followed by a three-wave corrective pattern (A-B-C) or a five-wave Triangle structure.
Market holiday. Markets in the United States are closed today for the holiday honoring Martin Luther King. The S&P 500 E-mini futures were traded overnight in other countries.
What’s happening now? The S&P 500 E-mini futures reversed at 3740.50 in overnight trading on January 17 after a decline that began on January 14 from 3817.75.
What does it mean? The reversal marks the start of a final uptrend within the larger rise that began October 30 from 3225.
What is the alternative? The rise that began overnight might be a separator between two corrective patterns, which is called a compound correction. It could also be that the downtrend that began January 14 is still in progress.
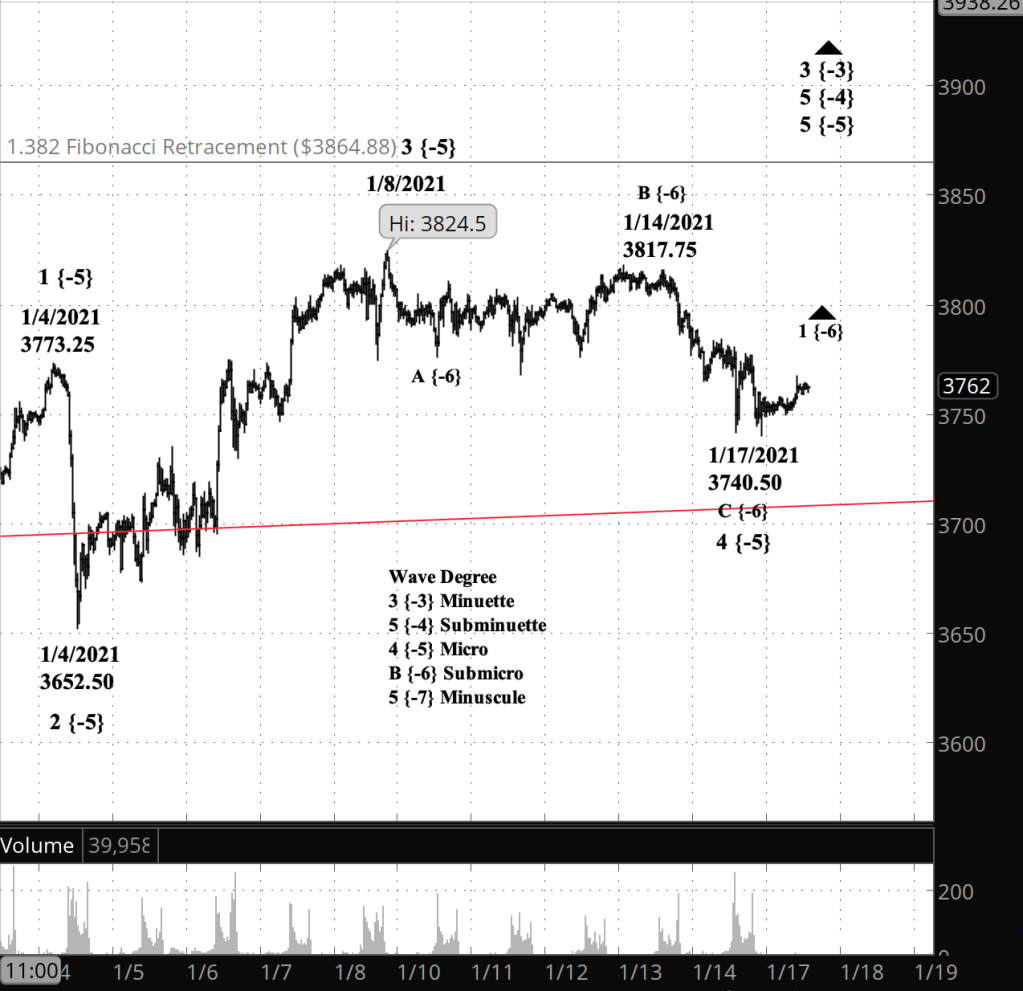
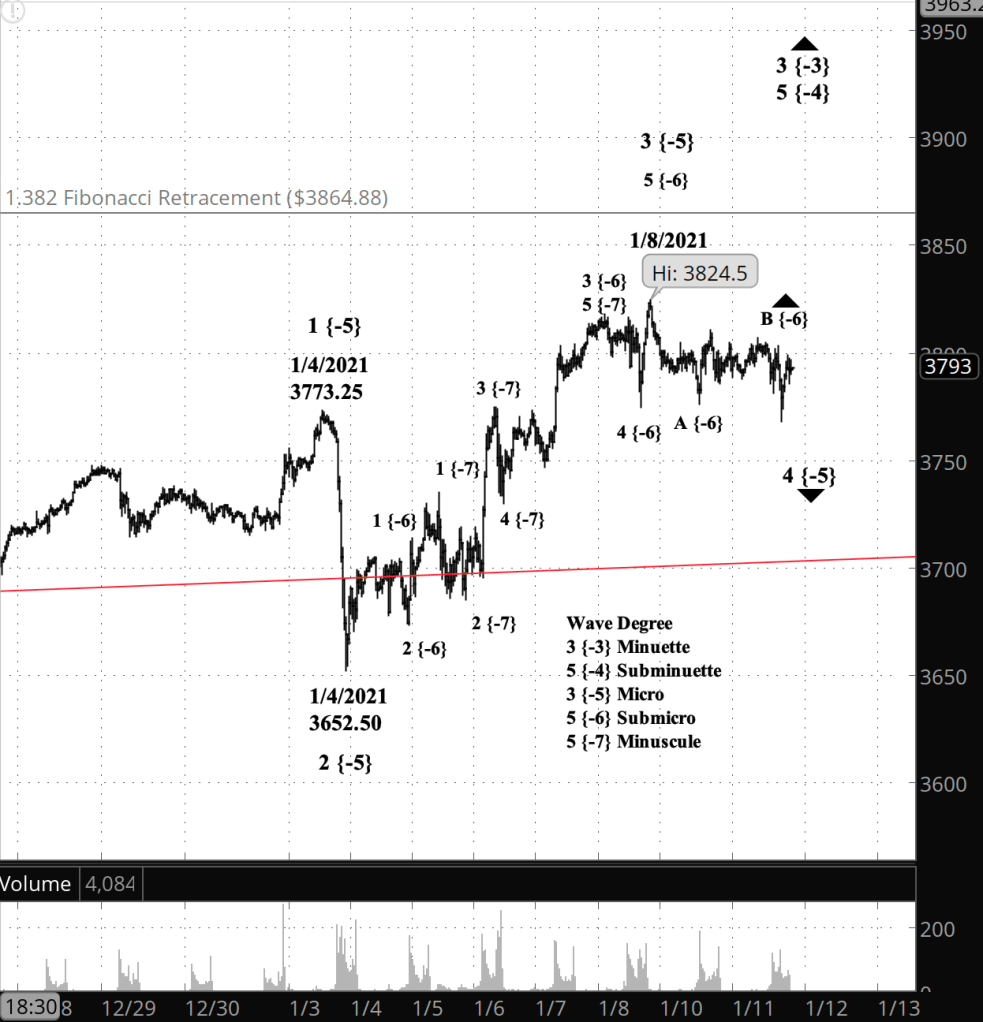
[S&P 500 E-mini futures at 9:51 a.m., 30-minute bars, with volume]
What does Elliott wave theory say? The large uptrend that began October 30 is wave 3 of Minuette degree. By my principle count, the reversal overnight marked the end of wave C of Submicro degree within wave 4 of Micro degree within wave 5 of Subminuette degree. It is the beginning of wave 5 of Micro degree.
An alternative count sees the correction as developing into a compound structure. Last night’s reversal under this view marks the beginning of wave X of Submicro degree, which will separate the A-B-C pattern just completed from another, not yet visible corrective pattern.
I’ve marked the chart as though the overnight low was indeed an end to Submicro C, but in fact it could still be underway. If that’s the case, then the down-pointing arrow that had appeared the chart’s “C {-6}” label will need to be restored, and likewise on the “4 {-5}” label.
My trading strategy. The next options entry period under my rules begins on January 26 and lasts through February 9, with February 2 being the midpoint, 45 days before expiration on March 19.
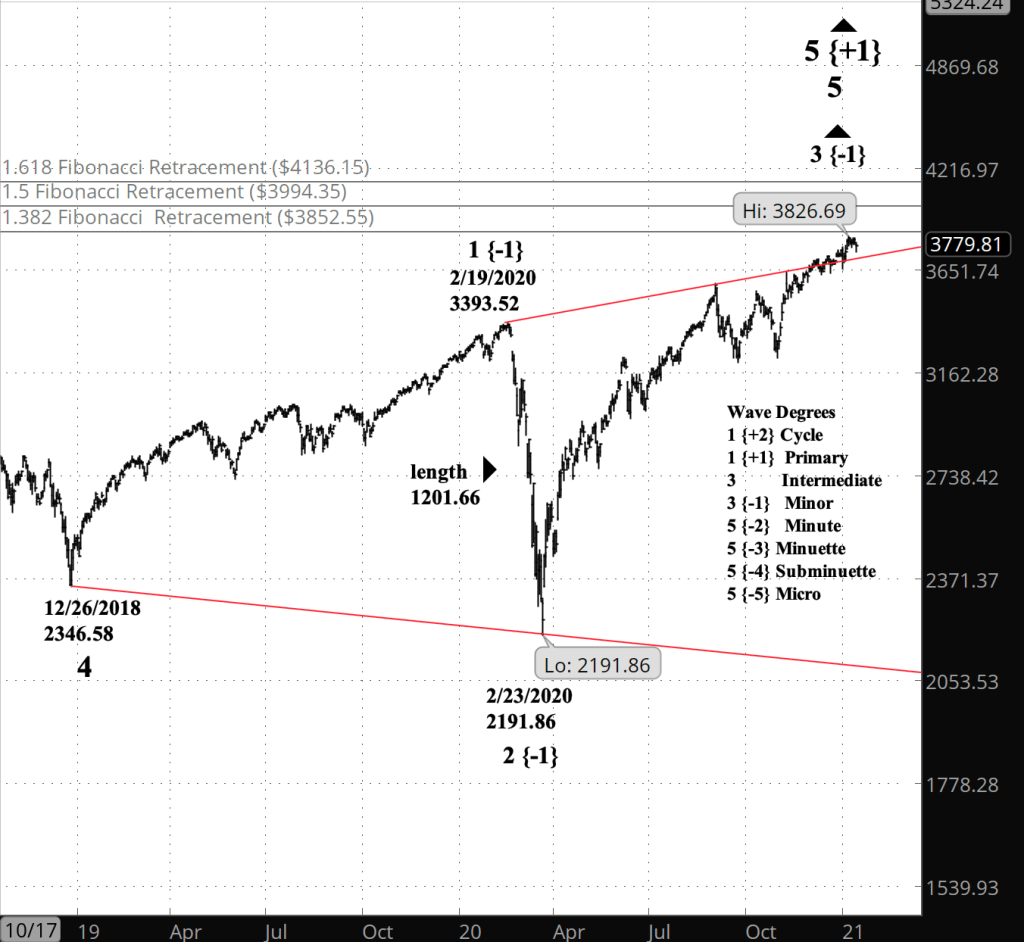
Half an hour before the closing bell. Close up, the S&P 500 has retraced nearly all of its decline. The question remains open whether the rise is the start of wave 5 of Micro degree or the beginning of a wave X, separating two corrective patterns.
Big picture, the S&P 500 remains below the 1.382% Fibonacci retracement level, which would be a typical turning point for the rise since February 23.
[S&P 500 index at 12:20 p.m., daily bars]
I’ve updated the near-term chart below. I’ve also corrected the last graf Elliott wave discussion to label the red line as the upper boundary (not lower) of the Diagonal Triangle that began in December 2018.
10:40 a.m. New York time
What’s happening now? The S&P 500 E-mini futures fell at the opening, entering the third and final segment of the correction that began January 8.
What does it mean? The end of the correction will be followed by either a rise that will be the end of the uptrend that began January 4, or will rise and form a second corrective pattern in a compound correction.
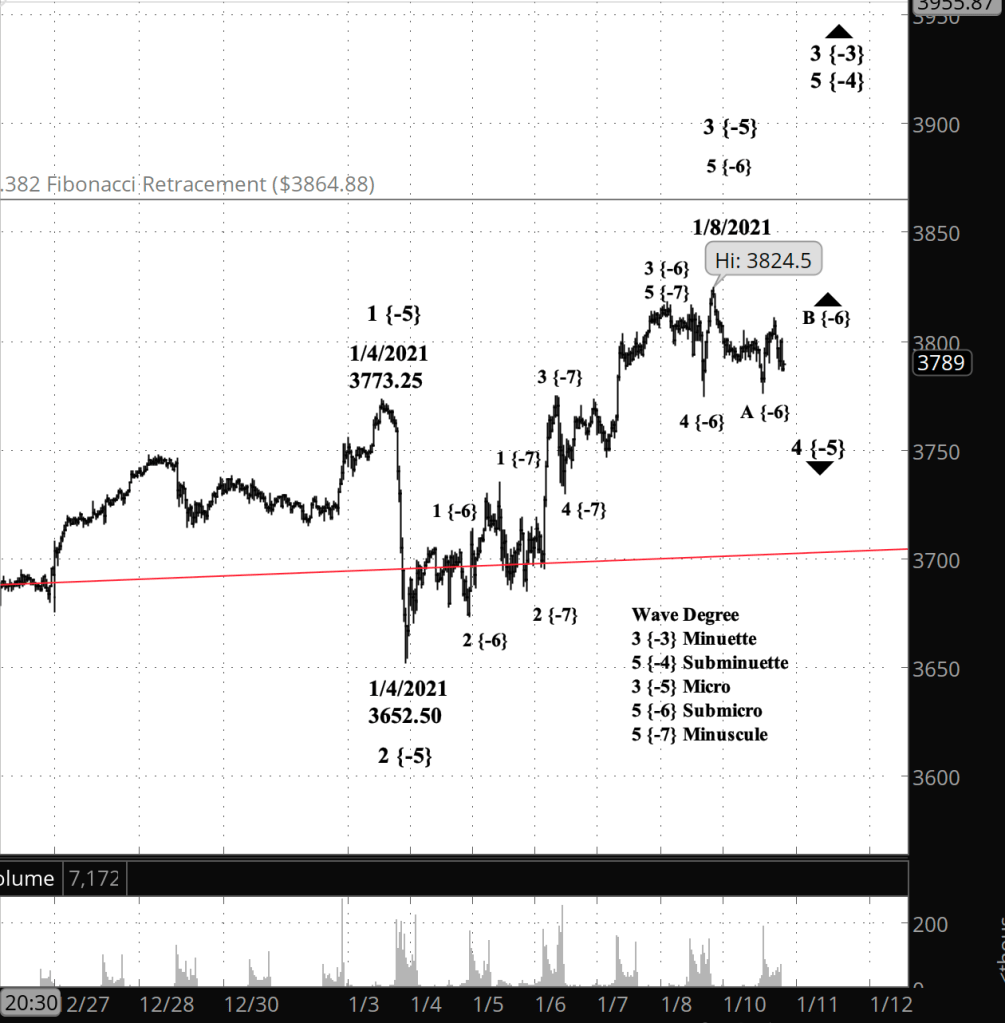
[S&P 500 E-Mini futures at 3:30 p.m., 30-minute bars, with volume]
What does Elliott wave theory say? The present wave down is wave C of Submicro degree within wave 4 of Micro degree. The chart contains an anomaly, discussed yesterday, that casts doubt on the wave 4 analysis. Wave B failed to retrace 90% the preceding wave A, which is required under the Elliott wave rules for a Flat pattern.
I can’t see a clear alternative count to the Flat pattern. So perhaps instead of a Flat, the correction is a Zigzag, with 5-3-5 as the pattern within the A, B and C waves.
In any case, the magnitude of the fall suggests that Subminuette wave C has begun, making the question moot. Moving on.
The target for the parent wave, the 4th of Minuette degree, is to move back below the red line, which the upper boundary of a Diagonal Triangle that began in December 2018. So we’re looking at the lower 3700s as a start.
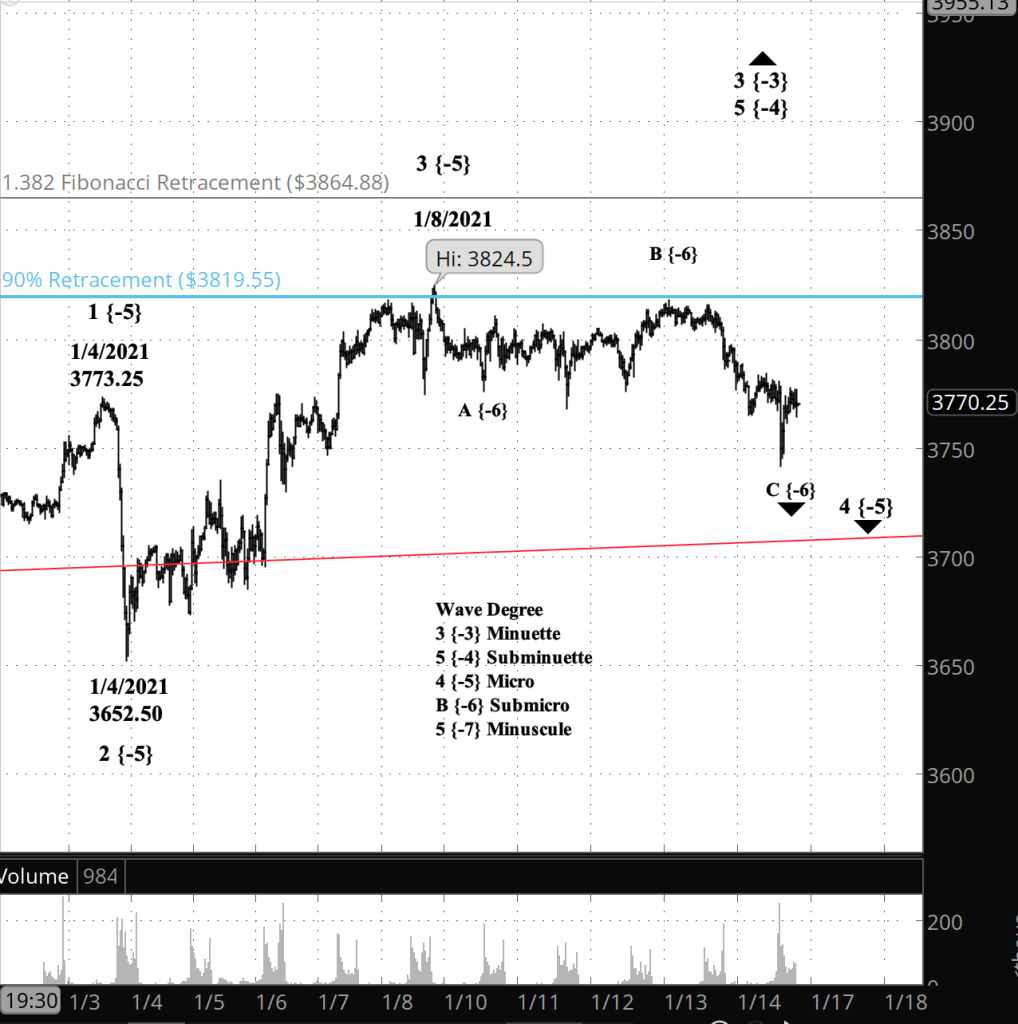
Half an hour before the closing bell. The S&P 500 E-mini futures dropped in trading today. The price of wave B of Submicro degree never retraced 90% of the preceding wave A, and that retracement is a firm necessity under the Elliott wave rules. So, we’re left with two choices: Either wave B is not yet complete, or the pattern we’re seeing isn’t a Flat structure. I’ve updated the chart below, marked on the assumption that wave B is still underway.
9:55 a.m. New York time
My position on IWM, which I exited on Tuesday, was a big loser. I’ve added a “lessons learned” section to the analysis, which says:
The loss on this trade was compounded by my rule that requires an exit 21 days before expiration for profitable positions. This position was unprofitable at 21 days, and grew even more unprofitable in the last weeks of its life. A better rule would be to exit 21 days before expiration whether a position is profitable or not.
The position would have lost under either version of the 21-day rule, but the loss would have been less had I exited earlier rather than later.
9:40 a.m. New York time
What’s happening now? The S&P 500 E-mini futures continue the middle wave of a Flat correction of the rise since January 4, having so far failed to reach a minimum retracement under the rules of Elliott wave analysis.
What does it mean? Once the correction is complete, I’m expecting a final rise to the upside, and then a downtrend.
What is the alternative? The form of the correction is ambiguous. If it’s not a Flat pattern, then the minimum retracement rule may not apply.
[S&P 500 E-mini futures at 3:30 p.m., 30-minute bars, with volume]
What does Elliott wave theory say? The middle wave in question is wave B of Submicro degree within wave 4 of Micro degree. The 4th wave is a downward correction, and the internal wave B is an upward correction within the downward correction. The beauty of Elliott wave analysis is that it recognizes that a chart contains trends within trends, in a fractal universe where patterns are built from smaller self-same patterns.
A B wave must retrace 90% of the preceding A wave. On this chart, that would be 3819.55 (blue line). Submicro B yesterday hit a high of 3817.75, leaving it 1.8 points below the mandatory retracement level.
My trading strategy. The next options I can trade under my rules will be the monthlies expiring March 21. The ideal entry date would be February 2, but I’ll settle for a date between January 26 and February 9. At this point my list of liquid ETFS are showing low implied volatility ranks; only a metal, SLV, has an IVR high enough to meet my standards.
Half an hour before the closing bell. The S&P 500 has traded in a very narrow range today. I’ve updated the chart below.
10 a.m. New York time
What’s happening now? The S&P 500 E-mini futures continue to work through an upward retracement within a downward correction that began January 8.
What does it mean? The retracement will be followed by a downward move that will mark the end of the correction, which will be followed by a final upward push, completing the rise that began January 4.
What is the alternative? If the correction develops as a compound pattern, then the retracement will be followed by an upward separator move and then second corrective pattern.
[S&P 500 E-mini futures at 3:30 p.m., 30-minute bars, with volume]
What does Elliott wave theory say? The S&P 500 is in wave B of Submicro degree within wave 4 of Micro degree within wave 5 of Subminuette degree, all within wave 3 of Minuette degree. Fourth waves tend to be shallow, and have a tendency to produce compound patterns. Although not always, and the only way to know if a compound pattern occurs is to wait and see.
I have updated IWM Analysis with results, and updated the S&P 500 chart, below, half an hour before the closing bell.
2:50 p.m. New York time
I’ve exited my short bear call options spreads on IWM, for a loss. I’ll update the entry analysis with results.
9:40 a.m. New York time
What’s happening now? The S&P 500 E-mini futures continue a shallow correction that began January 8. The price is presently working through the middle wave of the three-wave pattern.
What does it mean? The end of the downward correction will be followed by a push to a new high.
[S&P 500 E-mini futures at 3:30.m., 30-minute bars, with volume]
What does Elliott wave theory say? The correction is wave 4 of Micro degree within wave 5 of Minuette degree within wave 3 of Minuette degree. The present subwave is wave B of Submicro degree within a Flat structure. In Flats, wave B must retrace 90% of the preceding wave A.
My trading strategy. My short bear call options spread on IWM remain about 17 points above the profit zone. I shall make a decision about when to take the loss.
Half an hour before the closing bell. The S&P 500 E-mini futures continue their downward correction at a small degree. Wave A of Submicro degree is complete and the price is working through Submicro wave B of a three-wave pattern. I’ve updated the chart, below.
I shall continue to hold my losing IWM options, whose last day of trading is Friday, in the hope of a wave C decline on Tuesday.
9:35 a.m. New York time
What’s happening now? The S&P 500 E-mini futures continued to drop from the high of January 8.
What does it mean? The decline marks the first steps in what will likely be a shallow correction that will be followed by another high, and then a significant reversal.
What’s the alternative? If the price reverses today and moves above 3824.50, then the correction has not yet begun. The description of what will follow the correction stands in either case.
[S&P E-mini futures at 3:30 p.m., 30-minute bars, with volume]
What does Elliott wave theory say? I’ve marked up a near-term chart to trace course of the S&P 500 since late December. The count clearly shows that the January 8 was was the end of wave 3 of Micro degree. Within it, the peak marks the end of wave 5 of the Submicro degree. The correction now underway is a 4th wave of Micro degree. The typical 4th wave is a sideways correction, a Flat pattern in the parlance of Elliott wave analysis, with an internal structure of three wave — A, B and C — each with three subwaves.
My trading strategy. I’ll be looking again at my IWM options and make a decision on whether to exit or hold.
The S&P 500 E-mini futures are about eight points below their high of the day. I’ve updated the futures chart from this morning.
2:25 p.m. New York time
I mentioned this morning that I would make a decide whether to exit my short bear call options spreads on IWM today. The position expires on January 15, so by my rules I need to be out today or Monday.
Here are some numbers that frame the decision. The maximum loss calculated at entry was $1.08 per contract at expiration. The profit zone is a share price of $192 or below, marked on the chart with an alert. The present cost of exiting is $4.58 per contract.
(Apologies for the size of the chart. WordPress has gone into one of its recurring spells of graphs madness and won’t let me resize the image for a more normal presentation.)
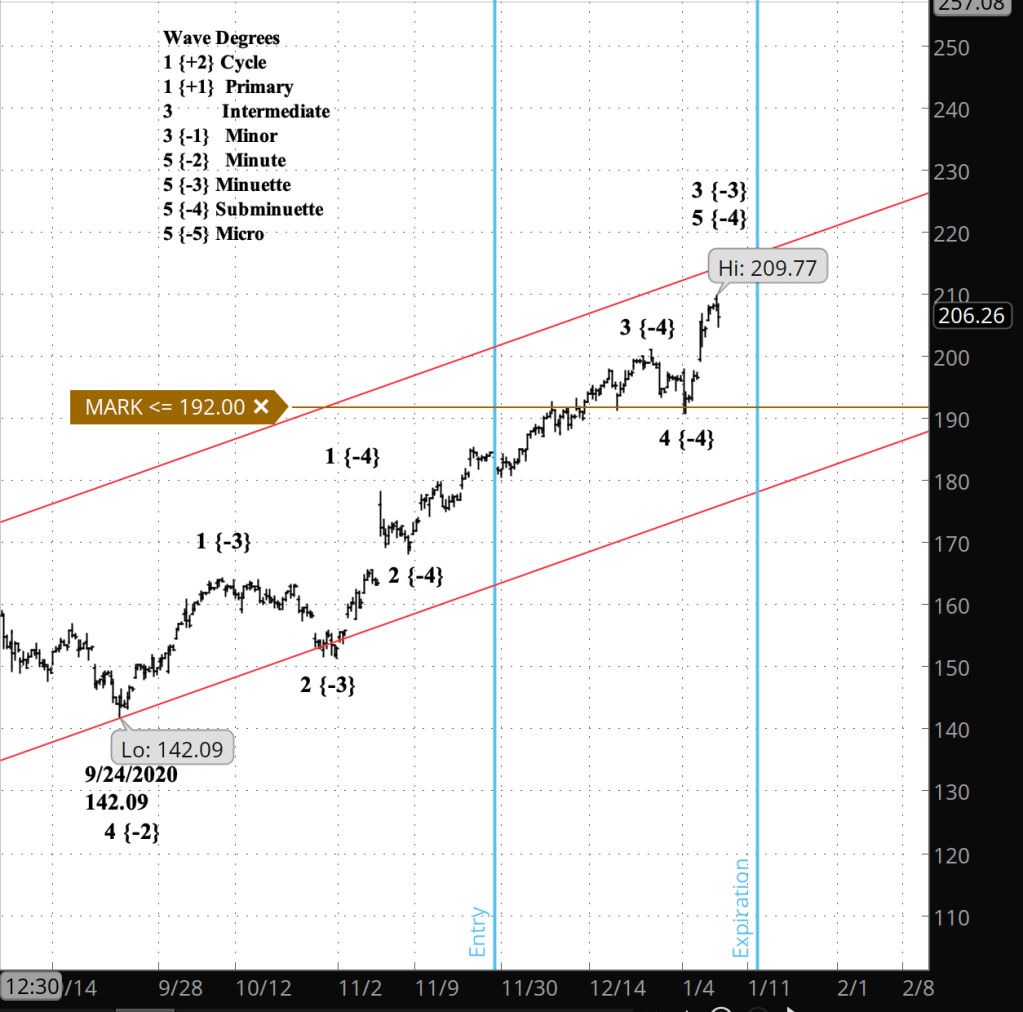
[IWM at 2:25 p.m., 3-hour bars]
If I exit now, the loss will be more than four times what I would pay at expiration. So — no brainer — I should continue to hold the position. The risk to holding is that the position could be assigned, leaving me with 100 short shares of IWM in my account. Not a tragedy but an inconvenience.
As IWM falls off from today’s high, 209.77, it could very well mean that wave 5 of Subminuette degree and its parent, wave 3 of Minuette degree have ended, and we have begun a Minuette wave 4 downward correction, which would benefit my position.
So, decision time. I shall continue to hold position until Monday, and decide then whether to exit or hold longer.
9:45 a.m. New York time
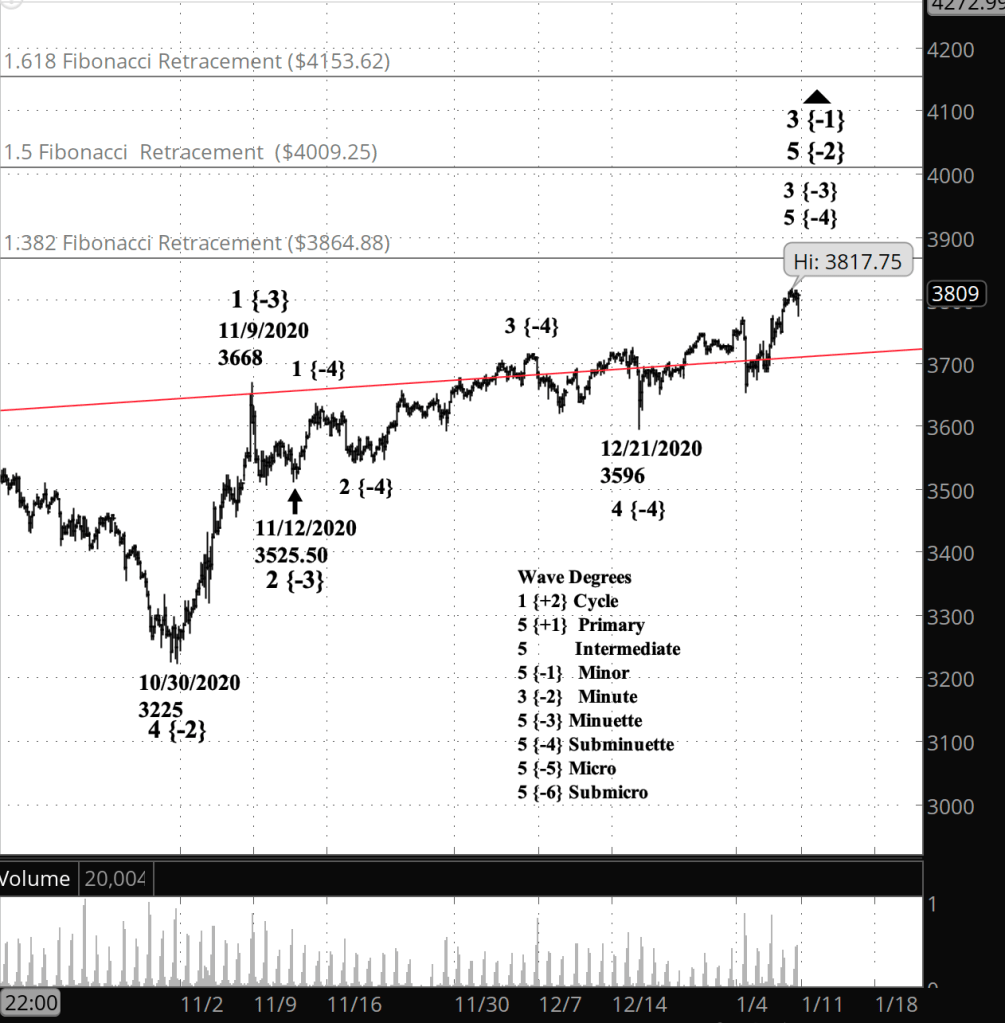
What’s happening now? The S&P 500 E-mini futures continued to rise overnight, to a high of 3817.75.
What does it mean? The rise is part of the end game of the upward movement that began October 30 from 3225. The current high is about 50 points below the lowest of three Fibonacci retracement levels that provide price targets. After the uptrend is complete, I expect a shallow correction and then another upward movement.
[S&P 500 E-mini futures at 3:30 p.m., 3-hour bars, with volume]
What does Elliott wave theory say? The rise that began October 30 is wave 5 of Minute degree. Internally, it is on wave 3 of Minuette degree, which in turn in wave 5 — the final wave — of Subminuette degree. Minuette 3 will be followed by a 4th wave correction, probably shallow and possibly time-consuming, if it turns into a compound structure.
My trading strategy. My short bear call spread options on IWM are in a losing position, with expiration only a week away. The question is, do I exit now or do I wait until Monday. I’ll make a decision on the question before the closing bell.
Half an hour before the closing bell. The S&P 500 price inched higher, reaching 3803.25 on the futures as the closing bell approached. I’ve updated the chart, below.
11 a.m. New York time
What’s happening now? The S&P 500 E-mini futures rose to within 65 points of the lowest of three Fibonacci retracement levels are my price targets for the rise that began in February. It has so far reached 3,800 as of this post.
What does it mean? Completion of the rise will mean that the middle wave, usually the strongest of the five-wave structure, has reached an end and will be followed by a decline, perhaps a shallow on.
[S&P 500 E-mini futures at 3:30 p.m., 3-hour bars, with volume]
What does Elliott wave theory say? Wave 3 of Minor degree began on February 23. The subwaves, from larger degree to smaller, are wave 5 of Minute degree, wave 3 of Minuette degree and wave 5 of Subminuette degree.
Completion of Minor wave 3 will be followed by Minor wave 4, the wave position that tends toward a shallow structure and one that link several corrective patterns together in a time-consuming compound correction.
30-minutes before the closing bell. The S&P 500 high set earlier today still stands. I’ve updated the chart, below.
2:05 p.m. New York time
The S&P 500 exceeded the January 4 high, which means that my alternative analysis has come into play. My expectations for subsequent moves, once Minuette wave 3 is complete, are unchanged. I’ve updated the chart.
9:50 a.m. New York time
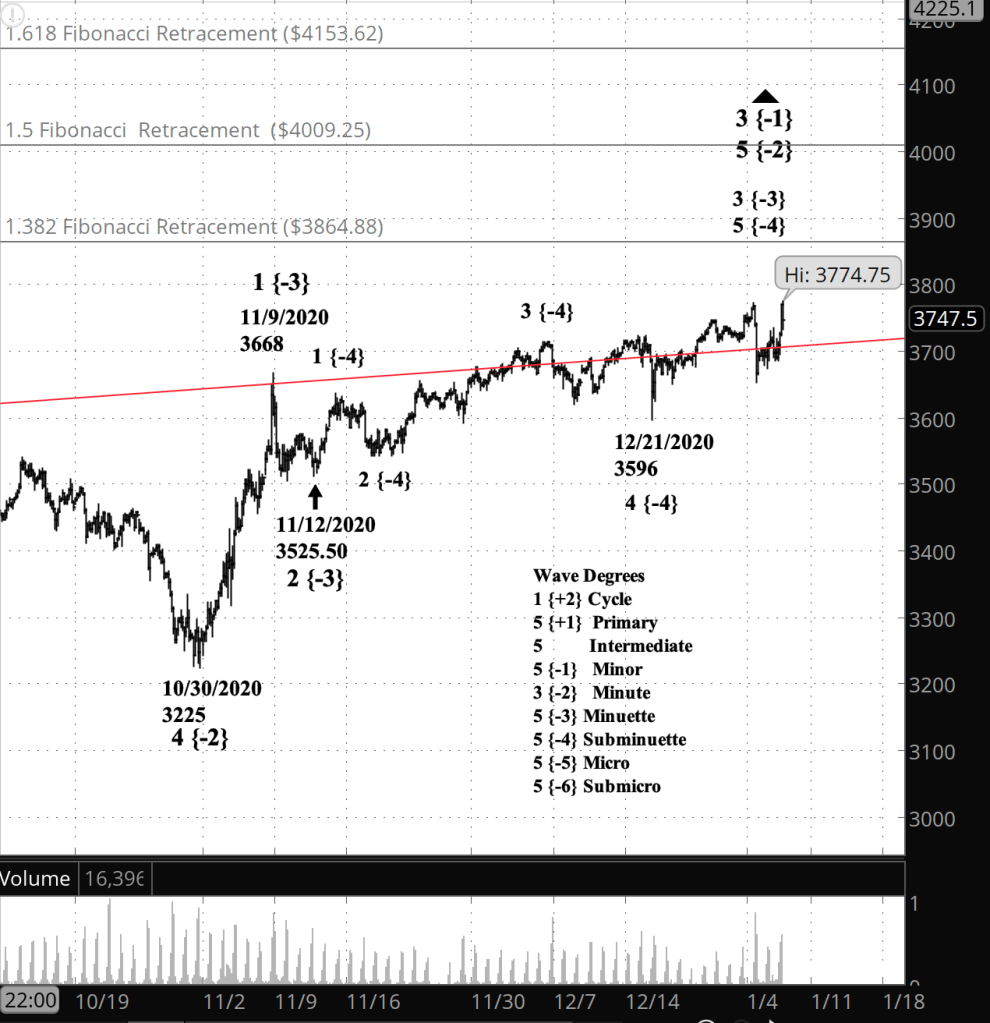
What’s happening now? The S&P 500 E-mini futures briefly peeked above the upper boundary of the Diagonal Triangle that has traced the course of the index and its derivatives since December 2018. The high, after the closing bell yesterday, was 3734, which is about 40 points below the January 4 turning point.
What does it mean? The S&P 500 is in the early stages of a declining correction that will carry down, probably, to the low 3500s.
What is the alternative? I won’t be entirely confident that the January 4 peak, 3773.25 on the futures, is in fact end of the rise since October 30 until I see the price push below the December 21 low, 3596. Also, even if the correction has has begun, it may well turn out to be a shallow one.
[S&P 500 E-mini futures at 3:30 p.m., 3-hour bars, with volume]
What does Elliott wave theory say? The January 4 peak marked the end of wave 3 of Minuette degree and the beginning of wave A of Subminuette degree within Minuette wave 4. The A wave will typically have five subwaves, at the Micro degree.
All of this is happening within rising wave 5 of Minute degree within rising wave 3 of Minor degree.
Fourth-wave corrections tend to be sideways moves and often will extend into compound patters. Minuette wave 4 may with us for awhile. It will be followed by Minuette wave 4, which may well rise to the 3860s, and as high as the 4150s.


You must be logged in to post a comment.