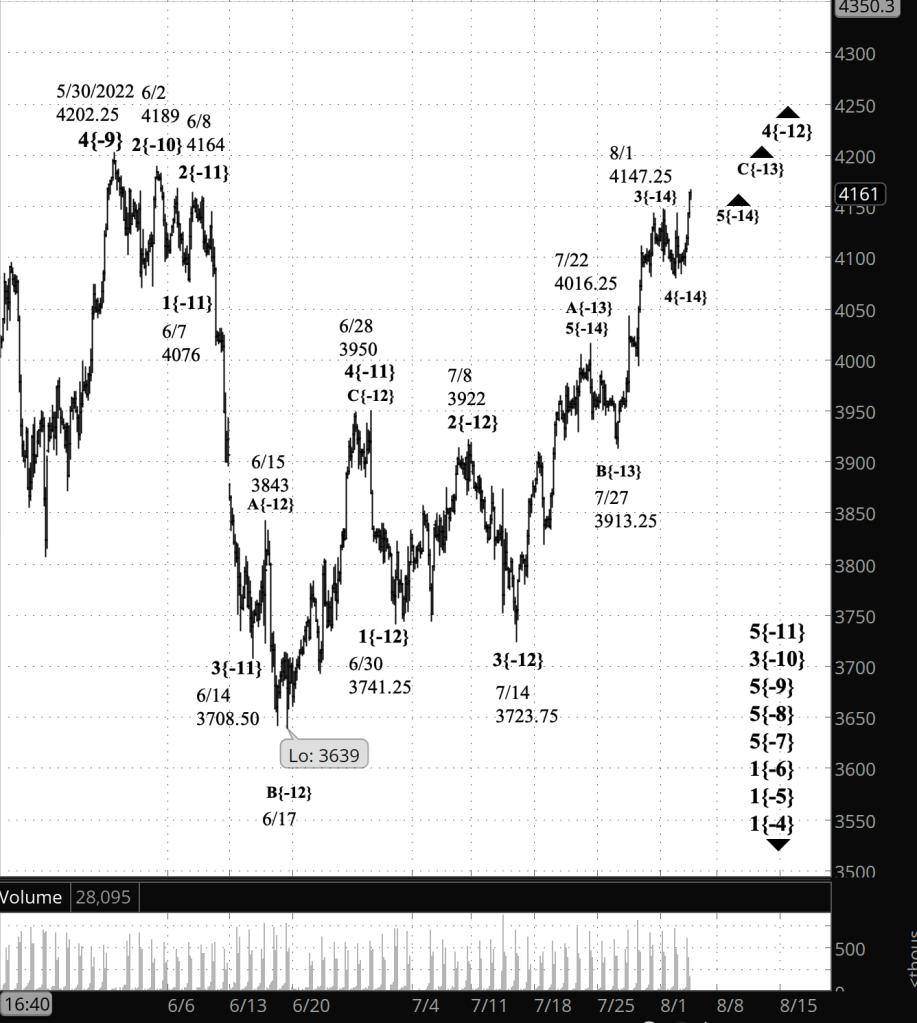
3:30 p.m. New York time
Half an hour before the closing bell. The S&P 500 has declined during the day from its morning high of 4188 on the futures. The middle leg of a rise that began on July 14 continues and is nearing its end. No change in the analysis. I’ve updated the chart.
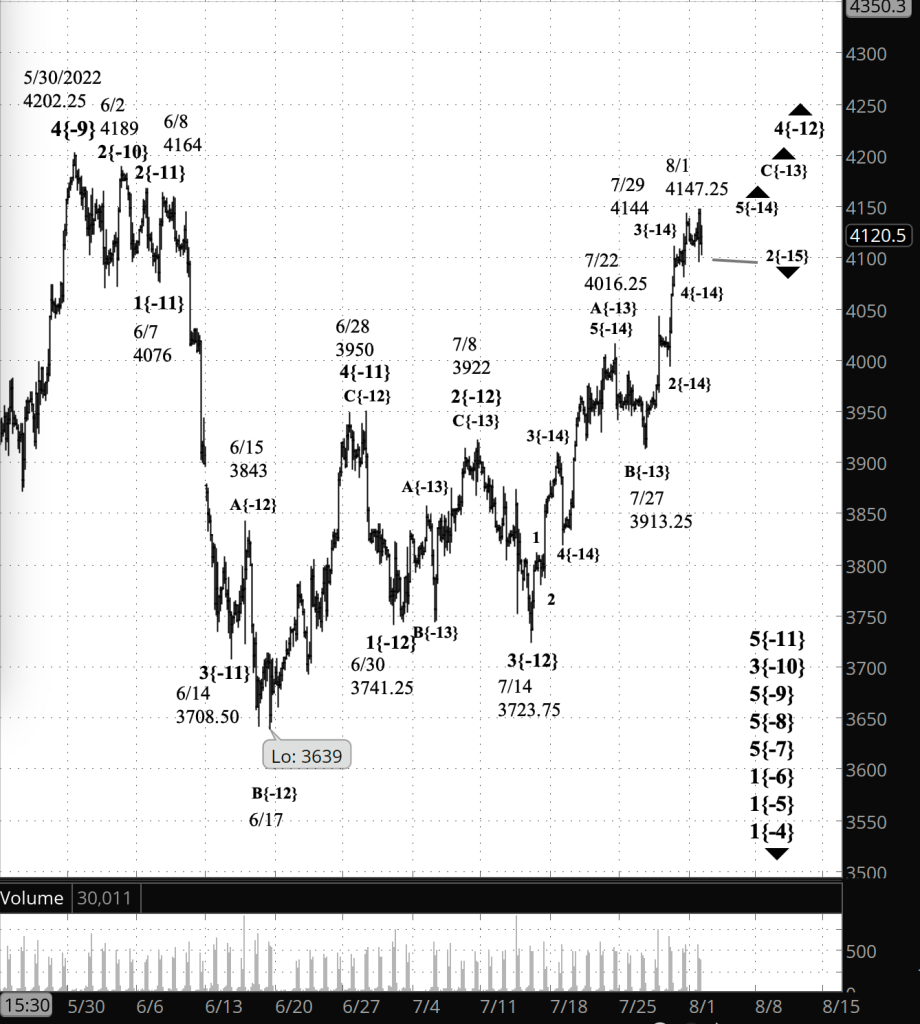
9:35 a.m. New York time
What’s happening now? The S&P 500 E-mini futures rose after trading resumed overnight, moving above the prior high to 4177.50.
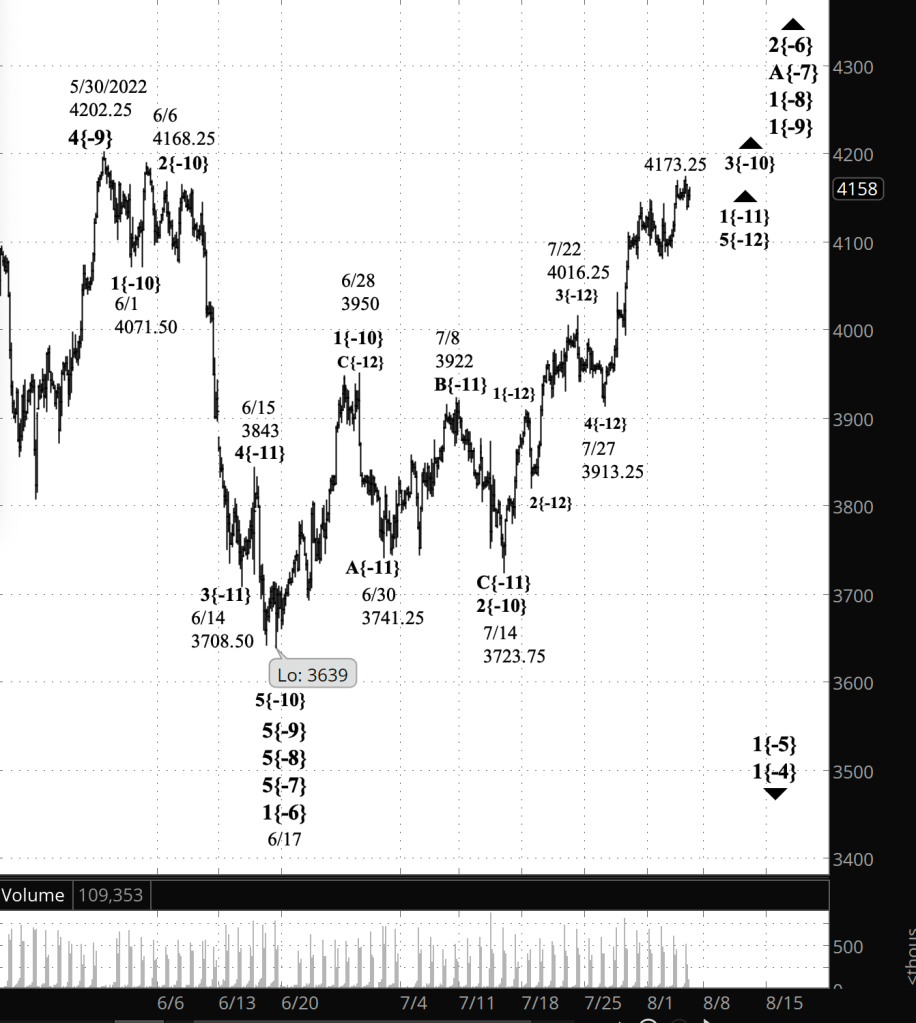
What does it mean? The last leg of an uptrend that began on July 18 is now it middle and most energetic segment. When complete, it will be followed by a downward correction and then a rise that most likely will reach a higher high. This is happening within a larger upward correction that began on June 17
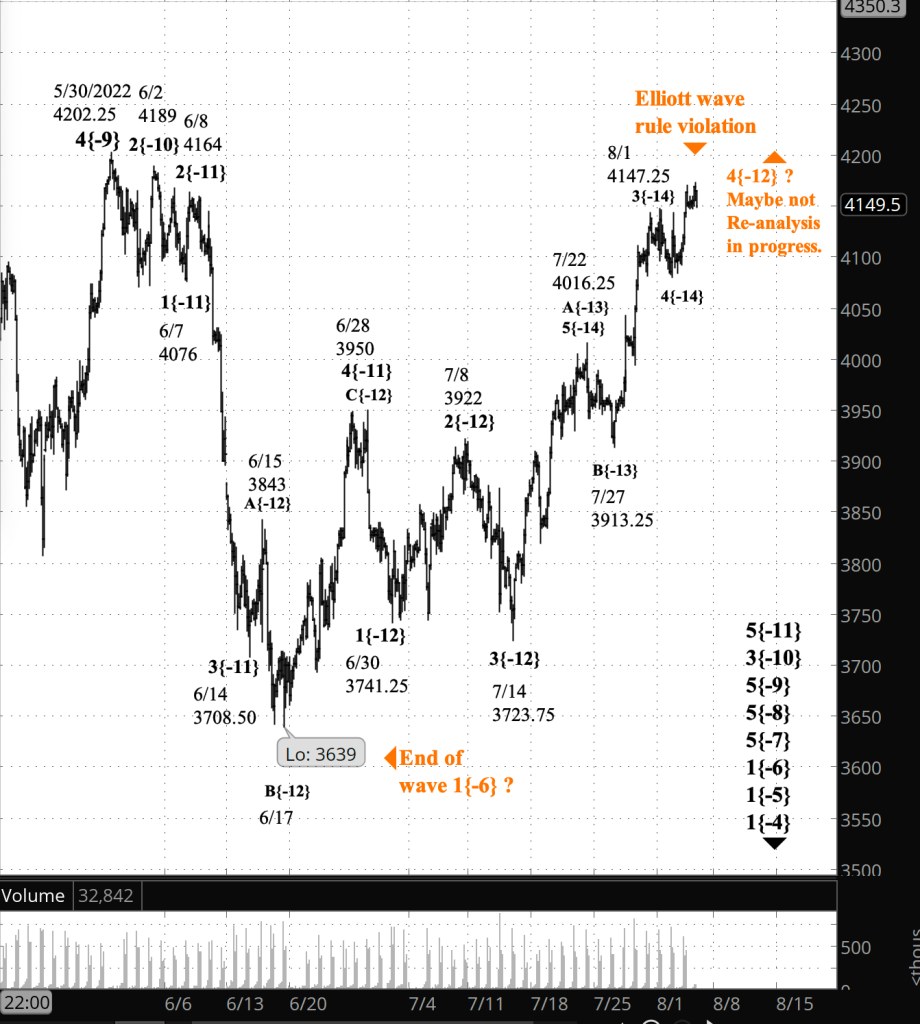
What are the alternatives? None at the present. Ambiguities will, I’m sure, develop.
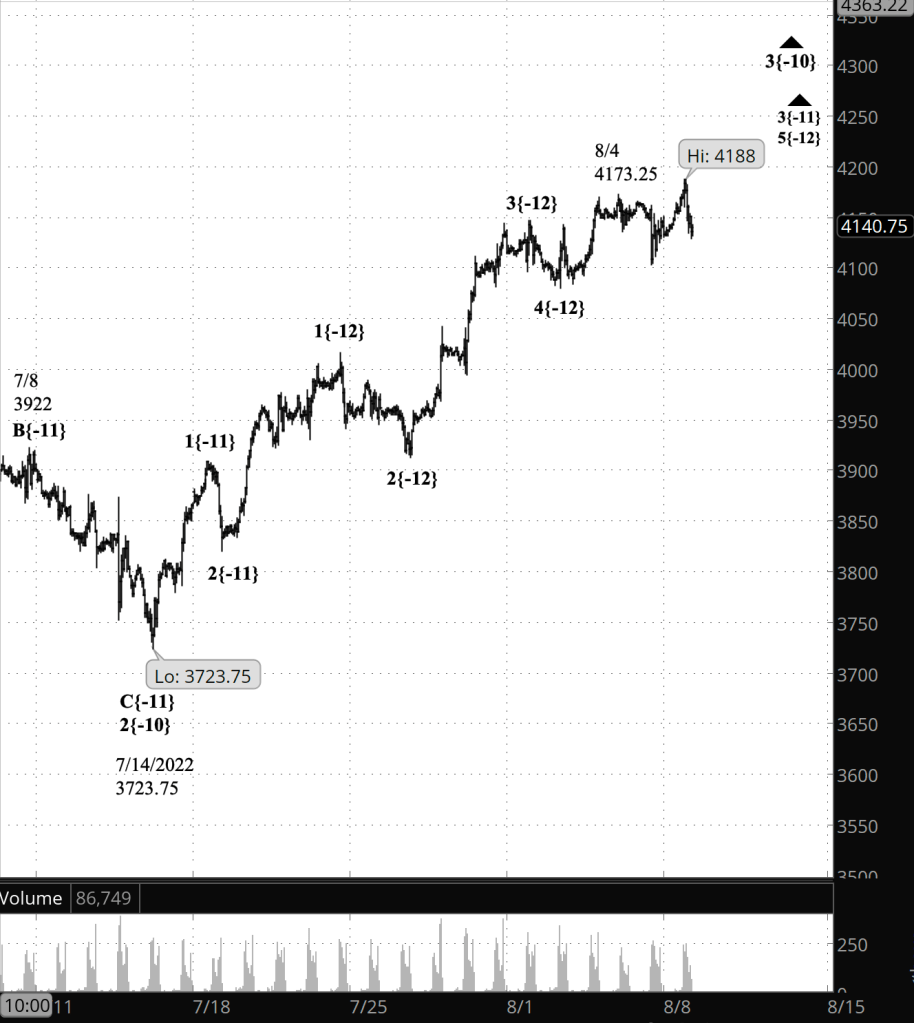
What does Elliott wave theory say? The rise that began on July 14, wave 3{-10}, is now in its middle and most energetic wave, 3{-11}, which in turn is in its final segment, wave 5{-12}.
We Are Here.
These are the waves currently in progress under my principal analysis. Each line on the list shows the wave number, with the subscript in curly brackets, the traditional degree name, the starting date, the starting price of the S&P 500 E-mini futures, and the direction of the wave.
- S&P 500 Index:
- 5{+3} Supercycle, 7/8/1932, 4.40 (up)
- 5{+2} Cycle, 12/9/1974, 60.96 (up)
- 5{+1} Primary, 3/6/2009, 666.79 (up)
- 5{0} Intermediate, 12/26/2018, 2346.58 (up)
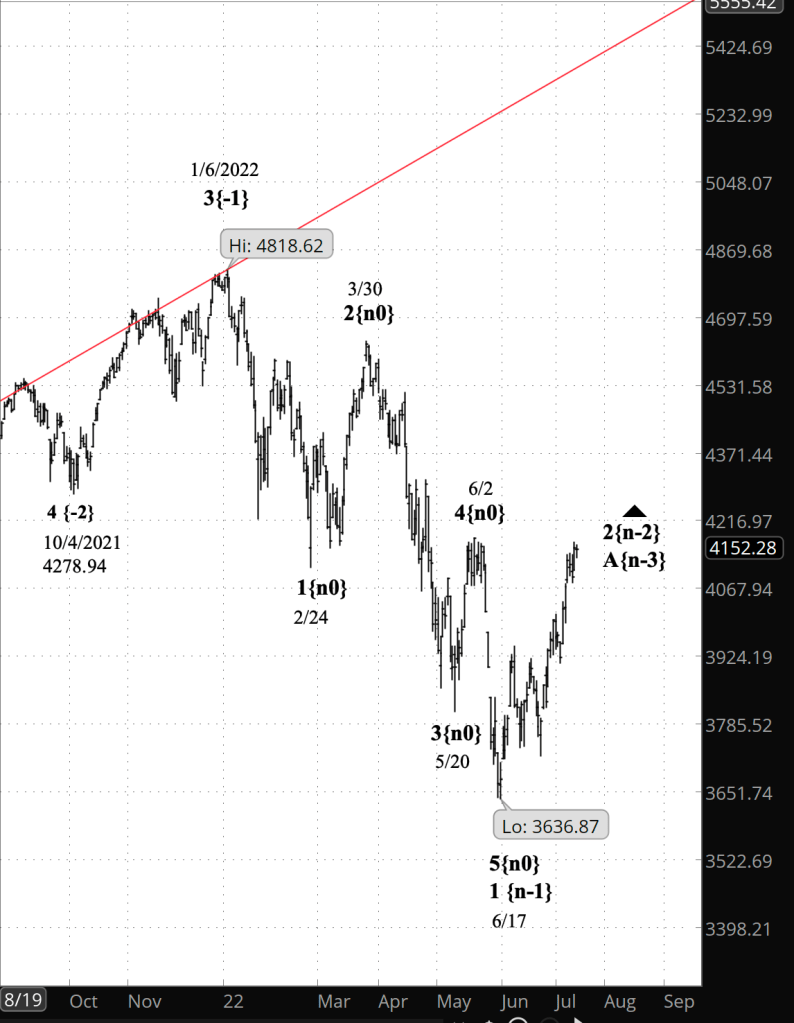
- 4{-1} Minor, 1/4/2022 4818.62 (down)
- 1{-2} Minute, 1/4/2022 4818.62 (down)
- S&P 500 Futures and index:
- 1{-3} Minuette, 1/4/2022, 4808.25 (down) (futures), 4818.62 (down) (index)
- S&P 500 Futures:
- 1{-4} Subminuette, 1/4/2022, 4808.25 (down)
- 1{-5} Micro, 1/4/2022, 4808.25 (down)
- 1{-6} Submicro, 1/4/2022, 4808.25 (down)
- 2{-7} Minuscule, 6/17/2022, 4631 (up)
- A{-8} Subminuscule, 6/17/2022, 4509 (up)
- 1{-9} Bitsy, 6/17/2022, 4202.25 (up)
- 3{-10} Subbitsy, 7/14/2022, 4189 (up)
- 3{-11} Deci, 7/2022, 4164 (up)
Learning and other resources. Elliott wave analysis provides context, not prophecy. As the 20th century semanticist Alfred Korzybski put it in his book Science and Sanity (1933), “The map is not the territory … The only usefulness of a map depends on similarity of structure between the empirical world and the map.” And I would add, in the ever-changing markets, we can judge that similarity of structure only after the fact.
See the menu page Analytical Methods for a rundown on where to go for information on Elliott wave analysis.
By Tim Bovee, Portland, Oregon, August 8, 2022
Disclaimer
Tim Bovee, Private Trader tracks the analysis and trades of a private trader for his own accounts. Nothing in this blog constitutes a recommendation to buy or sell stocks, options or any other financial instrument. The only purpose of this blog is to provide education and entertainment.
No trader is ever 100 percent successful in his or her trades. Trading in the stock and option markets is risky and uncertain. Each trader must make trading decisions for his or her own account, and take responsibility for the consequences.
License
All content on Tim Bovee, Private Trader by Timothy K. Bovee is licensed under a Creative Commons Attribution-ShareAlike 4.0 International License.
Based on a work at www.timbovee.com.


You must be logged in to post a comment.