Trader’s Notebook

12:30 p.m. New York time

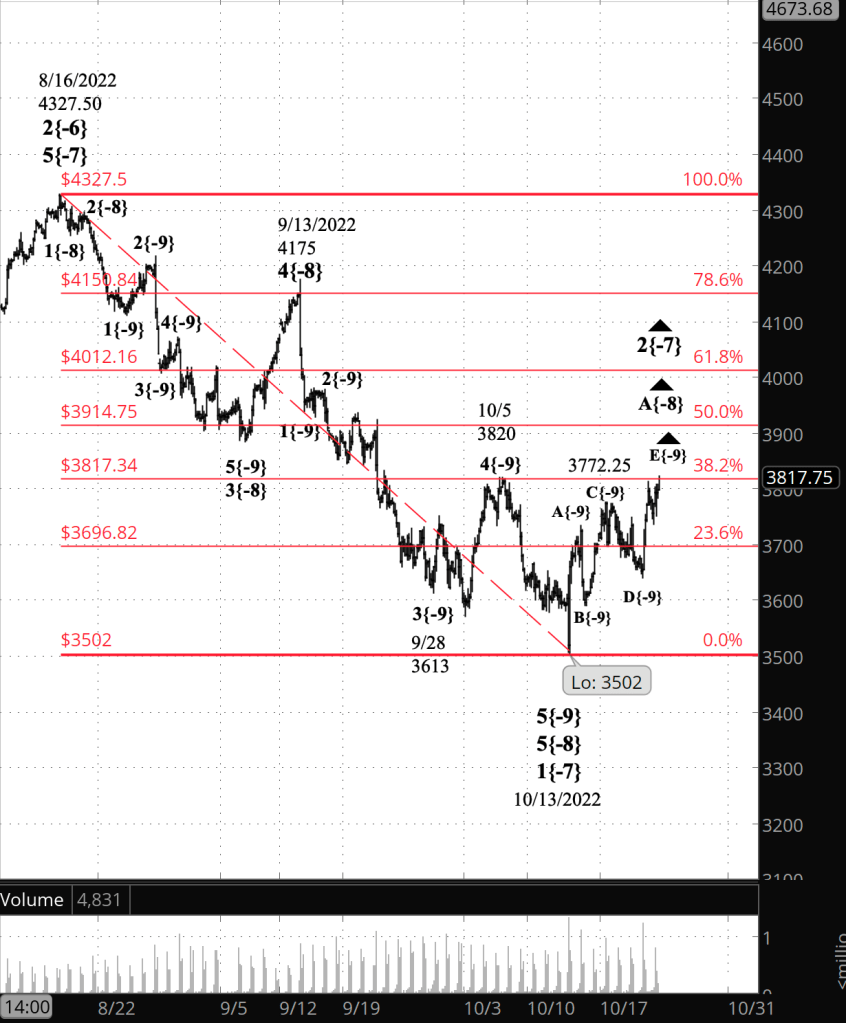
Half an hour before the closing bell. The S&P 500 continued to rise during the session, so far reaching 3870 on the futures, midway between the 38.2% and the 50% Fibonacci retracement levels.

No change in the analysis. I’ve updated the chart.

10:25 a.m. New York time

BA earnings play entry. I’ve entered a short bear call vertical spread on BA, using options that trade for the last time on November 18, and have posted an analysis of the trade.

9:43 a.m. New York time

Running a few minutes late. The analysis changed at the opening bell.

What’s happening now? The S&P 500 E-mini futures fell from the peak, 3822, attained late in yesterday’s session, and reached into the 3790s before rising again at the opening bell, rising above yesterday’s high — 3823.75 at the time the chart below was captured..

What does it mean? The final wave within a five-wave rise, within the first leg of an upward correction that began on October 13, is underway and nearing completion.

What are the alternatives? Of equal likelihood, any peak today marks the end of the fifth wave described above and of the first leg of the upward correction. The second, middle leg of the correction has begun its descent.

So which is it? The first leg of the upward correction has met all of the requirements of form identified in Elliott wave analysis. But within that form, the first leg can still have some distance to go before reaching its end. Before the new high this morning, I had written, “If the price reverses and moves above 3822, then the principal analysis is correct.” It did, and the principal analysis is correct. If the price were to reverse today, then the further it declines, the more likely it is that the alternative analysis is correct.

[S&P 500 E-mini futures at 3:30 p.m., 160-minute bars, with volume]

What does Elliott wave theory say? Under the principal analysis, the present location is rising wave E{-9} within rising wave A{-8} within rising wave 2{-7}. Under the alternative analysis, wave E{-9} and its parent, wave A{-8}, both ended late in yesterday’s session, and declining wave B{-8} has begun.

Wave B{-8} will have three subwaves internally and will be followed by the final wave of the corrective pattern, wave C{-8}, which will have five subwaves within it.

Once wave B{-8} begins, we’ll have a better sense of how high, at a minimum, the final wave, C{-8} of the wave 2{-7} correction might go.

The distance wave C travels depends upon wave B. Wave 2{-7} is taking the form of a Zigzag. We know this because wave A{-8} had five waves internally.

The B wave in a Zigzag must remain above the starting point of the preceding A wave — 3502 in this case. Moreover, the B wave in a Zigzag typically will retrace 38% to 79% of the A wave.

This paragraph was written before the opening bell reversal to the upside. So mentally add a point or two to the calculation result to account for the 3823.75 high set this morning. If the alternative scenario is correct and yesterday’s high, 3822, is the end of wave A, then wave A{-8} traveled 320 points. A shallow 38% retracement would bring wave B{-8} down to 3700. A more robust 79% retracement would mean wave B{-8} would end around 3569.

Wave 2{-7}, when complete, will be followed by downtrending and energetic wave 3{-7}, which will carry the price below the start of the correction, most likely significantly below that level.

All of this is happening within downtrending wave 3{-6}, which began on August 16 from 4327.50, which is enclosed by a series of increasingly larger nested 1st waves, up to wave 1{-2}, which in turn is a subwave of wave 4{-1}, which began on January 4 from 4808.25. Wave 4{-1} is the next to the last wave within an expanding Diagonal Triangle that began on December 26, 2018, from 2346.58 on the index.

Bottom line: Enjoy the upward autumn for the brief time that it lasts, because a deep downward movement lies ahead. Winter is coming.

We Are Here.

These are the waves currently in progress under my principal analysis. Each line on the list shows the wave number, with the subscript in curly brackets, the traditional degree name, the starting date, the starting price of the S&P 500 E-mini futures, and the direction of the wave.

  • S&P 500 Index:
  • 5{+3} Supercycle, 7/8/1932, 4.40 (up)
  • 5{+2} Cycle, 12/9/1974, 60.96 (up)
  • 5{+1} Primary, 3/6/2009, 666.79 (up)
  • 5{0} Intermediate, 12/26/2018, 2346.58 (up)
  • 4{-1} Minor, 1/4/2022 4818.62 (down)
  • 1{-2} Minute, 1/4/2022 4818.62 (down)
  • S&P 500 Futures and index:
  • 1{-3} Minuette, 1/4/2022, 4808.25 (down) (futures), 4818.62 (down) (index)
  • S&P 500 Futures:
  • 1{-4} Subminuette, 1/4/2022, 4808.25 (down)
  • 1{-5} Micro, 1/4/2022, 4808.25 (down)
  • 3{-6} Submicro, 8/16/2022, 4327.50 (down)
  • 2{-7} Minuscule, 10/13/2022, 3502 (up)
  • A{-8} Subminuscule, 10/13/2022, 3502 (up)

Learning and other resources. Elliott wave analysis provides context, not prophecy. As the 20th century semanticist Alfred Korzybski put it in his book Science and Sanity (1933), “The map is not the territory … The only usefulness of a map depends on similarity of structure between the empirical world and the map.” And I would add, in the ever-changing markets, we can judge that similarity of structure only after the fact.

See the menu page Analytical Methods for a rundown on where to go for information on Elliott wave analysis.

By Tim Bovee, Portland, Oregon, October 25, 2022

Disclaimer

Tim Bovee, Private Trader tracks the analysis and trades of a private trader for his own accounts. Nothing in this blog constitutes a recommendation to buy or sell stocks, options or any other financial instrument. The only purpose of this blog is to provide education and entertainment.

No trader is ever 100 percent successful in his or her trades. Trading in the stock and option markets is risky and uncertain. Each trader must make trading decisions for his or her own account, and take responsibility for the consequences.

License
Creative Commons License

All content on Tim Bovee, Private Trader by Timothy K. Bovee is licensed under a Creative Commons Attribution-ShareAlike 4.0 International License.

Based on a work at www.timbovee.com.
Trader’s Notebook

3:30 p.m. New York time

Half an hour before the closing bell. The S&P 500 futures rose during the session, moving past the 38.2% Fibonacci retracement level, to a high today of 3822 so far, and peaking above the overnight low. No change in the analysis. I’ve updated the upper chart, showing the futures from last August to the present.

9:35 a.m. New York time

What’s happening now? The S&P 500 E-mini futures rose after trading resumed overnight, reaching 3813.25 before pulling back and then beginning a second upward trip.

What does it mean? The overnight rise carried the price to the 38.2% Fibonacci retracement level, ending the middle wave of a five-wave rise. The second rise is the final wave in the series. This is happening within the initial wave of an upward correction that began on October 13 from 3502. (The Fibonacci ladder is on the futures chart, in red.)

What are the alternatives? The second rise could be part of a pullback between the middle and final waves of the series. Under this scenario, the final wave has not yet begun.

[S&P 500 E-mini futures at 3:30 p.m., 160-minute bars, with volume]

What does Elliott wave theory say? Under the principal analysis, the overnight peak was the end of wave C{-10}, the middle wave within wave E{-9}, the final wave of the initial wave, A{-8} within an upward correction, wave 2{-7}. The subsequent decline was declining wave D{-10}, and the rise that followed, wave E{-10}, which is still underway.

Under the alternative analysis, the subsequent decline was wave D{-10}, as in the principal analysis, but it is only the first wave within D{-10}. The rise that followed is the second wave within wave D{-10}, with one more declining wave to needed to carry wave D{-10} to completion.

Wave 2{-7}’s parent wave is downtrending wave 3{-6}, the subwave of a series of nested first waves ranging in degree from the smallest, wave 1{-5}, to the largest, wave 1{-2}. The series are subwaves of wave 4{-1}, the next-to-the-last wave within wave, 5{-0}, an expanding diagonal triangle that began on December 26, 2018.

[S&P 500 index at 9:33 a.m., 3-day bars, with volume]

We Are Here.

These are the waves currently in progress under my principal analysis. Each line on the list shows the wave number, with the subscript in curly brackets, the traditional degree name, the starting date, the starting price of the S&P 500 E-mini futures, and the direction of the wave.

  • S&P 500 Index:
  • 5{+3} Supercycle, 7/8/1932, 4.40 (up)
  • 5{+2} Cycle, 12/9/1974, 60.96 (up)
  • 5{+1} Primary, 3/6/2009, 666.79 (up)
  • 5{0} Intermediate, 12/26/2018, 2346.58 (up)
  • 4{-1} Minor, 1/4/2022 4818.62 (down)
  • 1{-2} Minute, 1/4/2022 4818.62 (down)
  • S&P 500 Futures and index:
  • 1{-3} Minuette, 1/4/2022, 4808.25 (down) (futures), 4818.62 (down) (index)
  • S&P 500 Futures:
  • 1{-4} Subminuette, 1/4/2022, 4808.25 (down)
  • 1{-5} Micro, 1/4/2022, 4808.25 (down)
  • 3{-6} Submicro, 8/16/2022, 4327.50 (down)
  • 2{-7} Minuscule, 10/13/2022, 3502 (up)
  • A{-8} Subminuscule, 10/13/2022, 3502 (up)

Learning and other resources. Elliott wave analysis provides context, not prophecy. As the 20th century semanticist Alfred Korzybski put it in his book Science and Sanity (1933), “The map is not the territory … The only usefulness of a map depends on similarity of structure between the empirical world and the map.” And I would add, in the ever-changing markets, we can judge that similarity of structure only after the fact.

See the menu page Analytical Methods for a rundown on where to go for information on Elliott wave analysis.

By Tim Bovee, Portland, Oregon, October 24, 2022

Disclaimer

Tim Bovee, Private Trader tracks the analysis and trades of a private trader for his own accounts. Nothing in this blog constitutes a recommendation to buy or sell stocks, options or any other financial instrument. The only purpose of this blog is to provide education and entertainment.

No trader is ever 100 percent successful in his or her trades. Trading in the stock and option markets is risky and uncertain. Each trader must make trading decisions for his or her own account, and take responsibility for the consequences.

License
Creative Commons License

All content on Tim Bovee, Private Trader by Timothy K. Bovee is licensed under a Creative Commons Attribution-ShareAlike 4.0 International License.

Based on a work at www.timbovee.com.

Trader’s Notebook

3:30 p.m. New York time

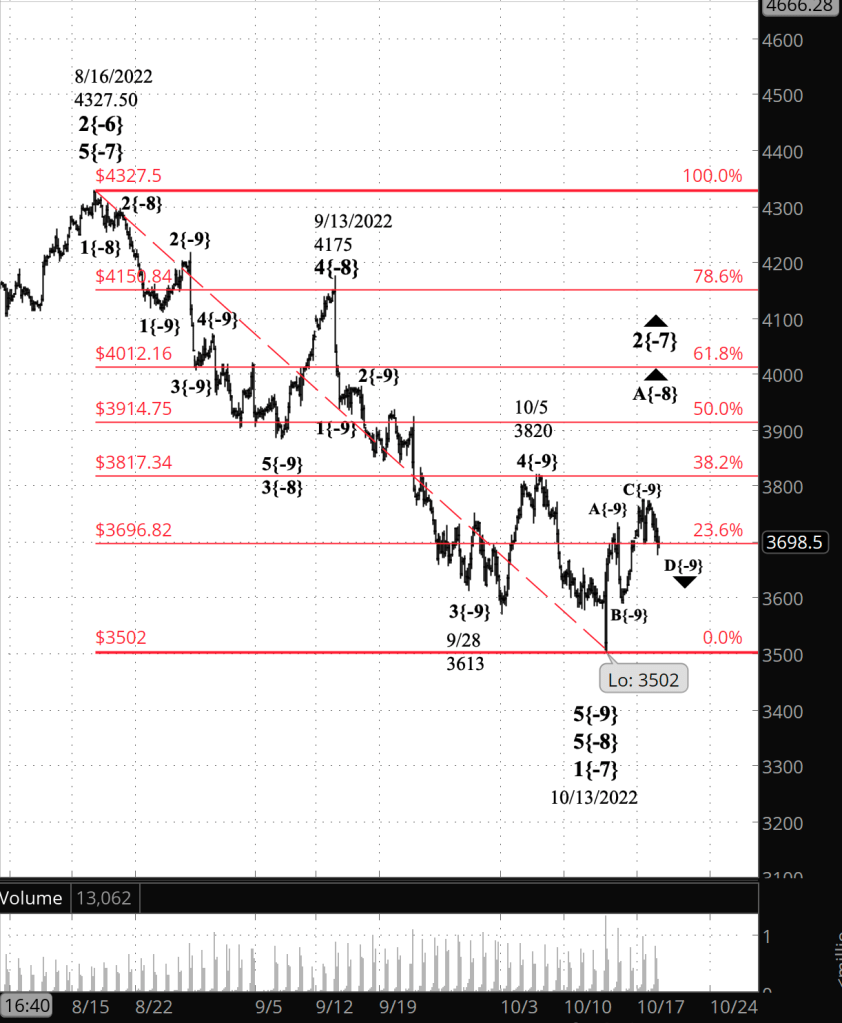
Half an hour before the closing bell. The S&P 500 futures has continued to rising during the session, reaching the 3760s. Within the first wave of an upward correction that began on October 13, the final wave has begun its rise. In the analytical language of Elliott wave analysis, rising wave E{-9} within rising wave A{-8}, both within the upward correction, wave 2{-7}, are all underway. Aside from the completion of wave D{-9}, this morning’s analysis stands. I’ve updated the chart.

9:41 a.m. New York time

What’s happening now? The S&P 500 E-mini futures declined in overnight trading, reaching the 3640s in what is the furthest drop since the sideways trend began earlier this week, and then rose back to the 23.6% Fibonacci retracement level. (The Fibonacci ladder is shown in red on the chart.)

What does it mean? The further the decline, the greater the likelihood that the principal analysis of the last few days is correct: The next to the last segment within the first leg of an upward correction is underway. The correction began on October 13. The decline will be followed by the final wave within the first leg of the correction and likely will carry the price above 3772.25, the high so far within the correction, and perhaps significantly above that level.

What are the alternatives? However, the reversal today to a new high within the correction keeps the alternative analysis alive: The low marks the start of the rising final wave within the correction.

[S&P 500 E-mini futures at 3:30 p.m., 180-minute bars, with volume]

What does Elliott wave theory say? Now underway, declining wave D{-9} within rising wave A{-8} within an upward correction, wave 2{-7}. The preceding wave C{-9} approached the 38.2% Fibonacci retracement level but fell short.The subsequent wave D{-9} fell to the 23.6% retracement level, paused for an internal correction, and then fell further.

Under the alternative analysis, wave D{-9} ended at the overnight low, 3641.50, and rising wave E{-9}, the final wave within wave A{-8}, is now underway.

Wave 2{-7} is taking the form of a Zigzag and will have three waves internally. Rising wave A{-8} is presently underway, wave B{-8} will decline, taking back a portion of the A-wave rise, and wave C{-8} will carry the price still higher. Second waves generally retrace a great deal of the preceding 1st wave, and it would be unsurprising if wave C{-8} and its parent, wave 2{-7}, ended at a Fibonacci retracement level of 61.8% (4012) or 78.6% (4151).

Wave 2{-7} is correcting wave 1{-7}, which began on August 16 from 4327.50, and that starting point is an absolute ceiling on how high wave 2{-7} can go.

This is happening within declining wave 3{-6} within wave 1{-5}, and a series of declining wave up to wave 4{-1}. So if anyone were to ask for a one-word description of the market, I would thoughtfully reply, “Down”. The decline that began on January 4, wave 4{-1} within an expanding Diagonal Triangle that began in December 2018, has a ways further to go.

We Are Here.

These are the waves currently in progress under my principal analysis. Each line on the list shows the wave number, with the subscript in curly brackets, the traditional degree name, the starting date, the starting price of the S&P 500 E-mini futures, and the direction of the wave.

  • S&P 500 Index:
  • 5{+3} Supercycle, 7/8/1932, 4.40 (up)
  • 5{+2} Cycle, 12/9/1974, 60.96 (up)
  • 5{+1} Primary, 3/6/2009, 666.79 (up)
  • 5{0} Intermediate, 12/26/2018, 2346.58 (up)
  • 4{-1} Minor, 1/4/2022 4818.62 (down)
  • 1{-2} Minute, 1/4/2022 4818.62 (down)
  • S&P 500 Futures and index:
  • 1{-3} Minuette, 1/4/2022, 4808.25 (down) (futures), 4818.62 (down) (index)
  • S&P 500 Futures:
  • 1{-4} Subminuette, 1/4/2022, 4808.25 (down)
  • 1{-5} Micro, 1/4/2022, 4808.25 (down)
  • 3{-6} Submicro, 8/16/2022, 4327.50 (down)
  • 2{-7} Minuscule, 10/13/2022, 3502 (up)
  • A{-8} Subminuscule, 10/13/2022, 3502 (up)

Learning and other resources. Elliott wave analysis provides context, not prophecy. As the 20th century semanticist Alfred Korzybski put it in his book Science and Sanity (1933), “The map is not the territory … The only usefulness of a map depends on similarity of structure between the empirical world and the map.” And I would add, in the ever-changing markets, we can judge that similarity of structure only after the fact.

See the menu page Analytical Methods for a rundown on where to go for information on Elliott wave analysis.

By Tim Bovee, Portland, Oregon, October 21, 2022

Disclaimer

Tim Bovee, Private Trader tracks the analysis and trades of a private trader for his own accounts. Nothing in this blog constitutes a recommendation to buy or sell stocks, options or any other financial instrument. The only purpose of this blog is to provide education and entertainment.

No trader is ever 100 percent successful in his or her trades. Trading in the stock and option markets is risky and uncertain. Each trader must make trading decisions for his or her own account, and take responsibility for the consequences.

License
Creative Commons License

All content on Tim Bovee, Private Trader by Timothy K. Bovee is licensed under a Creative Commons Attribution-ShareAlike 4.0 International License.

Based on a work at www.timbovee.com.

Trader’s Notebook

3:30 p.m. New York time

Half an hour before the closing bell. The S&P 500 futures moved slightly below yesterday’s low and then inched upwards a bit. The upward correction that began on October 13, wave 2{-7}, continues. Within it, downward wave D{-9} within upward wave A{-9} continues. No change the analysis. I’ve updated the chart.

9:35 a.m. New York time

What’s happening now? The S&P 500 E-mini futures continued trading in a narrow range overnight, reaching a low in the 3670s and then rising to a high in the 3730s.

What does it mean? The sideways movement is a pause within a downtrending 4th wave, part of the 1st wave within an upward correction that began on October 13.

What are the alternatives? If the pause is one degree larger than the principal analysis would place it, then the pause is the first stage of a 5th wave within the correction.

[S&P 500 E-mini futures at 3:30 p.m., 160-minute bars, with volume]

What does Elliott wave theory say? Wave 2{-7}, an upward correction that began on October 13 from 3502. The correction is taking the form of a Zigzag, which is common for 2nd waves. A Zigzag is composed of three internal waves — in this case, wave A{-8} within five internal waves, wave B{-8} with three internal waves, and wave C{-8} with five internal waves.

The principal analysis considers wave D{-9} within wave A{-8} to now be underway, with the sideways movement yesterday and through the night being a correction with wave D{-9}. Wave E{-9}, the final wave within wave A{-8}, will begin once wave C{-9} is complete.

The alternative analysis considers wave D{-9} to have ended at the October 19 low of 3677, and the subsequent, so far shallow, rise to be the early stage of wave E{-9}.

The pause has occurred in the neighborhood of the 23.6% Fibonacci retracement level. Typically, a 2nd wave will retrace a large portion of the ground covered by the preceding 1st wave, with the wave 2{-7} correction’s endpoint coming at the 61.8% Fibonacci level (4012) or even higher, at the 78.6 level (4151).

I’ve placed a Fibonacci retracement ladder on the chart, in red.

After rising wave A{-8} is complete, it will be followed by a declining wave B{-8} and then a rising wave C{-8}, which will complete the corrective pattern. It will also complete wave 2{-7}, unless the correction takes a compound form. If it compounds, wave C{-8} will be followed by a connecting wave X{-8} and then by a second corrective pattern. Compound corrections can have up to three corrective patterns within them.

This is all happening within wave 3{-6}, a downtrend that began on August 16 from 4327.50. It is a subwave of downtrending wave 1{-5} and a nested series of increasingly larger downtrending 1st waves, from degree {-4} up to degree {-2}. One level higher is wave 4{-1}, the next-to-the-last wave within an expanding Diagonal Triangle that began on December 26, 2018.

We Are Here.

These are the waves currently in progress under my principal analysis. Each line on the list shows the wave number, with the subscript in curly brackets, the traditional degree name, the starting date, the starting price of the S&P 500 E-mini futures, and the direction of the wave.

  • S&P 500 Index:
  • 5{+3} Supercycle, 7/8/1932, 4.40 (up)
  • 5{+2} Cycle, 12/9/1974, 60.96 (up)
  • 5{+1} Primary, 3/6/2009, 666.79 (up)
  • 5{0} Intermediate, 12/26/2018, 2346.58 (up)
  • 4{-1} Minor, 1/4/2022 4818.62 (down)
  • 1{-2} Minute, 1/4/2022 4818.62 (down)
  • S&P 500 Futures and index:
  • 1{-3} Minuette, 1/4/2022, 4808.25 (down) (futures), 4818.62 (down) (index)
  • S&P 500 Futures:
  • 1{-4} Subminuette, 1/4/2022, 4808.25 (down)
  • 1{-5} Micro, 1/4/2022, 4808.25 (down)
  • 3{-6} Submicro, 8/16/2022, 4327.50 (down)
  • 2{-7} Minuscule, 10/13/2022, 3502 (up)
  • A{-8} Subminuscule, 10/13/2022, 3502 (up)

Learning and other resources. Elliott wave analysis provides context, not prophecy. As the 20th century semanticist Alfred Korzybski put it in his book Science and Sanity (1933), “The map is not the territory … The only usefulness of a map depends on similarity of structure between the empirical world and the map.” And I would add, in the ever-changing markets, we can judge that similarity of structure only after the fact.

See the menu page Analytical Methods for a rundown on where to go for information on Elliott wave analysis.

By Tim Bovee, Portland, Oregon, October 20, 2022

Disclaimer

Tim Bovee, Private Trader tracks the analysis and trades of a private trader for his own accounts. Nothing in this blog constitutes a recommendation to buy or sell stocks, options or any other financial instrument. The only purpose of this blog is to provide education and entertainment.

No trader is ever 100 percent successful in his or her trades. Trading in the stock and option markets is risky and uncertain. Each trader must make trading decisions for his or her own account, and take responsibility for the consequences.

License
Creative Commons License

All content on Tim Bovee, Private Trader by Timothy K. Bovee is licensed under a Creative Commons Attribution-ShareAlike 4.0 International License.

Based on a work at www.timbovee.com.

IBM Trade

International Business Machines Corp. (IBM)

Update 11/2/2022: I exited my short bull put vertical spread on IBM, two days before expiration, for a $2.04 debit per contract/share, a loss before fees of $108 per contract. Shares were trading at $137.26, up $13.43 from the entry level.

The Implied Volatility Rank at exit was 22.8%, down 47.3 points from the entry level.

I exited on as the expiration date approached because the position seemed unlikely to ever recover in the short time left to it. I had the choice of holding the options, thereby letting them be exchanged at expiry for 100 short shares of IBM per contract or exercised a bit earlier, or of buying back the contract at a high price, 196% of maximum potential profit, avoiding fees and paperwork while taking a hefty hit but also freeing up funds for other work. The position lasted two weeks. The explanation is clear: The metrics pointed toward a negative earnings surprise. The company instead came in with an earnings and revenues surprise.

Shares rose by 10.8% over 14 days for a +283% annual rate. The options position produced a 52.9% loss for a -1,380% annual rate.


I have entered a short bear call vertical spread on IBM, using options that trade for the last time 16 days hence, on November 4. The premium is a $0.96 credit per contract share and the stock at the time of entry was priced at $123.83.

The Implied Volatility Ratio stood at 70.1%.

Premium:$0.96Expire OTM
IBM-bear call spreadStrikeOddsDelta
Calls
Long126.0061.0%43
Break-even124.9657.5%47
Short124.0054.0%51

The premium is 96% of the width of the position’s short/long spread. The profit zone covers a 0.9% move to the downside and an unlimited move to the upside.

The risk/reward ratio is 1.1:1, with maximum risk of $104 and maximum reward of $96 per contract.

How I chose the trade. The trade was placed to coincide with IBM’s earnings announcement, after the closing bell on the day of entry. The short strike was set to coincide with the expected move of $2.13 either way, based on options pricing, which gives a price range of $121.70 to $125.96. The Zacks Investment Research earnings surprise predictor gave IBM a score of -5.41%, with a rank of 4 (sell). The analysts’ consensus is that IBM will announce earnings of $1.78 per share.

By Tim Bovee, Portland, Oregon, October 19, 2022

Disclaimer

Tim Bovee, Private Trader tracks the analysis and trades of a private trader for his own accounts. Nothing in this blog constitutes a recommendation to buy or sell stocks, options or any other financial instrument. The only purpose of this blog is to provide education and entertainment.

No trader is ever 100 percent successful in his or her trades. Trading in the stock and option markets is risky and uncertain. Each trader must make trading decisions for his or her own account, and take responsibility for the consequences.

License
Creative Commons License

All content on Tim Bovee, Private Trader by Timothy K. Bovee is licensed under a Creative Commons Attribution-ShareAlike 4.0 International License.

Based on a work at www.timbovee.com.
Trader’s Notebook

3:30 p.m. New York time

Half an hour before the closing bell. The S&P 500 continued to trade sideways during the day. No change from the morning analysis. An upward correction, wave 2{-7} continues. Internally, it is in wave D{-9} within the corrections first wave, A{-8}. I’ve updated the chart.

1:45 p.m. New York time

IBM earnings play entry. I’ve entered a short bear call spread on IBM, using options that trade for the last time on November 4, and have posted an analysis of the trade.

1:15 p.m. New York time

UAL and ABT earnings play exits. I’ve exited my short bull put options spreads on UAL, for a profit, and ABT, for a loss, and have updated their trade analyses with results, linked to as follows: UAL, ABT.

9:35 a.m. New York time

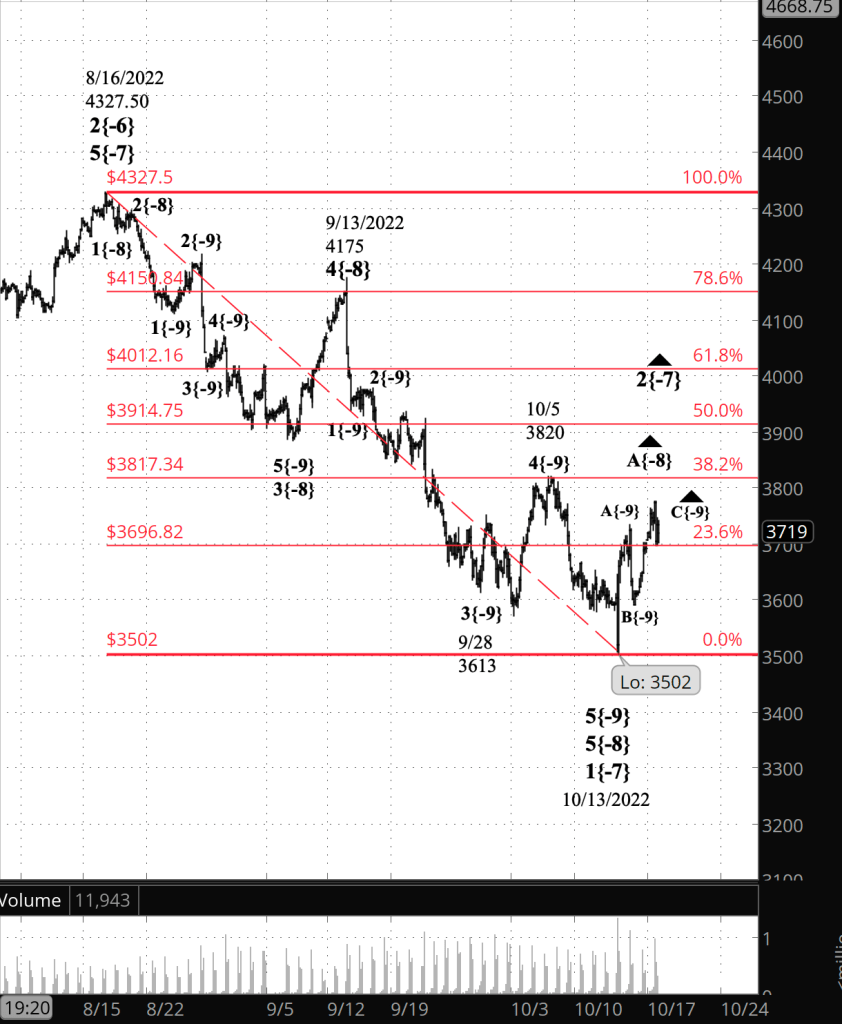
What’s happening now? The S&P 500 E-mini futures fluctuated across a narrow range overnight, from the 3690s to the 3770s.

What does it mean? The sideways movement is clearly a correction. Given the movement’s size, I view as it as the declining fourth segment within the first leg of an upward correction that began on October 13.

What are the alternatives? The sideways movement could also be a correction within the rising third segment within the correction.

[S&P 500 E-mini futures at 3:30 p.m., 160-minute bars, with volume]

What does Elliott wave theory say? Under the principal analysis, the overnight fluctuations are wave D{-9}, the fourth wave within wave A{-8}, the first wave of a three-wave upward correction, wave 2{-7}, that began on October 13.

The presence of a fourth wave within wave A{-8} means that the correction is taking the form of a Zigzag, which is commonly seen within 2nd waves. Zigzags tend to correct a large part of the distance covered by the preceding wave, downtrending wave 1{-7}.

In this case, wave 1{-7} began from 4327.50 and ended at 3502, a distance of 825.50. Retracements sometimes will end at a Fibonacci level, and I’ve superimposed a Fibonacci ladder over the chart, in red, to help me visualize where wave 2{-7}’s endpoints might be.

Two major Fibonacci points above the 50% level are 61.8%, at 4012.16, and 78.6%, at 4150.84. A 61.8% retracement would be business as usual, and a 78.6% retracement would be something to cheer about.

Under the patterns identified in Elliott wave theory, wave 2{-7} can rise as far as wave 1{-7}’s starting point –4327.50 — but no further. That 100% retracement would count as not unheard of but extraordinary all the same.

Under the alternative analysis, the overnight fluctuations are a correction within wave C{-8}, at the {-10} degree. This scenario leaves the nature of wave 2{-7} — Zigzag or Flat — as yet undecided. It matters because Flats, as the name implies, don’t normally retrace as much territory as Zigzags do.

Wave 2{-7} is happening within wave 1{-6}, which began on August 16, within a series of nested downtrending wave up to wave 1{-2}, which began on January 4.

Wave 1{-2}’s parent is declining wave 4{-1}, part of an expanding Diagonal Triangle, wave 5{0}, that began on December 26, 2018. For reference, the 2020 market crash early in the pandemic was wave 2{-1}, and the subsequent rise that began on February 23, 2020 and ended on January 4, 2022 was wave 3{-1}.

After wave 4{-1} is complete, rising wave 5{-1} carry the price above the January 4 peak, 4818.62 on the S&P 500 index, completing the Triangle. What follows will be a downtrend of major proportions — something for the history books — that probably will take decades to complete.

We Are Here.

These are the waves currently in progress under my principal analysis. Each line on the list shows the wave number, with the subscript in curly brackets, the traditional degree name, the starting date, the starting price of the S&P 500 E-mini futures, and the direction of the wave.

  • S&P 500 Index:
  • 3{+4} Grand Supercycle, 1780s or 1790s, price unknown (up)
  • 5{+3} Supercycle, 7/8/1932, 4.40 (up)
  • 5{+2} Cycle, 12/9/1974, 60.96 (up)
  • 5{+1} Primary, 3/6/2009, 666.79 (up)
  • 5{0} Intermediate, 12/26/2018, 2346.58 (up)
  • 4{-1} Minor, 1/4/2022 4818.62 (down)
  • 1{-2} Minute, 1/4/2022 4818.62 (down)
  • S&P 500 Futures and index:
  • 1{-3} Minuette, 1/4/2022, 4808.25 (down) (futures), 4818.62 (down) (index)
  • S&P 500 Futures:
  • 1{-4} Subminuette, 1/4/2022, 4808.25 (down)
  • 1{-5} Micro, 1/4/2022, 4808.25 (down)
  • 3{-6} Submicro, 8/16/2022, 4327.50 (down)
  • 2{-7} Minuscule, 10/13/2022, 3502 (up)
  • A{-8} Subminuscule, 10/13/2022, 3502 (up)

Learning and other resources. Elliott wave analysis provides context, not prophecy. As the 20th century semanticist Alfred Korzybski put it in his book Science and Sanity (1933), “The map is not the territory … The only usefulness of a map depends on similarity of structure between the empirical world and the map.” And I would add, in the ever-changing markets, we can judge that similarity of structure only after the fact.

See the menu page Analytical Methods for a rundown on where to go for information on Elliott wave analysis.

By Tim Bovee, Portland, Oregon, October 18, 2022

Disclaimer

Tim Bovee, Private Trader tracks the analysis and trades of a private trader for his own accounts. Nothing in this blog constitutes a recommendation to buy or sell stocks, options or any other financial instrument. The only purpose of this blog is to provide education and entertainment.

No trader is ever 100 percent successful in his or her trades. Trading in the stock and option markets is risky and uncertain. Each trader must make trading decisions for his or her own account, and take responsibility for the consequences.

License
Creative Commons License

All content on Tim Bovee, Private Trader by Timothy K. Bovee is licensed under a Creative Commons Attribution-ShareAlike 4.0 International License.

Based on a work at www.timbovee.com.
ABT Trade

Abbott Laboratories (ABT)

Update 10/19/2022: I exited my short bull put vertical spread on ABT, 23 days before expiration, for a $3.35 debit per contract/share, a loss before fees of $172 per contract. Shares were trading at $98.15, down $7.29 from the entry level.

The Implied Volatility Rank at exit was 73.7%, up 6.2 points from the entry level.

I exited on the day after entry because the position moved in the direction opposite that anticipated in the trade, reaching 99.4% of maximum potential loss.

Shares declined by 6.9% over one day for a -2,524% annual rate. The options position produced a 51.3% loss for a -18,740% annual rate.


I have entered a short bull put vertical spread on ABT, using options that trade for the last time 31 days hence, on November18. The premium is a $1.63 credit per contract share and the stock at the time of entry was priced at $105.44.

The Implied Volatility Ratio stood at 67.5%.

Premium:$1.63Expire OTM
ABT-bull put spreadStrikeOddsDelta
Puts
Long100.0068.0%28
Break-even106.6358.0%37.5
Short105.0048.0%47

The premium is 65.2% of the width of the position’s short/long spread. The profit zone covers a 1.1% move to the downside and an unlimited move to the upside.

The risk/reward ratio is 2.1:1, with maximum risk of $337 and maximum reward of $163 per contract.

How I chose the trade. The trade was placed to coincide with ABT’s earnings announcement, before the opening bell on the day after entry. The short strikes were set to coincide with the expected move of $2.80 either way, based on options pricing, which gives a price range of $102.64 to $108.24. The Zacks Investment Research earnings surprise predictor gave ABT a score of 0.98%, with a rank of Hold (3). The analysts’ consensus is that ABT will announce earnings of $0.90 per share.

By Tim Bovee, Portland, Oregon, October 18, 2022

Disclaimer

Tim Bovee, Private Trader tracks the analysis and trades of a private trader for his own accounts. Nothing in this blog constitutes a recommendation to buy or sell stocks, options or any other financial instrument. The only purpose of this blog is to provide education and entertainment.

No trader is ever 100 percent successful in his or her trades. Trading in the stock and option markets is risky and uncertain. Each trader must make trading decisions for his or her own account, and take responsibility for the consequences.

License
Creative Commons License

All content on Tim Bovee, Private Trader by Timothy K. Bovee is licensed under a Creative Commons Attribution-ShareAlike 4.0 International License.

Based on a work at www.timbovee.com.
UAL Trade

United Airlines Holdings Inc. (UAL)

Lot 2022-2

Update 10/19/2022: I exited my short bull put vertical spread on UAL, 24 days before expiration, for a $0.47 debit per contract/share, a profit before fees of $29 per contract. Shares were trading at $33.43, up $1.75 from the entry level.

The Implied Volatility Rank at exit was 62.4%, down 5.4 points from the entry level.

I exited on the day after entry because the position exceeded 25% of maximum potential profit, my normal exit point for earnings plays, reaching 38.2% of max.

Shares rose by 6.8% over one day for a +2,479% annual rate. The options position produced a 31.6% return for a +3,848% annual rate.


I have entered a short bull put vertical spread on UAL, using options that trade for the last time 31 days hence, on November 18. The premium is a $0.76 credit per contract share and the stock at the time of entry was priced at $36.52.

The Implied Volatility Ratio stood at 55.6%.

Premium:$0.76Expire OTM
UAL-bull put spreadStrikeOddsDelta
Puts
Long34.0064.0%30
Break-even36.7657.5%36
Short36.0051.0%42

The premium is 76% of the width of the position’s short/long spread. The profit zone covers a 0.7% move to the downside and an unlimited move to the upside.

The risk/reward ratio is 1.6:1, with maximum risk of $124 and maximum reward of $76 per contract.

How I chose the trade. The trade was placed to coincide with UAL’s earnings announcement, after the closing bell on the day of entry. The short strikes were set to coincide with the expected move of $2.04 either way, based on options pricing, which gives a price range of $34.84 to $38.56. The Zacks Investment Research earnings surprise predictor gave UAL a score of 5.22%, with a rank of Hold (3). The analysts’ consensus is that UAL will announce earnings of $2.21 per share.

By Tim Bovee, Portland, Oregon, October 18, 2022

Disclaimer

Tim Bovee, Private Trader tracks the analysis and trades of a private trader for his own accounts. Nothing in this blog constitutes a recommendation to buy or sell stocks, options or any other financial instrument. The only purpose of this blog is to provide education and entertainment.

No trader is ever 100 percent successful in his or her trades. Trading in the stock and option markets is risky and uncertain. Each trader must make trading decisions for his or her own account, and take responsibility for the consequences.

License
Creative Commons License

All content on Tim Bovee, Private Trader by Timothy K. Bovee is licensed under a Creative Commons Attribution-ShareAlike 4.0 International License.

Based on a work at www.timbovee.com.

Trader’s Notebook

3:30 p.m. New York time

Half an hour before the closing bell. The S&P 500 reached 3746.50 on the futures during the session and then reversed, returning to the 23.6% retracement level, 50 points below.

The analysis from this morning is unchanged. The upward correction that began on October 13, wave 2{-7}, is still underway and is in its initial phase, rising wave A{-8}.

I’ve updated the chart.

2:35 p.m. New York time

ABT earnings play entry. I’ve entered a bull put spread on ABT, using options that trade for the last time on November 18, and have posted an analysis of the trade.

2:05 p.m. New York time

UAL earnings play entry. I’ve entered a bull put spread on UAL, using options that trade for the last time on November 18, and have posted an analysis of the trade.

9:35 a.m. New York time

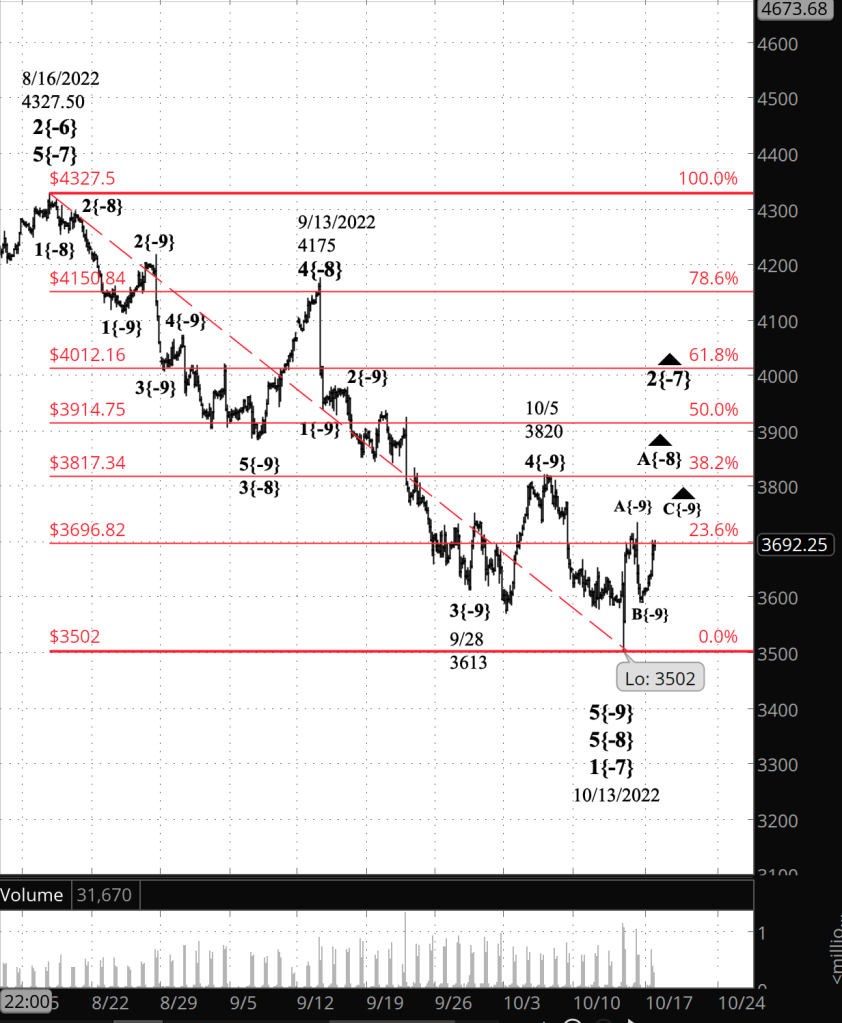
What’s happening now? The S&P 500 E-mini futures broke free from its stall in the 3690s, rising to the 3770s.

What does it mean? The third segment within the first leg of an upward correction that began on October 13 continues, carrying to price more than halfway toward the 38.2% Fibonacci retracement level. (I’ve placed a Fibonacci retracement ladder on the chart, in red.) The present rise, which began on October 16, will be followed by a decline and then a further rise to complete the correction’s first leg.

What are the alternatives? The ambiguity on the chart is whether the present rise will be the end of the first, rising portion of the upward correction, or whether there will be another decline and rise after it is complete. If the correction as a whole takes the form of a Zigzag, it will have five segments within its initial rise, as in the principal anaysis. Under the alternative analysis, it will take the from of a Flat, with three segments within the initial leg., and the end of the present rise will also be the end of the first leg of the correction.

[S&P 500 E-mini futures at 3:30 p.m., 160-minute bars, with volume]

What does Elliott wave theory say? Wave 2{-7}, an upward correction, began on October, and is now in its first part, wave A{-8}. Within wave A{-8}, wave C{-9} is underway.

Under the principal analysis, wave 2{-7} is taking the form of a Zigzag, with five waves within its initial rise, wave A{-8}. Wave C{-9} will be followed by two more waves, D{-9} and E{-9}, to bring wave A{-8} to an end.

Under the alternative analysis, wave 2{-7} is taking the from of a Flat, with three waves internally. Wave C{-9} will bring wave A{-8} to close.

Under either scenario, wave A{-8} will be followed by a decline, wave B{-8}, and then a rise, wave C{-8}, which likely will bring wave 2{-7} to completion. That is, unless wave 2{-7} takes the form of a compound correction. In that case, the first corrective pattern will be followed by a second one and perhaps a third.

This is all happening within a downtrend, wave 3{-6}, which began on August 16 from 4327.50.

We Are Here.

These are the waves currently in progress under my principal analysis. Each line on the list shows the wave number, with the subscript in curly brackets, the traditional degree name, the starting date, the starting price of the S&P 500 E-mini futures, and the direction of the wave.

  • S&P 500 Index:
  • 5{+3} Supercycle, 7/8/1932, 4.40 (up)
  • 5{+2} Cycle, 12/9/1974, 60.96 (up)
  • 5{+1} Primary, 3/6/2009, 666.79 (up)
  • 5{0} Intermediate, 12/26/2018, 2346.58 (up)
  • 4{-1} Minor, 1/4/2022 4818.62 (down)
  • 1{-2} Minute, 1/4/2022 4818.62 (down)
  • S&P 500 Futures and index:
  • 1{-3} Minuette, 1/4/2022, 4808.25 (down) (futures), 4818.62 (down) (index)
  • S&P 500 Futures:
  • 1{-4} Subminuette, 1/4/2022, 4808.25 (down)
  • 1{-5} Micro, 1/4/2022, 4808.25 (down)
  • 3{-6} Submicro, 8/16/2022, 4327.50 (down)
  • 2{-7} Minuscule, 10/13/2022, 3502 (up)
  • A{-8} Subminuscule, 10/13/2022, 3502 (up)

Learning and other resources. Elliott wave analysis provides context, not prophecy. As the 20th century semanticist Alfred Korzybski put it in his book Science and Sanity (1933), “The map is not the territory … The only usefulness of a map depends on similarity of structure between the empirical world and the map.” And I would add, in the ever-changing markets, we can judge that similarity of structure only after the fact.

See the menu page Analytical Methods for a rundown on where to go for information on Elliott wave analysis.

By Tim Bovee, Portland, Oregon, October 18, 2022

Disclaimer

Tim Bovee, Private Trader tracks the analysis and trades of a private trader for his own accounts. Nothing in this blog constitutes a recommendation to buy or sell stocks, options or any other financial instrument. The only purpose of this blog is to provide education and entertainment.

No trader is ever 100 percent successful in his or her trades. Trading in the stock and option markets is risky and uncertain. Each trader must make trading decisions for his or her own account, and take responsibility for the consequences.

License
Creative Commons License

All content on Tim Bovee, Private Trader by Timothy K. Bovee is licensed under a Creative Commons Attribution-ShareAlike 4.0 International License.

Based on a work at www.timbovee.com.

Trader’s Notebook

3:30 p.m. New York time

Half an hour before the closing bell. The S&P 500 rose during the session, reaching a high so far of 3702.50 on the futures. It then paused, fluctuating sideways along the 23.6% Fibonacci retracement level. No change in the analysis, but chart has added an ambiguity.

If the upward correction, wave 2{-7}, is taking the the from of a Zigzag, then the pause is wave C{-9} within wave A{-8}, with waves D and E at the {-9} level remaining. If wave 2{-7} is taking the form of a Flat, then the peak may have marked the end of wave A{-8} and the subsequent pause would be the early stages of wave B{-8}. Or, possibly, wave C{-9} within A{-8} still has further to rise.

I have no opinion on whether wave C{-9} is complete. However, I think the Zigzag scenario is more likely, for two reasons:

(1) Zigzags are a more common pattern than Flats for 2nd waves

(2) Second waves typically cover a lot of ground in the direction of the correction, and the first wave of the correction hasn’t gone very far yet.

11:05 a.m. New York time

BAC earnings play exit. I’ve exited my short bull put options spread on BAC for 97.5% of maximum potential loss and have updated the trade analysis with results.

9:35 a.m. New York time

What’s happening now? In overnight trading, the S&P 500 E-mini futures reversed from Friday’s low, 3590.50, rising into the 3670s.

What does it mean? An upward correction that began on October 13 is in its first leg, which can be expected to have five segments internally, if the correction takes the form of a Zigzag, or three segments, if the correction takes the form of a Flat. The correction’s first leg is presently in its third internal segment.

The correction is part the downtrend that began on August 16 from 4327.50. This is the first correction iwithin the downtrend and can be expected to retrace a significant portion of the preceding decline.

I’ve placed a Fibonacci retracement ladder on the chart, in red, making it easier to see how much of the decline has been retraced by the correction. The first segment within the first leg of the correction carried the price up to the 23.6% Fibonaci level. For the correction as a whole, a retracement up to the 61.8% or 78.6% Fibonacci levels would not be unusual.

What are the alternatives? As always in the early stages of a market movement, the labeling of the ups and downs compared to larger or smaller movements is a best guess. I’ve placed the correction in its entirety at one level smaller than the downtrend, which seems proportional in size and time to what has occurred before. Nonetheless, the chart could play out in such a way as to require a change in the labeling.

[S&P 500 E-mini futures at 3:30 p.m., 150-minute bars, with volume]

What does Elliott wave theory say? The upward correction is wave 2{-7] within a downtrend, wave 3{-6}. As noted a above, 2nd waves tend to take retrace much of the distance covered by the preceding 1st wave. Also, 3rd waves tend to be the longest wave within a trend. So there is energy both to the upside and the downside.

Internally, wave 2{-7} is in its initial wave, wave A{-8}, which in turn is in its third segment, wave C{-9}, the latter being an uptrending wave that began from Friday’s low.

Wave A{-8} will be followed by downtrending wave B{-8} and then a final push to the upside with wave C{-8}, which will complete the corrective pattern. Although not necessarily the correction, which could be extended in a compound structure.

We Are Here.

These are the waves currently in progress under my principal analysis. Each line on the list shows the wave number, with the subscript in curly brackets, the traditional degree name, the starting date, the starting price of the S&P 500 E-mini futures, and the direction of the wave.

  • S&P 500 Index:
  • 5{+3} Supercycle, 7/8/1932, 4.40 (up)
  • 5{+2} Cycle, 12/9/1974, 60.96 (up)
  • 5{+1} Primary, 3/6/2009, 666.79 (up)
  • 5{0} Intermediate, 12/26/2018, 2346.58 (up)
  • 4{-1} Minor, 1/4/2022 4818.62 (down)
  • 1{-2} Minute, 1/4/2022 4818.62 (down)
  • S&P 500 Futures and index:
  • 1{-3} Minuette, 1/4/2022, 4808.25 (down) (futures), 4818.62 (down) (index)
  • S&P 500 Futures:
  • 1{-4} Subminuette, 1/4/2022, 4808.25 (down)
  • 1{-5} Micro, 1/4/2022, 4808.25 (down)
  • 3{-6} Submicro, 8/16/2022, 4327.50 (down)
  • 2{-7} Minuscule, 10/13/2022, 3502 (up)
  • A{-8} Subminuscule, 10/13/2022, 3502 (up)

Learning and other resources. Elliott wave analysis provides context, not prophecy. As the 20th century semanticist Alfred Korzybski put it in his book Science and Sanity (1933), “The map is not the territory … The only usefulness of a map depends on similarity of structure between the empirical world and the map.” And I would add, in the ever-changing markets, we can judge that similarity of structure only after the fact.

See the menu page Analytical Methods for a rundown on where to go for information on Elliott wave analysis.

By Tim Bovee, Portland, Oregon, October 17, 2022

Disclaimer

Tim Bovee, Private Trader tracks the analysis and trades of a private trader for his own accounts. Nothing in this blog constitutes a recommendation to buy or sell stocks, options or any other financial instrument. The only purpose of this blog is to provide education and entertainment.

No trader is ever 100 percent successful in his or her trades. Trading in the stock and option markets is risky and uncertain. Each trader must make trading decisions for his or her own account, and take responsibility for the consequences.

License
Creative Commons License

All content on Tim Bovee, Private Trader by Timothy K. Bovee is licensed under a Creative Commons Attribution-ShareAlike 4.0 International License.

Based on a work at www.timbovee.com.