Trader’s Notebook

3:30 p.m. New York time

Half an hour before the closing bell. The rise overnight proved to be a bump within the sharp decline that began on August 26. In today’s session the price reached a low of 3964.50 on the futures. The first leg of the downward correction that began on August 16 — wave A{-12} within wave 4{-11} — is still underway. That first leg is in turn in its last segment, wave 5{-13}. I’ve added an afternoon the chart, retaining this morning’s chart for comparison
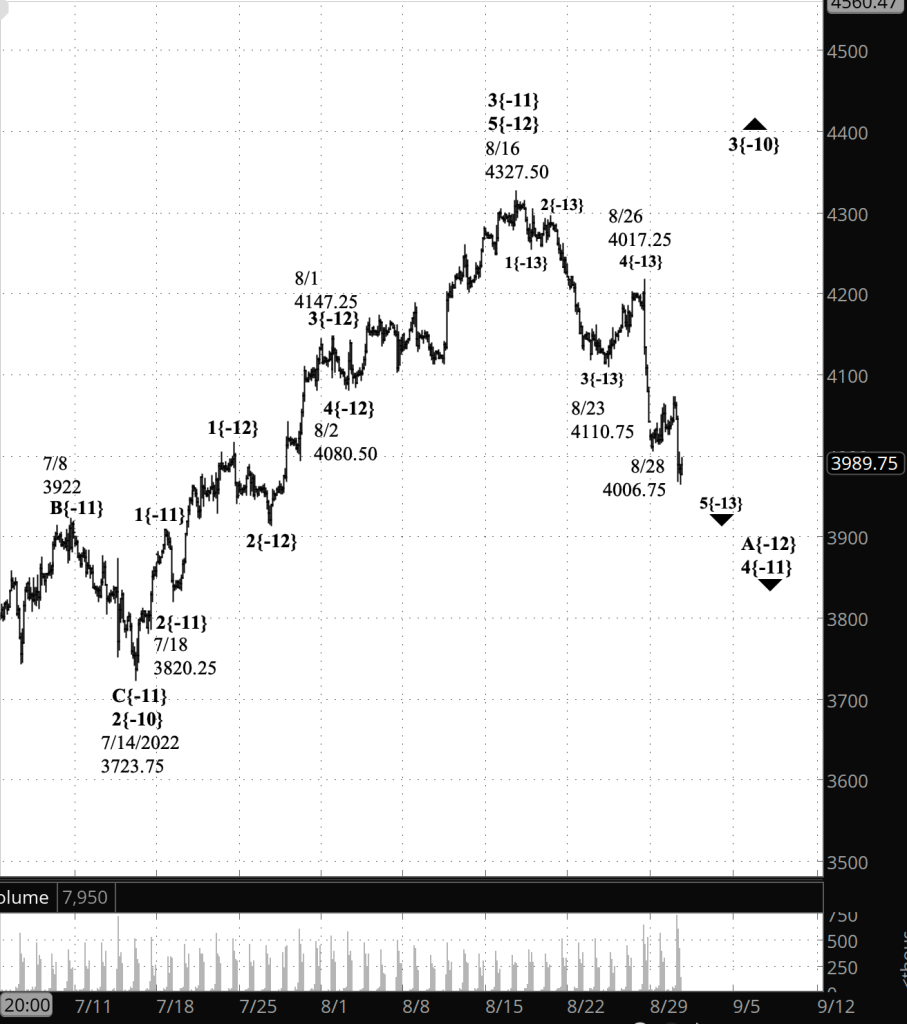
[S&P 500 E-mini futures at 3:30 p.m., 2-hour bars, with volume]

9:35 a.m. New York time

What’s happening now? The S&P 500 E-mini futures rose overnight, returning to the 4070s after reaching a low on August 28 of 4006.75.

What does it mean? The rising second leg of a downward correction that began on August 16 is now underway. The correction is taking a Zigzag pattern, and so the price will remain below the start of the correction, 4327.50.

What is the alternative? The entire rise from July 14 to August 16, which I’ve labeled as the middle wave of an uptrend, may in fact be the final wave. If so, then the decline that followed is a downtrend rather than being part of a downward correction.
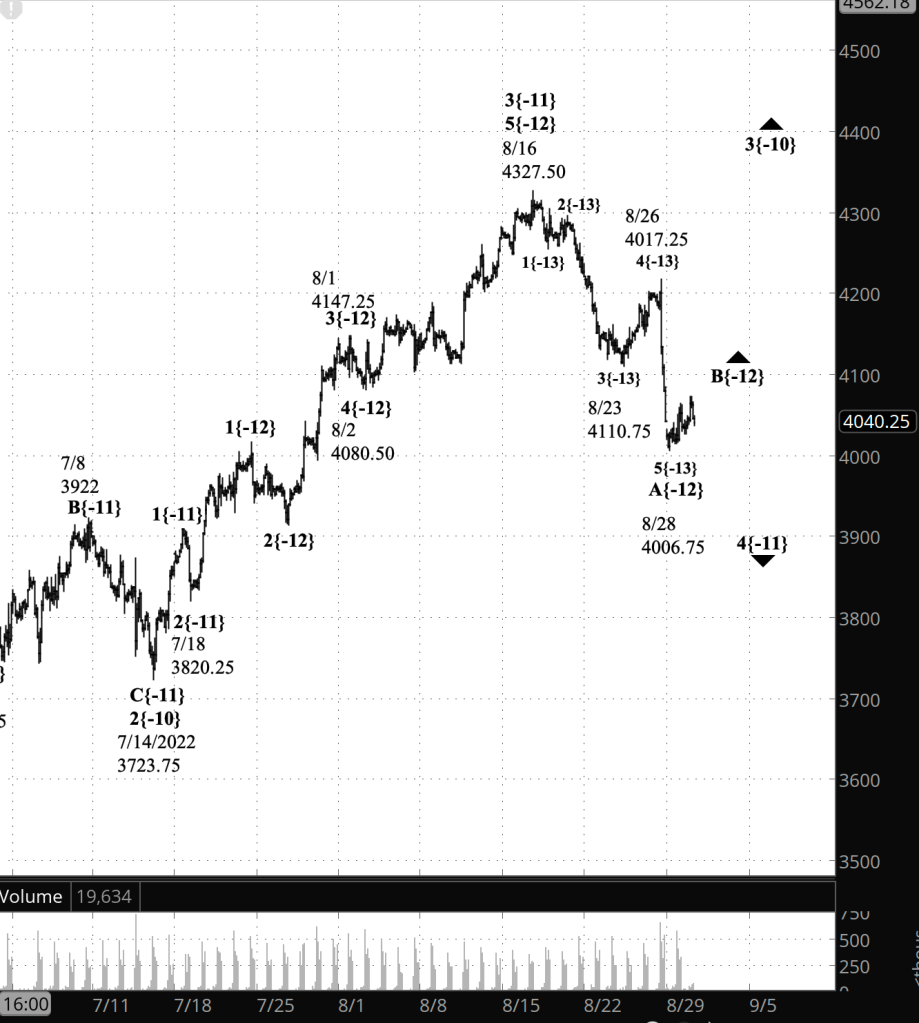
[S&P 500 E-mini futures at 9:35 a.m., 2-hour bars, with volume]

What does Elliott wave theory say? Under the principal analysis, the rise from August 28 is wave B{-12} within wave 4{-11}, the downward correction that began on August 16 from 4327.50, the peak of wave 3{-11}. The first leg of correction, wave A{-12}, has five waves internally, so the correction is most likely taking the form of a Zigzag. The B wave of a Zigzag typically retraces 38% to 79% of the preceding A wave, giving a rather broad target range of 4129 to 4260, more or less. The overnight high was 4072.75.

Under the alternative analysis, the August 16 peak marked the end of wave 5{-11}, and the decline that followed is the early stage of wave 4{-10}, whose preceding 3rd wave began on July 14.

Learning and other resources. Elliott wave analysis provides context, not prophecy. As the 20th century semanticist Alfred Korzybski put it in his book Science and Sanity (1933), “The map is not the territory … The only usefulness of a map depends on similarity of structure between the empirical world and the map.” And I would add, in the ever-changing markets, we can judge that similarity of structure only after the fact.

See the menu page Analytical Methods for a rundown on where to go for information on Elliott wave analysis.

By Tim Bovee, Portland, Oregon, August 30, 2022

Disclaimer

Tim Bovee, Private Trader tracks the analysis and trades of a private trader for his own accounts. Nothing in this blog constitutes a recommendation to buy or sell stocks, options or any other financial instrument. The only purpose of this blog is to provide education and entertainment.

No trader is ever 100 percent successful in his or her trades. Trading in the stock and option markets is risky and uncertain. Each trader must make trading decisions for his or her own account, and take responsibility for the consequences.

License
Creative Commons License

All content on Tim Bovee, Private Trader by Timothy K. Bovee is licensed under a Creative Commons Attribution-ShareAlike 4.0 International License.

Based on a work at www.timbovee.com.

Trader’s Notebook

3:30 p.m. New York time

Half an hour before the closing bell. The S&P 500 has risen during the session, reaching a high so far of 4064 on the futures, nearly 60 points above the overnight low. The rise carried the price from 61.8% retracement of the rise from July 18 to August 16 up to near the 50% retracement level of that rise. In Elliott wave analysis terms, wave 5{-13} may have ended its decline at the overnight low. If so, then the subsequent rise the beginning of wave B{-12}. That’s have I’ve updated the chart. If not, then the rise is a bump during wave 5{-13}’s continuing decline.

9:35 a.m. New York time

What’s happening now? The S&P 500 E-mini futures opened nearly 20 points below Friday’s close when trading resumed Sunday evening. The price then traded overnight in a narrow range with a slight downward tilt, bringing the price to a low so far of 4006.75.

What does it mean? Because of the power and length of Friday’s steep fall, I’ve redone the analysis of the rise and fall that began on August 23. Under the new principal analysis, the rise that ended on August 26 is an upward correction of small degree, the next to the last part of a downward movement that began on August 16. The decline that followed is the final portion of that downtrend, which is itself the first leg of a larger downward correction. See the Elliott wave theory section for more detail.

What are the alternatives? There are two.

Alternative #1: It’s still possible that Friday’s principal analysis, now discarded, was in fact correct. That scenario labelled the rise that ended on August 26 as the first leg of the upward correction. Under this labeling, the subsequent swift decline would be the second leg, and a quick reversal to the upside would be the third leg.

Alternative #2: Another alternative changes the labeling of the entire rise from July 14 as having reached completion on August 16, and the decline that followed as being the early stages of a downtrend rather as a portion of a downward correction.

[S&P 500 E-mini futures at 3:30 p.m., 115-minute bars, with volume]

What does Elliott wave theory say? Under the principal analysis, Friday’s sharp decline, which fell further to 4006.75 overnight, is wave 5{-13}, the final wave within wave A{-12}, which is itself the first leg of a downward correction, wave 4{-11}, that began on August 16. Wave A{-12} will be followed by upward wave B{-12}, the second wave of the wave 4{-11} correction, and then downward wave C{-12}, which will bring the correction to completion. Some corrections form compound structures, and if that’s the cases here, then wave C{-12} will be followed by a second corrective pattern.

Under this scenario, wave A{-12} has reached a Fibonacci level that retraces 61.8% of wave 3{-11}, which ran from July 18 to August 16. A 61.8% retracement is one of the most common that I’ve seen while working with Elliott wave theory, and a reversal from that point would lend credence to the principal analysis.

Under the first alternative, the rise that ended August 26 was the end of wave A{-14}, the first leg of an upward correction, wave 4{-13}, that began on August 23. The decline that began on Friday is wave B{-14}, and it will be followed by a rise, wave C{-14}, that will complete the correction, unless it extends in a compound structure. Wave 4{-13} will be followed by a decline, wave 5{-13}, that will complete the parent, wave A{-12}, and it will be followed by uptrending wave B{-12}, the middle wave the downward correction, wave 4{-11}, which began on August 16. Basically, this scenario moves the wave labeling of the principal analysis up by one degree.

The second alternative makes a larger change to the chart. Under this scenario, the August 16 peak is the end of wave 5{-11} and its parent, wave 3{-10}, an uptrend that began on July 14. The subsequent decline is wave 4{-10}. This scenario moves the wave labeling still higher.

At a larger level, the S&P 500 is in a downtrend of large degree, wave 4{-1}, which began on January 4 from 4808.25 and which will be with us into 2023 and perhaps into 2024.

That’s a lot of ambiguity, and I’m not confident that the principal analysis is indeed the most likely of the three. As always, the charts movements to come will make things clear.

And what all three scenarios have in common is that 1) the S&P 500 is in a downward correction that will be a followed by a rise back into the 4300s.

At a larger level, the S&P 500 is in a downtrend of large degree, wave 4{-1}, which began on January 4 from 4808.25 and which will be with us into 2023 and perhaps into 2024.

So, longer term, think downward thoughts. Elliott wave analysis shows that this is not a bull market, and won’t be one for some time to come.

Learning and other resources. Elliott wave analysis provides context, not prophecy. As the 20th century semanticist Alfred Korzybski put it in his book Science and Sanity (1933), “The map is not the territory … The only usefulness of a map depends on similarity of structure between the empirical world and the map.” And I would add, in the ever-changing markets, we can judge that similarity of structure only after the fact.

See the menu page Analytical Methods for a rundown on where to go for information on Elliott wave analysis.

By Tim Bovee, Portland, Oregon, August 29, 2022

Disclaimer

Tim Bovee, Private Trader tracks the analysis and trades of a private trader for his own accounts. Nothing in this blog constitutes a recommendation to buy or sell stocks, options or any other financial instrument. The only purpose of this blog is to provide education and entertainment.

No trader is ever 100 percent successful in his or her trades. Trading in the stock and option markets is risky and uncertain. Each trader must make trading decisions for his or her own account, and take responsibility for the consequences.

License
Creative Commons License

All content on Tim Bovee, Private Trader by Timothy K. Bovee is licensed under a Creative Commons Attribution-ShareAlike 4.0 International License.

Based on a work at www.timbovee.com.
Trader’s Notebook


3:30 p.m. New York time

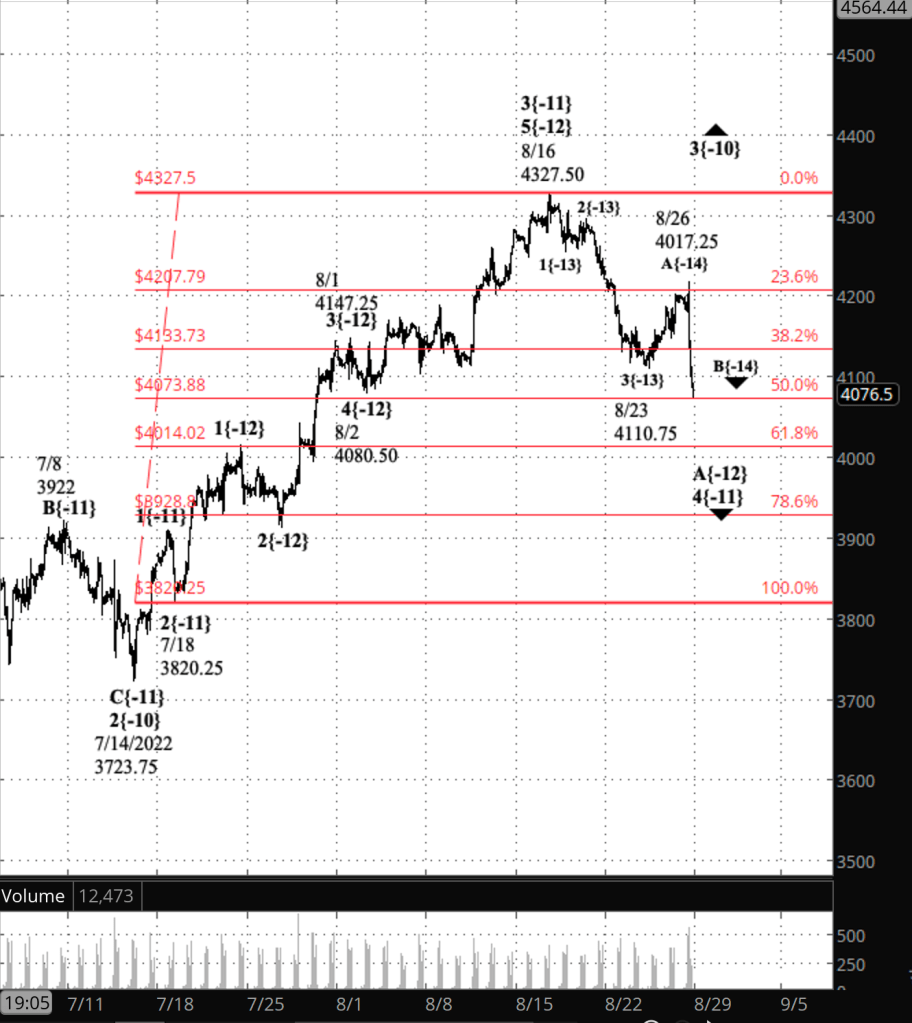
Half an hour before the closing bell. The S&P 500 has continued to fall, reaching into the 4070s on the futures as the closing bell. approached. All that has transpired is part of a larger downward correction of the rise from July 18 to August 16. Today’s decline carried the correction from the 23.6% Fibonacci retracement level to the 50% retracement level. (The Fibonacci ladder is shown on the chart in red.)

I’ve updated the upper chart.

1:30 p.m. New York time

Falling Down Jackson Hole. The S&P 500 fell sharply from an hour before Lewis Powell, the Federal Reserve Chair, began his remarks at the Fed’s symposium in Jackson’s Hole, Wyoming. The price on the futures peaked at 4217.25 at 9 a.m., and reached its low of the day — so far — at 4099.25, about three hours later. A 118-point plunge — not bad for an 11-minute speech.

The decline introduced huge ambiguity onto the chart. In Elliott wave terminology: The decline either (scenario 1) ended rising wave A{-14} within wave 4{-13}, an upward correction that began on August 23, or (scenario 2) it ended that correction entirely.

Scenario 1 will require that wave 4{-13} take the form of a Flat within wave A{-14}. The reason is that the Jackson’s Hole decline, wave B{-14}, carried the price below the start of wave 4{-13}, and that breaks a firm rule of behavior for a Zigzag corrective pattern. A Flat corrective pattern can move below that level within the rules of Elliott wave analysis.

The A wave within a Zigzag has five waves internally. Within a Flat, the A wave has three waves internally. I count five waves within wave A{-14}, which this morning was how I labeled the rise from August 23 to August 26 (today). That’s scenario 1. However, scenario 2 — today’s high marks the end of wave 4{-13} in its entirely — also requires three waves for the August 23 to August 26 rise.

Basically, we’re left with two bad choices with no way to distinguish between them.

If I squint my eyes and suspend my disbelief, I can sort of see three waves within that rise, if I treat the first very small bump up and retreat as being a wave of a lower degree. And so that’s what I’ll do, and in doing so, it makes more sense to see today’s high as the end of the A wave, with the parent 4th wave correction still underway: Scenario 1.

That’s the minimum necessary change to resolve the contradictions, and that’s how I’ve updated the upper chart. Wave B{-14} with wave 4{-13} is now underway.

9:35 a.m. New York time

What’s happening now? The S&P 500 E-mini futures traded narrowly overnight, fluctuating from the 4180s to the 4210s. Federal Reserve Chair Jerome Powell is scheduled to speak at the agency’s Jackson Hole Wyoming symposium at 10 a.m., half an hour after the opening bell, a venue closely watched for clues to the Federal Open Market Committee’s intentions regarding interest rates.

What does it mean? The downward correction that began on August 16 is still underway and is in its first of three legs. Internally, the first leg is in its 4th segment, a rising correction that will be followed by a 5th, declining wave. The first leg will be followed by the rising 2nd leg.

What is the alternative? At this point I see little ambiguity in the chart, although I’m certain that ambiguities will develop, as they as always do.

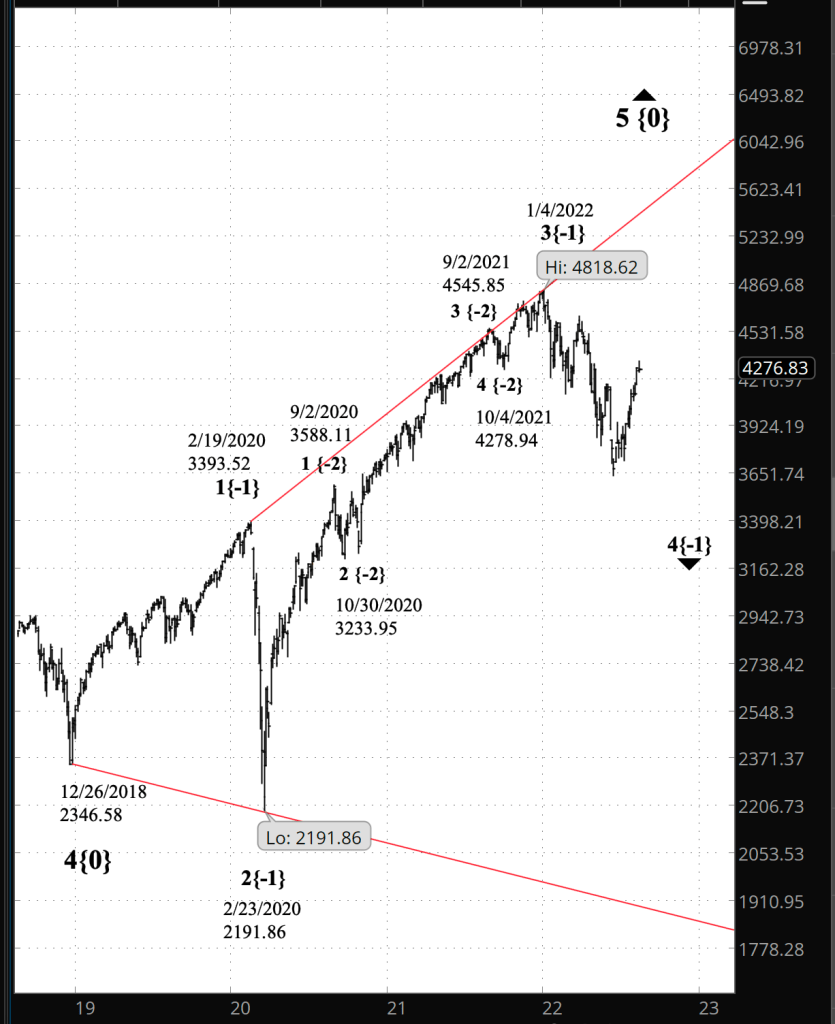
The charts. The upper chart shows the S&P 500 futures dating back to July. the lower chart shows the S&P 500 index and the expanding Diagonal Triangle, which has been underway since December 2018 and which is now in its 4th subwave.

[S&P 500 E-mini futures at 3:30 p.m., 115-minute bars, with volume]

What does Elliott wave theory say? The downward correction, wave 4{-11}, is in its first wave, falling wave A{-12}, which in turn is in its next to the last segment, rising wave 4{-13}. When wave 4{-13} is complete, it will be followed by falling wave 5{-13}, which will complete wave A{-12}. Rising wave B {-12} will follow, retracing a portion of the wave A{-12} decline, and then declining wave C{-12} will follow, completing the corrective pattern.

This is all happening within wave 3{-10}, an uptrending wave that began on July 14. Looking at the longer term, the S&P 500 has been in a large downward movement, wave 4{-1}, since January 4. It is the next to the last wave of an expanding Diagonal Triangle, wave 5{0}, which began on December 26, 2018.

To give some idea of scale of the triangle, rising wave 1{-1} took 14 months to reach completion, wave 2{-1} — the early pandemic crash — was over in four days, and rising wave 3{-1} stretched out for nearly two years. Most likely, wave 4{-1} will carry us to 2023 and perhaps later by a year. Or two.

[S&P 500 index at 9:30 a.m., 3-day bars]

Learning and other resources. Elliott wave analysis provides context, not prophecy. As the 20th century semanticist Alfred Korzybski put it in his book Science and Sanity (1933), “The map is not the territory … The only usefulness of a map depends on similarity of structure between the empirical world and the map.” And I would add, in the ever-changing markets, we can judge that similarity of structure only after the fact.

See the menu page Analytical Methods for a rundown on where to go for information on Elliott wave analysis.

By Tim Bovee, Portland, Oregon, August 26, 2022

Disclaimer

Tim Bovee, Private Trader tracks the analysis and trades of a private trader for his own accounts. Nothing in this blog constitutes a recommendation to buy or sell stocks, options or any other financial instrument. The only purpose of this blog is to provide education and entertainment.

No trader is ever 100 percent successful in his or her trades. Trading in the stock and option markets is risky and uncertain. Each trader must make trading decisions for his or her own account, and take responsibility for the consequences.

License
Creative Commons License

All content on Tim Bovee, Private Trader by Timothy K. Bovee is licensed under a Creative Commons Attribution-ShareAlike 4.0 International License.

Based on a work at www.timbovee.com.

Trader’s Notebook

3:30 p.m. New York time

Half an hour before the closing bell. The S&P 500 has traded narrowly during the session, from the 4140s to the 4180s on the futures. The downward correction, wave 4{-11}, continues. No change in the analysis. I’ve updated the chart.

9:35 a.m. New York time

What’s happening now? The S&P 500 E-mini futures rose in overnight trading, reaching a high of 4187.75, nearly 80 points above the August 23 low,4110.75, and then reversed to the downside slightly.

What does it mean? This gets a bit complicated because of the fractal nature of the structure. It involves three degrees of size, from the smallest to the largest. The August 23 low was the end of the downward middle subwave within the larger downward first subwave within the downward correction that began on August 16.

What is the alternative? It’s possible to count the internal movement within the first subwave as being complete at the August 23 low. If that proves to be the case, then the second subwave within the larger correction is now underway.

[S&P 500 E-mini futures at 3:30 p.m., 110-minute bars, with volume]

What does Elliott wave theory say? A downward correction, wave 4{-11}, has been underway since August 16 and is taking the form of a Zigzag. A Zigzag correction has three internal waves: A, with five waves within it; B, with three internal waves, and C, with five waves internally.

Under the principal analysis, the first leg of the correction, wave A{-12}, is underway. The August 23 low marked the end of wave 3{-13}, the middle wave of wave A{-12}’s five-wave structure. Wave 4{-13} will be followed by wave 5{-13}, the final wave within A{-12}. It would be reasonable to expected wave 5{-13} to carry the price down to the 50% Fibonacci retracement level, around 4074. (The Fibonacci retracement ladder is shown in red on the chart.)

Under the alternative analysis, the August 23 low was the end of wave 5{-13} and also the end of its parent, wave A{-12}. Under this scenario, wave B{-12} is now underway.

The principal analysis seems more proportional to me. Under the alternative analysis, a quite shallow reversal on August 22 is the 4th wave within A{-12} and is followed by an extremely small 5th wave. There’s no rule against it in Elliott wave analysis, but I think the more proportional reading of the chart, as the principal analysis has it, is more likely to be the correct interpretation.

In any case, wave B{-12} will be followed by downward wave C{-12}, which may fall below the wave A{-12} low and which will complete its parent, wave 4{-11}.

This is all happening within uptrending wave 3{-10}, which began on July 14 from 3723.75. When wave 4{-11} is complete, wave 5{-11} will most likely carry wave 3{-10} above August 16 high, 4327.50, and it will remain below the January 4 high, 4808.75, the beginning of wave 4{-1}, a major downward movement that may not be complete until 2023 or 2024.

Learning and other resources. Elliott wave analysis provides context, not prophecy. As the 20th century semanticist Alfred Korzybski put it in his book Science and Sanity (1933), “The map is not the territory … The only usefulness of a map depends on similarity of structure between the empirical world and the map.” And I would add, in the ever-changing markets, we can judge that similarity of structure only after the fact.

See the menu page Analytical Methods for a rundown on where to go for information on Elliott wave analysis.

By Tim Bovee, Portland, Oregon, August 25, 2022

Disclaimer

Tim Bovee, Private Trader tracks the analysis and trades of a private trader for his own accounts. Nothing in this blog constitutes a recommendation to buy or sell stocks, options or any other financial instrument. The only purpose of this blog is to provide education and entertainment.

No trader is ever 100 percent successful in his or her trades. Trading in the stock and option markets is risky and uncertain. Each trader must make trading decisions for his or her own account, and take responsibility for the consequences.

License
Creative Commons License

All content on Tim Bovee, Private Trader by Timothy K. Bovee is licensed under a Creative Commons Attribution-ShareAlike 4.0 International License.

Based on a work at www.timbovee.com.
Trader’s Notebook

3:30 p.m. New York time

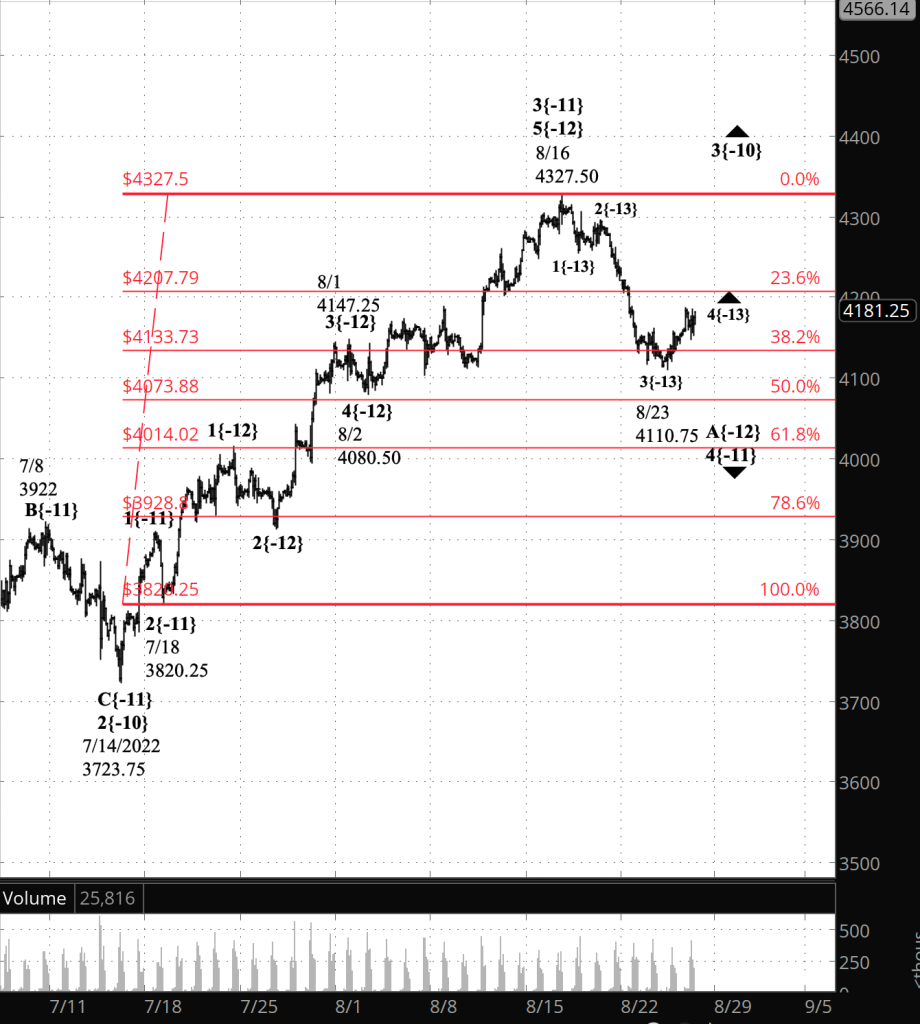
Half an hour before the closing bell. The S&P 500 has worked its way higher during the session, reaching into the 4150s on the futures. The rise isn’t enough to draw any conclusions about whether the first leg of the downward correction that began on August 16 is complete. That’s wave A{-12} within wave 4{-11}. So, no change in the analysis. I’ve updated the chart.

9:35 a.m. New York time

What’s happening now? The S&P 500 E-mini futures continued to trade in a narrow range overnight, falling to 4110.25 and then reversed, reaching back into the 4140s,

What does it mean? The downward correction that began on August 16 continues and is in its first of what will likely be three legs. When complete, the first leg will be followed by a rise that will remain below the August 16 peak, 4327.50, and then will fall again. If the correction forms the common three-leg pattern, then that fall will be the end of the correction and a rise that will probably reach above the August 16 peak.

What is the alternative? Each lower low could be the end of that first leg decline. The higher any reversal travels, the more likely it is that the alternative analysis best matches the chart.

[S&P 500 E-mini futures at 3:30 p.m., 110-minute bars, with volume]

What does Elliott wave theory say? Wave 4{-11}, a downward correction, began on August 14 from 4327.50. Internally, under the principal analysis, it is in the late stages of wave A{-12}, the first wave of the correction. Fourth waves tend to take the three-wave Flat pattern, with three waves within wave A, three within B and five within C (3-3-5).

The price has spent two trading sessions trading narrowly around the 38.2% Fibonacci retracement level (the Fibonacci ladder is shown on the chart in red). The most common end points for 4th wave are retracement levels 38.2%, 50% and 61.8%. Typically, the end point will be reached within the third subwave of the correction, wave C{-12} in this case.

Fourth waves tend to end within the range of the 4th subwave of the preceding 3rd-wave rise. Wave 4{-12} within wave 3{-11} ran from 4147.25 to 4080.50, so wave A{-12} is already within that range.

Wave 4{-11} will be followed by uptrending wave 5{-11}, which likely will carry the wave above 4327.50, the starting point of wave 4{-11}. Fifth waves sometimes fall short of that level, in which case it’s called a “truncated 5th”. Other times 5th waves add subwaves and rise higher, sometimes to extraordinary heights, in which case it’s called an “extended 5th”.

In any case, wave 5{-11} will remain below the January 4 high, 4808.25, which was the beginning of a major downward wave of much higher degree, wave 4{-1}.

Bottom line: We have some upside ahead but the future beyond that is a major downer, with the usual smaller ups and downs along the way.

Learning and other resources. Elliott wave analysis provides context, not prophecy. As the 20th century semanticist Alfred Korzybski put it in his book Science and Sanity (1933), “The map is not the territory … The only usefulness of a map depends on similarity of structure between the empirical world and the map.” And I would add, in the ever-changing markets, we can judge that similarity of structure only after the fact.

See the menu page Analytical Methods for a rundown on where to go for information on Elliott wave analysis.

By Tim Bovee, Portland, Oregon, August 24, 2022

Disclaimer

Tim Bovee, Private Trader tracks the analysis and trades of a private trader for his own accounts. Nothing in this blog constitutes a recommendation to buy or sell stocks, options or any other financial instrument. The only purpose of this blog is to provide education and entertainment.

No trader is ever 100 percent successful in his or her trades. Trading in the stock and option markets is risky and uncertain. Each trader must make trading decisions for his or her own account, and take responsibility for the consequences.

License
Creative Commons License

All content on Tim Bovee, Private Trader by Timothy K. Bovee is licensed under a Creative Commons Attribution-ShareAlike 4.0 International License.

Based on a work at www.timbovee.com.
Trader’s Notebook

3:30 p.m. New York time

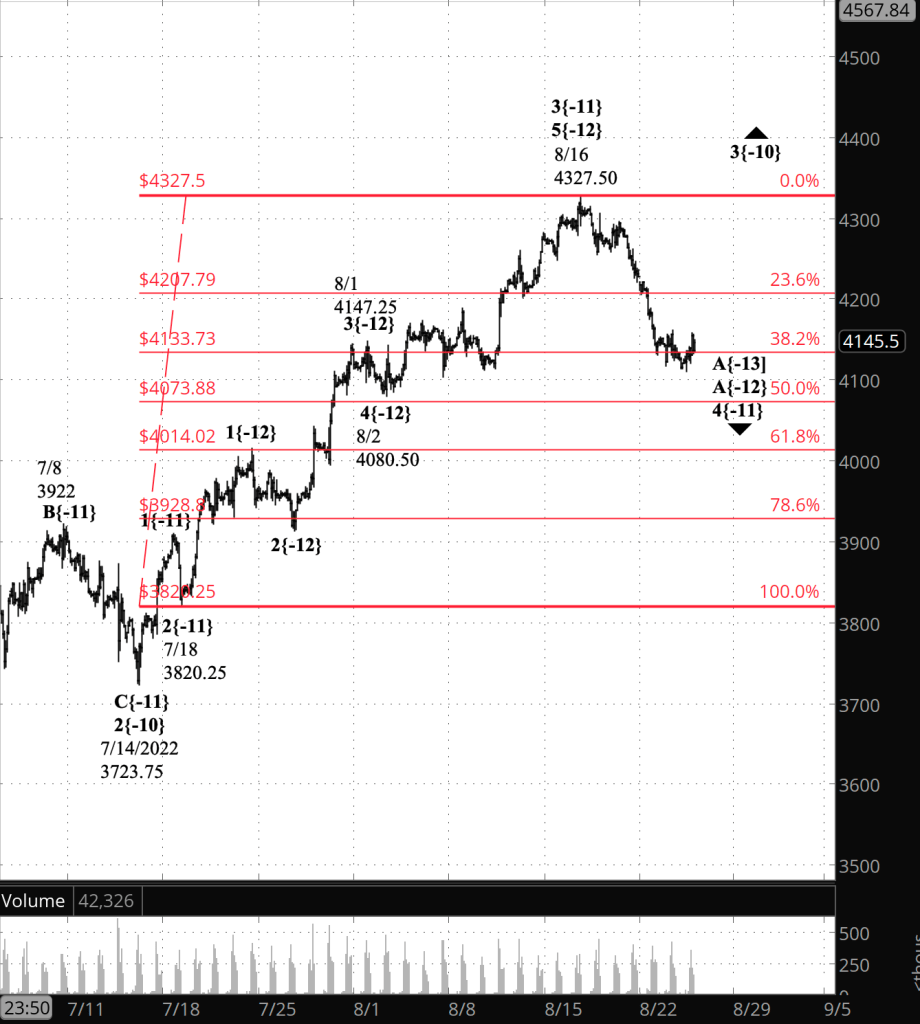
Half an hour before the closing bell. The S&P 500 has traded in a narrow range during the session, sticking close to the 38.2% Fibonacci retracement level, in the 4730s on the futures. The analysis is unchanged. I’ve updated the chart.

9:35 a.m. New York time

What’s happening now? The S&P 500 E-mini futures continued to fluctuate around the 38.2% Fibonacci retracement level in overnight trading, hitting a low of 4118.

What does it mean? The downward correction that began on August 16 continues and is in the first of three legs. In my experience, three Fibonacci retracement levels are most likely to be pause or reversal points in retracements: The 38.2% level, the 50% and the 61.8%.

What is the alternative? So far it’s unclear whether this pause will turn into a reversal or not. The low is within the correction’s target range. If it’s a reversal, then the second (middle) leg of the correction will begin, or has begun already.

[S&P 500 E-mini futures at 3:30 p.m., 100-minute bars, with volume]

What does Elliott wave theory say? The downward correction, wave 4{-11}, began on August 16 from 4370.50. Internally, it is its 1st wave, A{-12}. Under the principal analysis, wave A{-12} has more downside ahead of it. Under the alternative analysis, wave A{-12} ended at the overnight low, 4118, and wave B{-12} has begun its rise.

Fourth wave corrections tend to end within the 4th subwave of the preceding 3rd wave — that is, within the 4th wave of the wave that’s being corrected. Wave 4{-12} within wave 3{-11} went from 4147.25 down to 4080.50, and that’s the target range for the wave 4{-11} correction.

This is all happening within wave 3{-10}, an uptrend that began July 14 from 3723.75. In the larger picture, the S&P 500 is in a downtrend, wave 4{-1}, which began on January 4 from 4818.64.

Learning and other resources. Elliott wave analysis provides context, not prophecy. As the 20th century semanticist Alfred Korzybski put it in his book Science and Sanity (1933), “The map is not the territory … The only usefulness of a map depends on similarity of structure between the empirical world and the map.” And I would add, in the ever-changing markets, we can judge that similarity of structure only after the fact.

See the menu page Analytical Methods for a rundown on where to go for information on Elliott wave analysis.

By Tim Bovee, Portland, Oregon, August 23, 2022

Disclaimer

Tim Bovee, Private Trader tracks the analysis and trades of a private trader for his own accounts. Nothing in this blog constitutes a recommendation to buy or sell stocks, options or any other financial instrument. The only purpose of this blog is to provide education and entertainment.

No trader is ever 100 percent successful in his or her trades. Trading in the stock and option markets is risky and uncertain. Each trader must make trading decisions for his or her own account, and take responsibility for the consequences.

License
Creative Commons License

All content on Tim Bovee, Private Trader by Timothy K. Bovee is licensed under a Creative Commons Attribution-ShareAlike 4.0 International License.

Based on a work at www.timbovee.com.

Trader’s Notebook

6:25 p.m. New York time

Correction. I’ve corrected paragraph 2 of the 3:30 p.m. post to clarify that wave 5{-11} likely will move above the August 16 high but will remain below the January 4 high, when a major downward movement, wave 4{-1}, began.

3:30 p.m. New York time

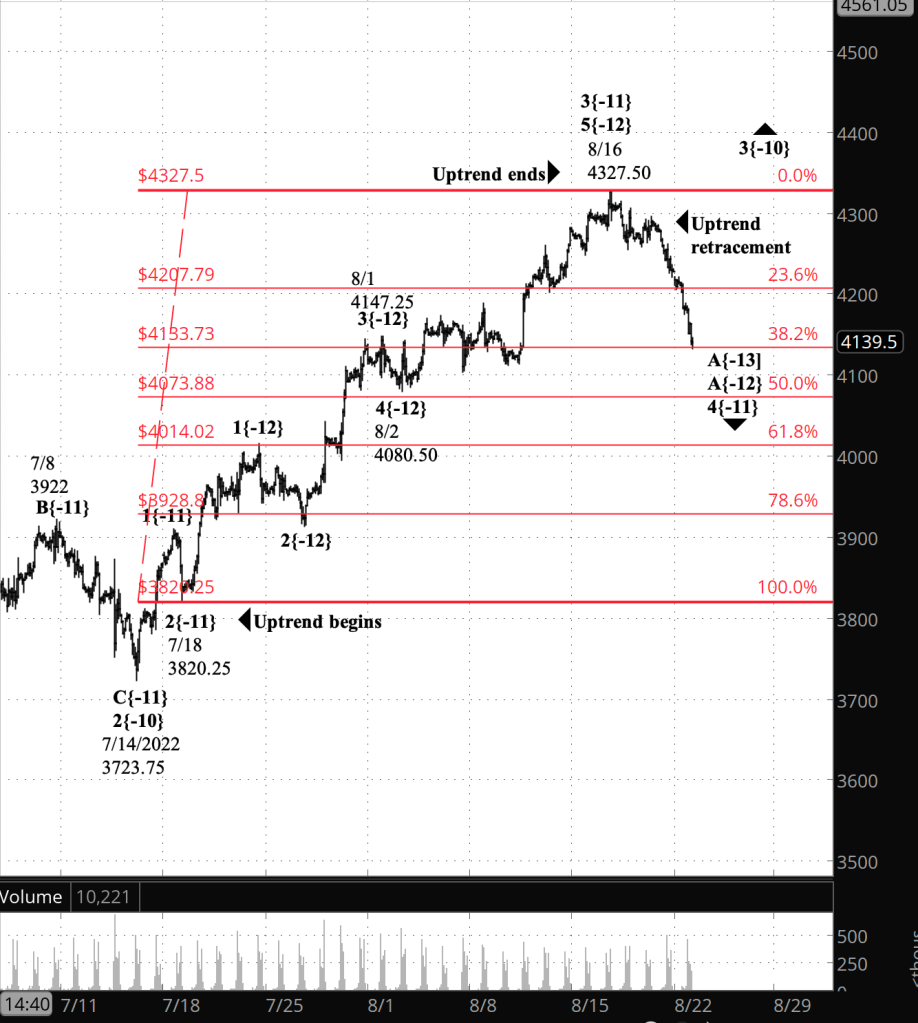
Half an hour before the closing bell. The S&P 500 E-mini futures having continued their decline during the session, reaching a low of 4133, a few cents below the 38.2% Fibonacci retracement level. The decline also put wave 4{-11} within the target range for a 4th wave, the range covered by wave 4{-12} in early August, within the preceding uptrend, wave 3{-11}, which ran from July 18 to August 16.

The downward correction, wave 4{-11}, is in its first internal wave, downward wave A{-12}, and if it takes the pattern of a Flat, as 4th waves tend to do, it still has two waves left before completion: Rising wave B{-12} and then downward wave C{-12}. Typically, the C wave will end the correction, and uptrending wave 5{-11} will begin its rise, most likely above the August 16 high, 4327.50, although it will remain below the January 4 high, 4808.25.

No change in the analysis. I’ve updated the chart.

9:35 a.m. New York time

What’s happening now? The S&P 500 E-mini futures continued to fall when trading resumed Sunday evening, reaching a low of 4170 shortly after the opening bell.

What does it mean? A downward correction that began on August 16 from 4237.50 is underway. So far it has retraced more than a quarter of the rise that began on July 18 from 3820.25.

What are the alternatives? The further the price falls, the less plausible the alternative analysis becomes, that the decline from August 16 is a correction within the uptrend from July 18. Less plausible falls short of impossible, so I’m keeping the alternative on the table for now.

The chart. I’ve superimposed a Fibonacci grid, in red, to provide context for the extent of the decline. So far the price has pushed beyond the 23.6% Fibonacci retracement level.

[S&P 500 E-mini futures at 3:30 p.m., 100-minute bars, with volume]

What does Elliott wave theory say? Under the principal analysis, the downward correction that began on August 16 is wave 4{-11} within a still ongoing uptrend, wave 3{-10}, which began on July 14 from 3723.75. Wave 4{-11} is retracing wave 3{-11}, which began on July 18 from 3820.25.

Internally, I count wave 4{-11} as being in the first wave, A{-13} within the larger first wave, A{-12}, of the downward correction. However, the early waves of a trend or correction are notoriously ambiguous regarding where they fit in the fractal hierarchy of Elliott wave analysis, and that is certainly the case here. “Fit in the fractal hierarchy” is a technical way of saying, “How big is this wave compared to other waves?”.

Since the correction is a 4th wave, it typically will end within the range of the 4th wave within the preceding 3rd wave, which is between the 4190s and the 4070s, a retracement between the 38.2% and 50% Fibonacci levels.

Under the alternative analysis, wave 3{-11} is continuing its rise that began on July 18.

Learning and other resources. Elliott wave analysis provides context, not prophecy. As the 20th century semanticist Alfred Korzybski put it in his book Science and Sanity (1933), “The map is not the territory … The only usefulness of a map depends on similarity of structure between the empirical world and the map.” And I would add, in the ever-changing markets, we can judge that similarity of structure only after the fact.

See the menu page Analytical Methods for a rundown on where to go for information on Elliott wave analysis.

By Tim Bovee, Portland, Oregon, August 22, 2022

Disclaimer

Tim Bovee, Private Trader tracks the analysis and trades of a private trader for his own accounts. Nothing in this blog constitutes a recommendation to buy or sell stocks, options or any other financial instrument. The only purpose of this blog is to provide education and entertainment.

No trader is ever 100 percent successful in his or her trades. Trading in the stock and option markets is risky and uncertain. Each trader must make trading decisions for his or her own account, and take responsibility for the consequences.

License
Creative Commons License

All content on Tim Bovee, Private Trader by Timothy K. Bovee is licensed under a Creative Commons Attribution-ShareAlike 4.0 International License.

Based on a work at www.timbovee.com.
Trader’s Notebook

3:30 p.m. New York time

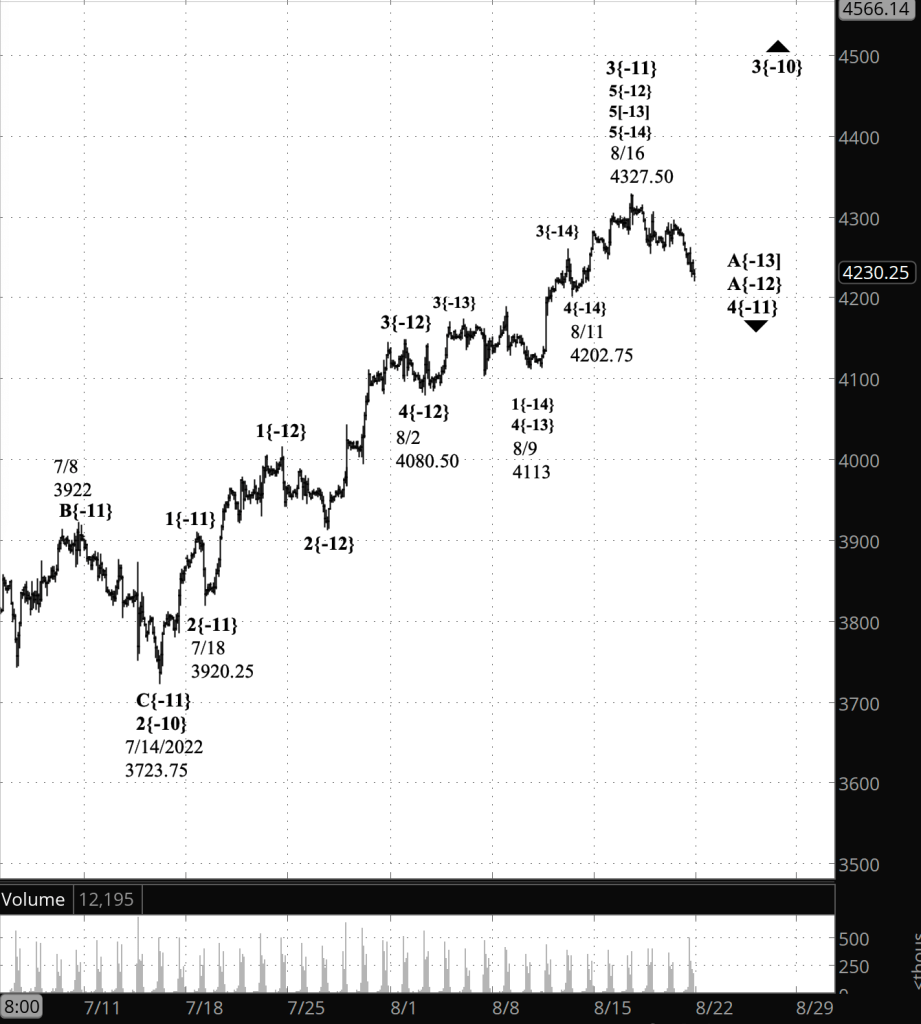
Half an hour before the closing bell. The S&P 500 has trended downward during the session, reaching a low so far of 4220.75 on the futures. Wave 4{-11}, a downward correction, continues. I’ve updated the chart.

9:35 a.m. New York time

What’s happening now? The S&P 500 E-mini futures fell overnight, reaching into the 4240s, nearly 90 points below the August 16 peak.

What does it mean? At this point I’d say that the principal analysis, shown on the chart, and the alternative analysis are of nearly equal likelihood.

I’ve switched the principal and the alternative from yesterday. Under the new principal analysis, the decline from the August 16 peak, 4237.50, is a downward correction of the rise that began on July 18. The August 16 peak was the end of the final leg of that uptrend, which began on August 9. Under this scenario, the correction is larger and the uptrend will eventually resume, but not quickly.

What are the alternatives? The alternative — yesterday’s principal analysis — is to consider the August 16 peak to be a stopping point within the ongoing uptrend and the subsequent decline to be a correction within that uptrend. Under this scenario, the correction is smaller and the uptrend will quickly resume.

[S&P 500 E-mini futures at 3:30 p.m., 100-minute bars, with volume]

What does Elliott wave theory say? There is a powerful ambiguity to the downtrend, and it points to a major difficulty in applying Elliott wave theory to a current chart.

Under the principal interpretation, the uptrend that began August 9 is wave 5{-13} within wave 5{-12} within wave 3{-11}. Internally, wave 5{-13} is in its final wave, 5{-14}, which began on August 11 from 4202.75.

Under the alternative interpretation, wave 5{-13} ended at the August 9 peak, as did its larger encompassing waves, 5{-12} and 3{-11}.

This sets up different scenarios for the decline. Under the principal analysis, the decline is wave A{-13} within wave A{-12} within wave 4{-11}, a downward correction. Fourth waves usually take the form of a Flat — three waves, the first two with three internal waves and the third with five internal waves (3-3-5). Under the alternative analysis, the decline is wave 4{-15} (perhaps), a 4th wave correction within uptrending wave 5{-14} within wave 5{-13}.

The decline so far has shown five waves, but that only means that they are of a smaller degree within wave A{-12} — perhaps wave 1{-14} or 1{-15} within wave A{-13} within wave A{-12}. Or it could be that the correction is forming a Zigzag pattern, with internal waves 5-3-5. A Zigzag 4th wave is slightly less common than a Flat, but it happens often enough.

I chose to switch the analyses from yesterday because the final wave of the uptrend, 5{-14}, was becoming disproportionate to the preceding third wave. That is, it seemed longer than usual, although there is no rule forbidding an extended 5th wave.

Of course, a reversal and a rise above the August 16 peak, 4237.50, will mean that my new principal analysis doesn’t match the chart and the alternative analysis is the better choice.

These ambiguities are happening within wave 3{-10}, an uptrend that began on July 14 from 3723.75. When wave 4{-11} is complete, it will be followed by an uptrend, wave 5{-11}, that will carry wave 3{-10} to completion and, most likely, to new heights.

Learning and other resources. Elliott wave analysis provides context, not prophecy. As the 20th century semanticist Alfred Korzybski put it in his book Science and Sanity (1933), “The map is not the territory … The only usefulness of a map depends on similarity of structure between the empirical world and the map.” And I would add, in the ever-changing markets, we can judge that similarity of structure only after the fact.

See the menu page Analytical Methods for a rundown on where to go for information on Elliott wave analysis.

By Tim Bovee, Portland, Oregon, August 19, 2022

Disclaimer

Tim Bovee, Private Trader tracks the analysis and trades of a private trader for his own accounts. Nothing in this blog constitutes a recommendation to buy or sell stocks, options or any other financial instrument. The only purpose of this blog is to provide education and entertainment.

No trader is ever 100 percent successful in his or her trades. Trading in the stock and option markets is risky and uncertain. Each trader must make trading decisions for his or her own account, and take responsibility for the consequences.

License
Creative Commons License

All content on Tim Bovee, Private Trader by Timothy K. Bovee is licensed under a Creative Commons Attribution-ShareAlike 4.0 International License.

Based on a work at www.timbovee.com.
Trader’s Notebook

3:30 p.m. New York time

Half an hour before the closing bell. The S&P 500 has traded narrowly day, ranging from the 4260s to the 4290s on the futures. No change in the analysis. The uptrend that began on August 9, wave 5{-13}, continues. I’ve updated the upper chart.

9:35 a.m. New York time

What’s happening now? The S&P 500 E-mini futures traded in a narrow range overnight, between the 4260s and the 4290s, remaining below the August 16 peak, 4327.50.

What does it mean? The shallowness of the pullback — the lack of energy to the downside — suggests to me that the uptrend that began on August 9 from 4113 is still underway and that the price will push beyond the most recent peak to a higher high. Under this principal analysis, the shallow decline has been a downward correction within that uptrend.

What is the alternative? As has been the case for several days, the alternative is that the August 16 peak was the end of the uptrend that began on August 9 and the subsequent shallow decline is the first, tentative step of a downtrend.

The charts. The upper chart is a close-up of the S&P 500 E-mini futures for July and August. The lower chart shows the entirety of the major bull market from December 2018 to the present.

[S&P 500 E-mini futures at 3:30 p.m., 100-minute bars, with volume]

What does Elliott wave theory say? The uptrend that began on August 9 is wave 5{-13}, the final wave of the trend within a larger uptrend, wave 5{-12}, which began on August 2 from 4080.50.

The fractal structure is in turn internal to wave 3{-11}, the middle wave of an uptrend that began on July 18 from 3920.25, which in turn is the middle subwave of a larger uptrend, wave 3{-10}, which began on July 14 from 3723.75.

When wave 5{-13} is complete — it ended on August 16 according to the alternative analysis and still has more upside to go according to the principal analysis — it will also be the end of its parent wave, 5{-12}, and also of wave 3{-11}, which is larger by one degree.

If we focus nine degrees larger, we find the market of July and August is a small portion of wave 4{-1}, a major downtrend that began on January 4 from 4818.62, which is in turn the penultimate subwave within wave 5{0}, an expanding Diagonal Triangle that is the final wave of an uptrend that began the day after Christmas, on December 26, 2018 from 2346.58 on the index, which reached a high, on August 16 at 4325.28.

What a nice Christmas present that rise of nearly 2,000 points has been for bullish traders. And when downtrending wave 4{-1} is complete, wave 5{-1} will resume that rise that began in 2018, carrying wave 5{0} to new heights.

[S&P 500 index at 9:33 a.m., 3-day bars]

Learning and other resources. Elliott wave analysis provides context, not prophecy. As the 20th century semanticist Alfred Korzybski put it in his book Science and Sanity (1933), “The map is not the territory … The only usefulness of a map depends on similarity of structure between the empirical world and the map.” And I would add, in the ever-changing markets, we can judge that similarity of structure only after the fact.

See the menu page Analytical Methods for a rundown on where to go for information on Elliott wave analysis.

By Tim Bovee, Portland, Oregon, August 18, 2022

Disclaimer

Tim Bovee, Private Trader tracks the analysis and trades of a private trader for his own accounts. Nothing in this blog constitutes a recommendation to buy or sell stocks, options or any other financial instrument. The only purpose of this blog is to provide education and entertainment.

No trader is ever 100 percent successful in his or her trades. Trading in the stock and option markets is risky and uncertain. Each trader must make trading decisions for his or her own account, and take responsibility for the consequences.

License
Creative Commons License

All content on Tim Bovee, Private Trader by Timothy K. Bovee is licensed under a Creative Commons Attribution-ShareAlike 4.0 International License.

Based on a work at www.timbovee.com.

Trader’s Notebook

3:30 p.m. New York time

Half an hour before the closing bell. The S&P 500 reached a low at mid-session, of 4255 on the futures, and then rose back to 4305.25, before once again taking a sharp decline, into the 4270s. The day’s decline had five wave internally, making it consistent with both a trending wave and the initial, A, wave within a Zigzag correction.

I’ve added a very short-term chart of the futures showing the decline from yesterday’s peak in detail, but without the degree subscripts. I’ve also updated the longer-term chart from this morning.

The decline could confirm the alternative analysis, that the 8/17 peak end the uptrend from August 9, as the alternative analysis has it, or it could be a correction within the uptrend, which is still underway, as the principal analysis has it. It’s ambiguous.

Meanwhile, for the moment, I’m sticking with my principal analysis.

[S&P 500 E-mini futures at 3:33 p.m., 5-minute bars]

9:35 a.m. New York time

What’s happening now? The S&P 500 E-mini futures fell sharply from yesterday’s high, 4327.50, reaching into the 4260s. The decline was sharp, beginning at 1:35 a.m. New York time before the London markets opened and continuing until they closed, at 7:30 a.m.

What does it mean? The principal analysis is the same as it was yesterday: The uptrend that began on August 9 continues and the decline is a downward correction within that uptrend. The sharpness of the decline increases the likelihood of the alternative analysis being correct.

What are the alternatives? The alternative is unchanged: Yesterday’s high could well have been the end of the uptrend and the beginning of a downward correction a couple of degrees larger. The greater the price decline, the more likely it is that 4327.50 was the end of the uptrend that began on August 9.

[S&P 500 E-mini futures at 3:30 p.m., 90-minute bars, with volume]

What does Elliott wave theory say? Elliott wave theory holds that the markets reflect the public mood and often lead events that alter that mood. The Federal Open Market Committee within the Federal Reserve releases minutes of its late July meeting at 2 p.m. today. That’s no surprise. It has been on the calendar for quite a long time. And personally, I doubt that there will be any surprises. Some market journalists have suggested that the market is worried because the minutes might reveal that FOMC discussed a Fed Funds rate increase higher than the 75 basis point hike they actually did.

It seems like an unlikely scenario to me. The FOMC’s next two-day meeting ends on September 21, and a lot can happen between now and then. It seems to me to be a poor theory of causality. Perhaps better to count the waves and see what they imply

Under my principal analysis, wave 5{-13} is continuing its rise. When it is complete, it will also mark the end of two larger waves, 5{-12} and 3{-11}. The next move will be a downtrend, wave 4{-11}, which will retrace a portion of wave 3{-11}, the uptrend that began on July 18 from 3920.25.

This is all happening within a series of larger waves, rising and falling, within a major downtrend that began on January 4 from from 4808.25, wave 4{-1}, which will likely carry the price below 3,000, perhaps significantly so.

That major decline will be followed by a rise to new highs, wave 5{-1}, which will complete wave 5{0}, an expanding Diagonal Triangle that began on December 26, 2018 from 2346.58 on the index.

Learning and other resources. Elliott wave analysis provides context, not prophecy. As the 20th century semanticist Alfred Korzybski put it in his book Science and Sanity (1933), “The map is not the territory … The only usefulness of a map depends on similarity of structure between the empirical world and the map.” And I would add, in the ever-changing markets, we can judge that similarity of structure only after the fact.

See the menu page Analytical Methods for a rundown on where to go for information on Elliott wave analysis.

By Tim Bovee, Portland, Oregon, August 17, 2022

Disclaimer

Tim Bovee, Private Trader tracks the analysis and trades of a private trader for his own accounts. Nothing in this blog constitutes a recommendation to buy or sell stocks, options or any other financial instrument. The only purpose of this blog is to provide education and entertainment.

No trader is ever 100 percent successful in his or her trades. Trading in the stock and option markets is risky and uncertain. Each trader must make trading decisions for his or her own account, and take responsibility for the consequences.

License
Creative Commons License

All content on Tim Bovee, Private Trader by Timothy K. Bovee is licensed under a Creative Commons Attribution-ShareAlike 4.0 International License.

Based on a work at www.timbovee.com.