Trader’s Notebook

3:30 p.m. New York time

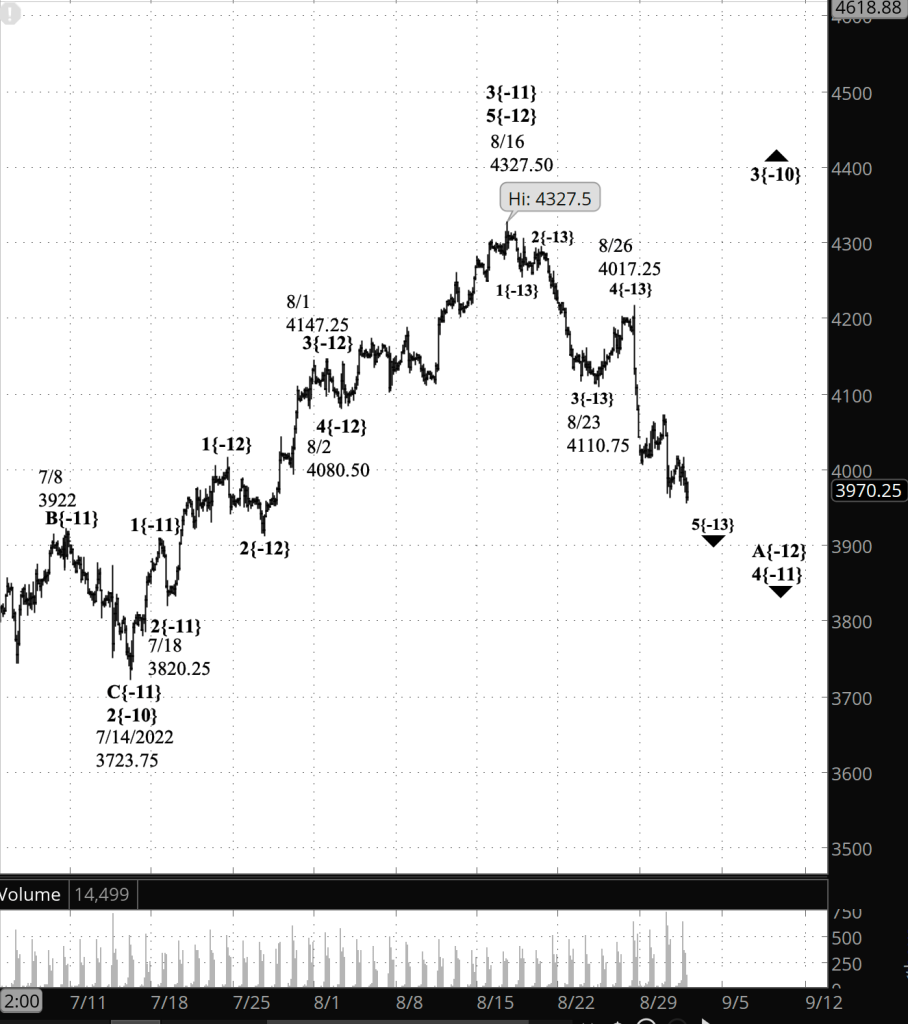
Half an hour before the closing bell. The S&P 500 continued to rise during the session, reaching into the 4130s. No change in the analysis. I’ve updated the chart.

9:35 a.m. New York time

What’s happening now? The S&P 500 E-mini futures had an opening gap of 30 points when trading resumed overnight and has so far reached a high of 4115.

What does it mean? The upward correction has risen above the end of the the first leg of the downtrend that began on August 30. This is contrary to a rule of Elliott wave analysis, and so I’ve re-analyzed the chart.

Under the new principal analysis, the middle wave of the downtrend that began on August 16 ended on September 9, and an upward correction is underway. See the Elliott wave theory section below for greater detail.

What are the alternatives? None at present, as is usually the case when the chart is re-analyzed. Unsurprising, really, since a goal of the reanalysis is to eliminate those pesky ambiguities.

[S&P 500 E-mini futures at 3:30 p.m., 55-minute bars, with volume]

What does Elliott wave theory say? The reanalysis was required because, under the old analysis, wave 4{-10} moved above the end of wave 1{-10}, all within downtrending wave 3{-9}. Elliott wave theory has a strict rule against that, which means the map no longer matched the territory. So I redrew the map.

See Friday’s Trader’s Notebook for the chart showing the former analysis.

Under the new principal analysis, the rise that began on September 6 is wave 4{-8}. Typically, a 4th wave will have three subwaves, and the present rise is wave A{-9}. Wave 1{-8} ended on August 17 at 4255, which is 140 points above the high so far within wave 4{-8}: 4115.

I’ve updated the “We Are Here” list of waves presently underway, from wave 4{-8}, which began last week, to wave 5{+3}, which began in July 1932.

We Are Here.

These are the waves currently in progress under my principal analysis. Each line on the list shows the wave number, with the subscript in curly brackets, the traditional degree name, the starting date, the starting price of the S&P 500 E-mini futures, and the direction of the wave.

  • S&P 500 Index:
  • 5{+3} Supercycle, 7/8/1932, 4.40 (up)
  • 5{+2} Cycle, 12/9/1974, 60.96 (up)
  • 5{+1} Primary, 3/6/2009, 666.79 (up)
  • 5{0} Intermediate, 12/26/2018, 2346.58 (up)
  • 4{-1} Minor, 1/4/2022 4818.62 (down)
  • 1{-2} Minute, 1/4/2022 4818.62 (down)
  • S&P 500 Futures and index:
  • 1{-3} Minuette, 1/4/2022, 4808.25 (down) (futures), 4818.62 (down) (index)
  • S&P 500 Futures:
  • 1{-4} Subminuette, 1/4/2022, 4808.25 (down)
  • 1{-5} Micro, 1/4/2022, 4808.25 (down)
  • 3{-6} Submicro, 8/16/2022, 4325.28 (down)
  • 1{-7} Minuscule, 8/16/2022, 4325.28 (down)
  • 4{-8} Subminuscule, 9/6/2022, 3883.50 (up)

Learning and other resources. Elliott wave analysis provides context, not prophecy. As the 20th century semanticist Alfred Korzybski put it in his book Science and Sanity (1933), “The map is not the territory … The only usefulness of a map depends on similarity of structure between the empirical world and the map.” And I would add, in the ever-changing markets, we can judge that similarity of structure only after the fact.

See the menu page Analytical Methods for a rundown on where to go for information on Elliott wave analysis.

By Tim Bovee, Portland, Oregon, September 12, 2022

Disclaimer

Tim Bovee, Private Trader tracks the analysis and trades of a private trader for his own accounts. Nothing in this blog constitutes a recommendation to buy or sell stocks, options or any other financial instrument. The only purpose of this blog is to provide education and entertainment.

No trader is ever 100 percent successful in his or her trades. Trading in the stock and option markets is risky and uncertain. Each trader must make trading decisions for his or her own account, and take responsibility for the consequences.

License
Creative Commons License

All content on Tim Bovee, Private Trader by Timothy K. Bovee is licensed under a Creative Commons Attribution-ShareAlike 4.0 International License.

Based on a work at www.timbovee.com.
Trader’s Notebook

3:30 p.m. New York time

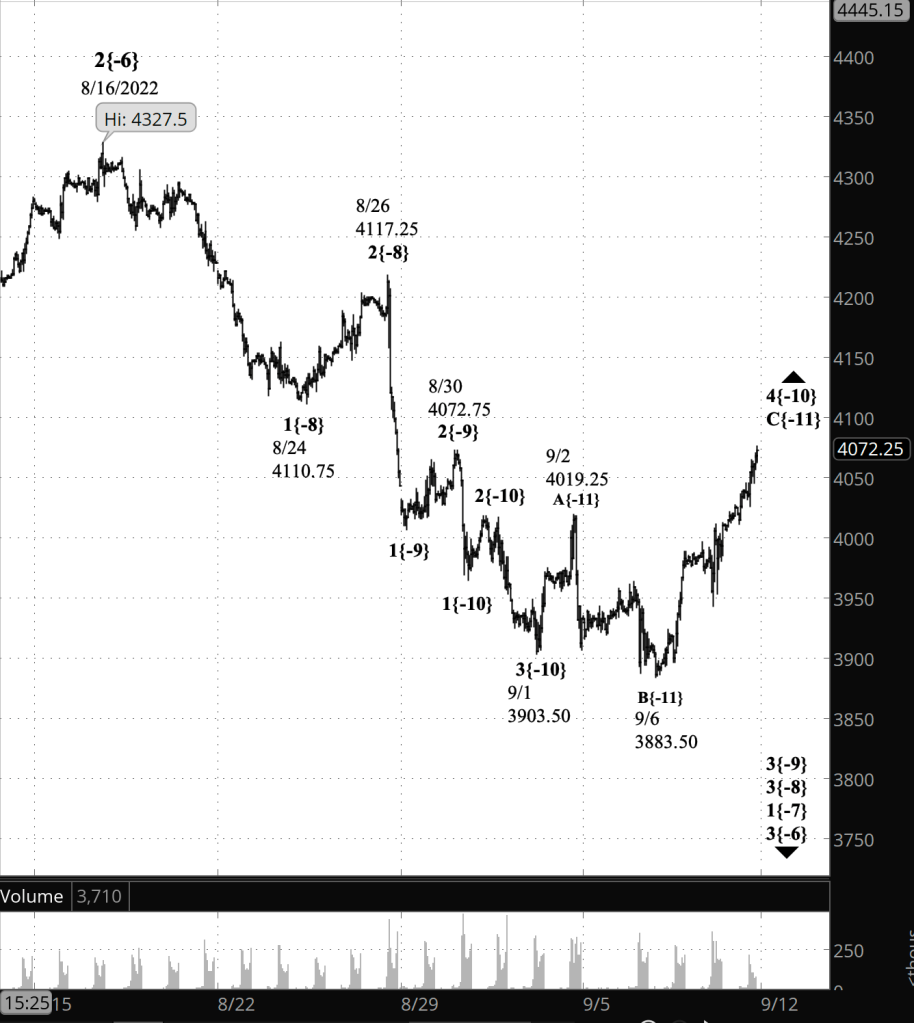
Half an hour before the closing bell. The S&P 500 continued to rise during the session, reaching 4075.50 on the futures. No change in the analysis. I’ve updated the chart.

9:35 a.m. New York time

What’s happening now? The S&P 500 E-mini futures continued to rise overnight, reaching 4045 as the opening bell approached.

What does it mean? The third leg of the upward correction that began on September 1 continues. Once the rise is complete, the correction will also be complete. It will be followed by a downtrend that will carry the price down into the 3800s or below.

What are the alternatives? There are two points of ambiguity.

Alternative #1: At this point we’re fishing for a top. Each new high is potentially the end of the correction.

Alternative #2: Typically a correction will contain one corrective pattern, but sometimes there will be two or three patterns, tied together with connecting waves in a compound correction. If the present correction takes the compound form, then the present rise will be followed by a connecting wave and then a second corrective pattern.

[S&P 500 E-mini futures at 3:30 p.m., 55-minute bars, with volume]

What does Elliott wave theory say? The upward correction, wave 4{-10} is now in its third wave, C{-11], which typically will be the end of the correction, which will be followed by wave 5{-10}, a resumption o the downtrend.

Under the first alternative, wave 4{-10} ended at the most recent high.

Under the second alternative, wave 4{-10} is taking a compound form, and when wave C{-11} is complete, it will be followed by a connecting wave, X{-11}, and then the first wave of a second corrective pattern within wave 4{-10}. Fourth waves are more likely to be compound corrections than are their 2nd-wave counterparts.

Learning and other resources. Elliott wave analysis provides context, not prophecy. As the 20th century semanticist Alfred Korzybski put it in his book Science and Sanity (1933), “The map is not the territory … The only usefulness of a map depends on similarity of structure between the empirical world and the map.” And I would add, in the ever-changing markets, we can judge that similarity of structure only after the fact.

See the menu page Analytical Methods for a rundown on where to go for information on Elliott wave analysis.

By Tim Bovee, Portland, Oregon, September 9, 2022

Disclaimer

Tim Bovee, Private Trader tracks the analysis and trades of a private trader for his own accounts. Nothing in this blog constitutes a recommendation to buy or sell stocks, options or any other financial instrument. The only purpose of this blog is to provide education and entertainment.

No trader is ever 100 percent successful in his or her trades. Trading in the stock and option markets is risky and uncertain. Each trader must make trading decisions for his or her own account, and take responsibility for the consequences.

License
Creative Commons License

All content on Tim Bovee, Private Trader by Timothy K. Bovee is licensed under a Creative Commons Attribution-ShareAlike 4.0 International License.

Based on a work at www.timbovee.com.

Trader’s Notebook

3:30 p.m. New York time

Half an hour before the closing bell. The S&P 500 moved higher this morning, reaching 4010.75 on the futures. No change in the analysis. I’ve updated the chart.

9:35 a.m. New York time

What’s happening now? The S&P 500 E-mini futures reached a high of 3996 in overnight trading and then retreated downward into the 3940s.

What does it mean? The overnight rise was the middle leg of the middle segment of the final wave in a corrective pattern that began on September 1. The decline that followed is the next-to-the-last segment of that middle wave. When the pullback is complete, the rise will resume, with a target range of 3999.25 to 4074.50. The end of the final wave is likely to be the end of the correction, which will be followed by a downtrend that will take the price down into the 3800s and perhaps lower.

What are the alternatives? There are two.

Alternative #1: Some corrections form a compound pattern, containing two or three corrective patterns. If that should happen in the present correction, then the first corrective pattern will be followed by a connector wave, and then by a second corrective pattern. The first corrective pattern may have ended at the overnight high.

Alternative #2: The correction ended at the overnight high..

[S&P 500 E-mini futures at 3:30 p.m., 45-minute bars, with volume]

What does Elliott wave theory say? The upward correction that began on September 1 is wave 4{-10}. It is presently in the final wave of the corrective pattern, wave C{-11}. Internally, the C wave completed its middle wave, 3{-12}, and is now in its next-to-the-last segment, wave 4{-12}. Wave 5{-12} will complete the corrective pattern.

The corrective pattern has taken the form of a Flat, and in a Flat, the C wave is usually between 1 and 1.65 times the length of the preceding A wave, which is 115.75 in length. Wave C{-11} began from 3883.50, giving it a price target ranging from 3999.25 to 4074.50.

If wave 4{-10} is a simple correction, then wave C{-11} will end the 4th wave and will be followed by wave 5{-10}, a downtrend that will most probably carry the price into the 3800s or lowers. Probably. Fifth waves sometime come up sort, called “truncation” in Elliott wave terminology. Sometimes the 5th wave will add to the normal five internal waves in an expansion, ending up with nine internal waves that carry the price further than expected.

Alternative #1: If wave 4{-10} is a compound correction, then wave C{-11} will be followed by downward wave X{-11}, a connector wave, and then by a second corrective pattern, which may differ from the first. Altogether a compound correction can have up to three corrective patterns. It’s possible that the first corrective pattern ended at the overnight high, 3996, and the subsequent decline is wave X{-11}.

Alternative #2: Wave 4{-10} ended overnight at 3996 and the subsequent decline is wave 5{-10}.

Learning and other resources. Elliott wave analysis provides context, not prophecy. As the 20th century semanticist Alfred Korzybski put it in his book Science and Sanity (1933), “The map is not the territory … The only usefulness of a map depends on similarity of structure between the empirical world and the map.” And I would add, in the ever-changing markets, we can judge that similarity of structure only after the fact.

See the menu page Analytical Methods for a rundown on where to go for information on Elliott wave analysis.

By Tim Bovee, Portland, Oregon, September 8, 2022

Disclaimer

Tim Bovee, Private Trader tracks the analysis and trades of a private trader for his own accounts. Nothing in this blog constitutes a recommendation to buy or sell stocks, options or any other financial instrument. The only purpose of this blog is to provide education and entertainment.

No trader is ever 100 percent successful in his or her trades. Trading in the stock and option markets is risky and uncertain. Each trader must make trading decisions for his or her own account, and take responsibility for the consequences.

License
Creative Commons License

All content on Tim Bovee, Private Trader by Timothy K. Bovee is licensed under a Creative Commons Attribution-ShareAlike 4.0 International License.

Based on a work at www.timbovee.com.
Trader’s Notebook

3:30 p.m. New York time

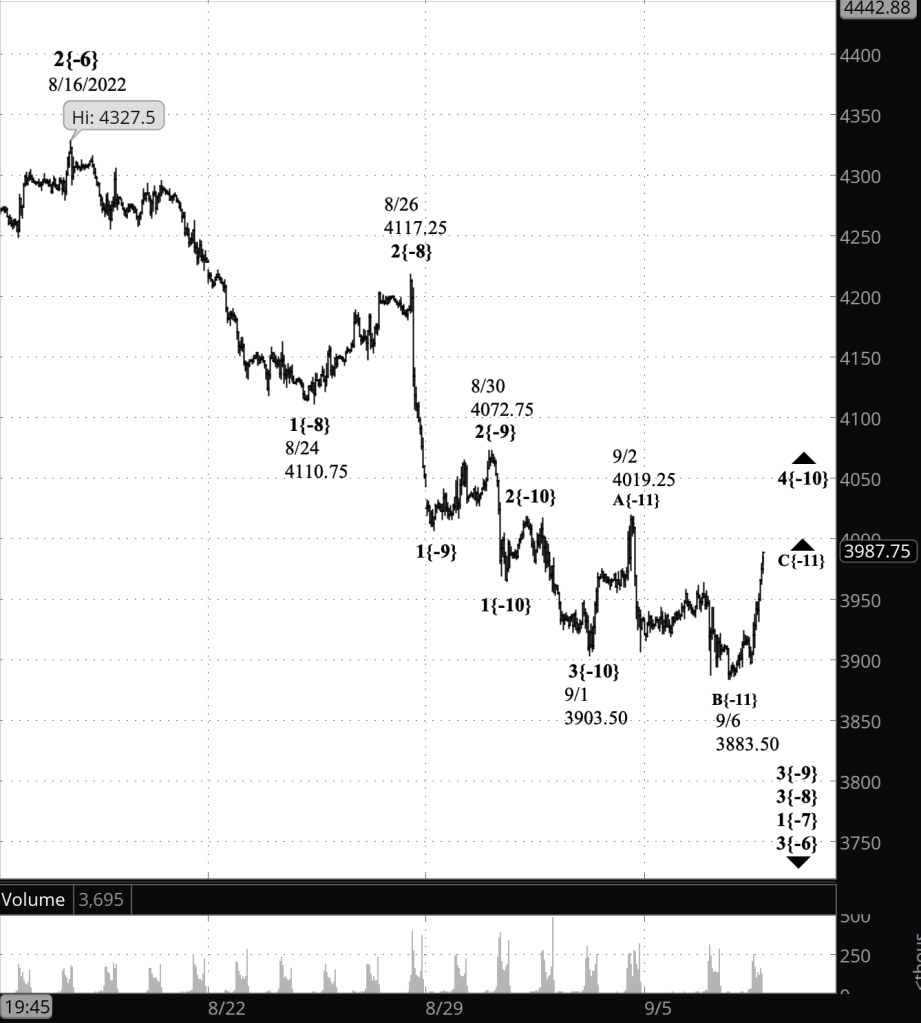
Half an hour before the closing bell. The S&P 500 continued to rise during the session, reaching into the 3980s on the futures so far. The rise is sufficient to persuade me that the alternative analysis from this morning best matches the chart, and I’ve changed the wave labelings to conform.

Under the new principal analysis, an upward corrective pattern that began on September 1 is underway and has entered its 3rd and final leg.

Switching to Elliott wave terminology, wave 4{-10}, an upward correction, began on September 1. Internally, its first wave, A{-11}, ended on September 2, its second wave, B{-11}, ended on September 6, and its 3rd wave, C{-11} is now underway.

The corrective pattern is taking the form of a Flat, and in a Flat, the C wave is usually between 1 and 1.65 times the length of the preceding A wave, which is 115.75 in length. Wave C{-11} began from 3883.50, giving it a price target ranging from 3999.25 to 4074.50.

A 4th wave sometimes forms a compound structure, combing two or three corrective patterns. If that happens here, then wave C{-11} will be followed by a downward connecting wave, X{-11}, and then wave A{-11} of a second corrective pattern.

I’ve updated the chart.

9:35 a.m. New York time

What’s happening now? The S&P 500 E-mini futures rose in overnight trading into the 3020s and then reversed, declining into the 3890s, afterward rising slightly.

What does it mean? The downtrend that began on September 2 continues.

What are the alternatives? The upward correction that began on September 1 continues.

[S&P 500 E-mini futures at 3:30 p.m., 45-minute bars, with volume]

What does Elliott wave theory say? Under the principal analysis, the S&P 500s position since September 2 has been in downtrending wave 5{-10} the final wave within a larger downtrend, wave 3{-9}, which began on August 30. Under this scenario, the price will continue to decline, perhaps significantly.

Under the alternative analysis, the S&P 500 is in wave B{-11}, the middle wave of an upward corrective pattern that began on September 1, wave 4{-10}. Under this scenario, the price will reverse soon and as wave C{-11}, will rise toward the end of the preceding wave, A{-11}, and perhaps will exceed that price, 4019.25.

The further the price drops, the less likely the alternative analysis becomes.

Learning and other resources. Elliott wave analysis provides context, not prophecy. As the 20th century semanticist Alfred Korzybski put it in his book Science and Sanity (1933), “The map is not the territory … The only usefulness of a map depends on similarity of structure between the empirical world and the map.” And I would add, in the ever-changing markets, we can judge that similarity of structure only after the fact.

See the menu page Analytical Methods for a rundown on where to go for information on Elliott wave analysis.

By Tim Bovee, Portland, Oregon, September 7, 2022

Disclaimer

Tim Bovee, Private Trader tracks the analysis and trades of a private trader for his own accounts. Nothing in this blog constitutes a recommendation to buy or sell stocks, options or any other financial instrument. The only purpose of this blog is to provide education and entertainment.

No trader is ever 100 percent successful in his or her trades. Trading in the stock and option markets is risky and uncertain. Each trader must make trading decisions for his or her own account, and take responsibility for the consequences.

License
Creative Commons License

All content on Tim Bovee, Private Trader by Timothy K. Bovee is licensed under a Creative Commons Attribution-ShareAlike 4.0 International License.

Based on a work at www.timbovee.com.

Trader’s Notebook

3:30 p.m. New York time

Half an hour before the closing bell. The S&P 500 fell during the session, reaching a low so far of 3886.75 on the futures, well below the end point of the preceding downtrending wave, 3903.50. This is could be important for the interpretation of the chart.

I’ll switch now to the terminology of Elliott wave analysis. The present downtrend is wave 5{-10}, and the preceding downtrend is wave 3{-10}. That’s the principal analysis, and the further the price falls, the more strongly this scenario is confirmed.

The alternative analysis of the last few days complicates the question. The alternative has wave 4{-10}, an upward correction, still underway. Under this scenario, the present downtrend is wave B{-11}, the middle of wave the correction.

Is it OK for a B wave to go below the starting point of the preceding A wave? Which is also the ending point of the preceding 3rd wave? If the correction is taking the form of a 4th-wave Zigzag, which is more common of 2nd waves, then it’s not OK. The rules of Elliott wave analysis forbid it and require a recount if the chart is counted that way. If the correction is a Flat, which more common in 4th waves, then there’s no problem. The internal structure of Zigzags is five waves in wave A, three in B, and five in C (5-3-5). The internal structure of Flags is 3-3-5.

Wave A{-11} within wave A{-10} looks like it has three waves within it to me. Although if I zoom in, then I can also manage a count of five waves. As is so often the case with Elliott wave analysis, there are ambiguities.

Given the fact that a Flat is more common in 4th waves, I’m going to stay with that interpretation, but also will stick with my principal analysis, which says that the upward correction ended on September 2. A quick reversal and a rise above the September 2 high, 4019.25, would keep both the principal and the alternative analyses viable. A continuing and significant decline would eliminate the alternative analysis.

I’ve updated the chart.

9:35 a.m. New York time

What’s happening now? The S&P 500 E-mini futures continued to work their way higher after trading resumed Monday evening, reaching into the 3960s in the hours before the opening bell and then early in the session dropping back into the 3930s

What does it mean? The rise from Friday’s low, 3906, is the first leg of an upward correction within a downtrend that began on Friday from 4019.25. The rise, so far quite small, will be followed by a downward movement and then a final rise that will complete the corrective pattern.

What is the alternative? The upward correction that began on September 1 is still underway. Friday’s peak was the end of the first leg of the correction, the subsequent decline was the second leg leg, and weak rise that began on Friday is the third leg, which is still underway.

[S&P 500 E-mini futures at 3:30 p.m., 45-minute bars, with volume]

What does Elliott wave theory say? Under the principal analysis, downtrending wave 5{-10} is underway and, internally, has entered its first upward correction, wave 2{-11}. The 2nd wave in turn is in its second segment, wave B{-12}. The B wave will be followed by wave C{-12}, which will complete the correction and which will be followed in turn by wave 3{-11}, the powerful middle wave within wave 5{-10}.

Under the alternative analysis, an upward correction, wave 4{-10}, is still underway and is in its 3rd and likely final segment, wave C{-11}. Sometimes 4th waves will form a compound structure, linking two or three corrective patterns together. If that’s the case, then wave C{-11} will be followed by a connector, wave X{-11}, and then another wave A{-11}, the start of the second corrective pattern.

This is all happening within a nested series of downtrending waves. From smaller to larger, they are wave 3{-9}, which began on August 30; wave 3{-8}, on August 26; wave 1{-7}, on August 16; and wave 3{-6}, also on August 16. The entirety of the decline that began on January 4 from 4808.25 is within wave 4{-1}, the next to the last wave in a very large expanding Diagonal Triangle, wave 5{0}, that began on December 26, 2018.

Learning and other resources. Elliott wave analysis provides context, not prophecy. As the 20th century semanticist Alfred Korzybski put it in his book Science and Sanity (1933), “The map is not the territory … The only usefulness of a map depends on similarity of structure between the empirical world and the map.” And I would add, in the ever-changing markets, we can judge that similarity of structure only after the fact.

See the menu page Analytical Methods for a rundown on where to go for information on Elliott wave analysis.

By Tim Bovee, Portland, Oregon, September 6, 2022

Disclaimer

Tim Bovee, Private Trader tracks the analysis and trades of a private trader for his own accounts. Nothing in this blog constitutes a recommendation to buy or sell stocks, options or any other financial instrument. The only purpose of this blog is to provide education and entertainment.

No trader is ever 100 percent successful in his or her trades. Trading in the stock and option markets is risky and uncertain. Each trader must make trading decisions for his or her own account, and take responsibility for the consequences.

License
Creative Commons License

All content on Tim Bovee, Private Trader by Timothy K. Bovee is licensed under a Creative Commons Attribution-ShareAlike 4.0 International License.

Based on a work at www.timbovee.com.
Trader’s Notebook

10:25 a.m. New York time

What’s happening now? The S&P 500 E-mini futures scribbled in a narrow range after trading resumed Sunday evening, fluctuating between 3915 and 3942. U.S. markets are closed today for the Labor Day holiday and will resume trading on Tuesday. This will be my only update today, unless the market breaks significantly out of that narrow range.

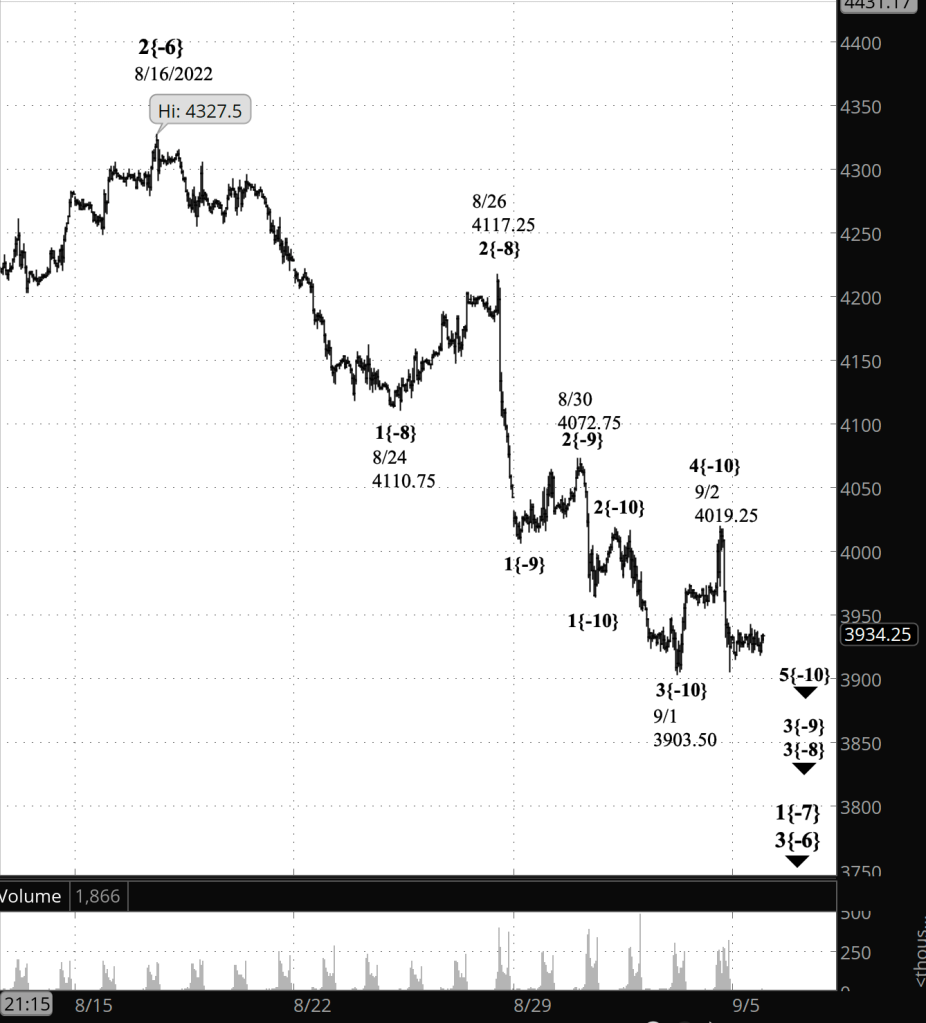
What does it mean? The analysis is unchanged from Friday. The downtrend that began from Friday’s peak, 4019.25, continues, having fallen more than 100 points. Under this scenario, the decline will continue when the U.S. markets re-open, reaching below 3903.50, the beginning of the upward correction, and perhaps significantly below that point.

What are the alternatives? Under another scenario, Friday’s peak was the end of the first leg of an upward correction that began on September 1, and the decline from Friday’s peak is the second leg of the ongoing correction. Under this scenario, the decline will reverse soon, taking the price back to the 4019.25, the end of the first leg of the correction, and perhaps higher.

[S&P 500 E-mini futures at 7:25 a.m., 45-minute bars, with volume]

What does Elliott wave theory say? Under the principal analysis, downtrending wave 5{-10} is underway. The pause during holiday trading can be interpreted as wave 2{-11} within 5{-10}. When that 2nd wave is complete, wave 3{-11} will the price within wave 5{-10} significantly lower.

Under the alternative analysis, wave A{-11} within wave 4{-10} ended on Friday, and wave B{-11} began. Wave B{-11} can be expected to end soon, and it will be followed by wave C{-11}, which will carry the price back to Friday’s peak and perhaps higher.

This is all happening within a nested series of downtrending waves. From smaller to larger, they are wave 3{-9}, which began on August 30; wave 3{-8}, on August 26; wave 1{-7}, on August 16; and wave 3{-6}, also on August 16. The entirety of the decline that began on January 4 from 4808.25 is within wave 4{-1}, the next to the last wave in a very large expanding Diagonal Triangle, wave 5{0}, that began on December 26, 2018.

Learning and other resources. Elliott wave analysis provides context, not prophecy. As the 20th century semanticist Alfred Korzybski put it in his book Science and Sanity (1933), “The map is not the territory … The only usefulness of a map depends on similarity of structure between the empirical world and the map.” And I would add, in the ever-changing markets, we can judge that similarity of structure only after the fact.

See the menu page Analytical Methods for a rundown on where to go for information on Elliott wave analysis.

By Tim Bovee, Portland, Oregon, September 5, 2022

Disclaimer

Tim Bovee, Private Trader tracks the analysis and trades of a private trader for his own accounts. Nothing in this blog constitutes a recommendation to buy or sell stocks, options or any other financial instrument. The only purpose of this blog is to provide education and entertainment.

No trader is ever 100 percent successful in his or her trades. Trading in the stock and option markets is risky and uncertain. Each trader must make trading decisions for his or her own account, and take responsibility for the consequences.

License
Creative Commons License

All content on Tim Bovee, Private Trader by Timothy K. Bovee is licensed under a Creative Commons Attribution-ShareAlike 4.0 International License.

Based on a work at www.timbovee.com.

Trader’s Notebook

3:30 p.m. New York time

Half an hour before the closing bell. The S&P 500 futures reached 4019.25 during the session and then sharply reversed, so far reaching back into the 3920s. The sharpness of the reversal suggests to me that the peak was the end of the upward correction discussed this morning, wave 4{-10}, and that wave 5{-10}, a resumption of the downtrend, is now underway. A move below 3903.50, the start of the correction, would strengthen that interpretation. A reversal and a move above 4019.25 would strengthen an alternative scenario, that today’s peak was the end of the first wave within the correction, wave A{-11}. I’ve updated the chart.

9:35 a.m. New York time

Monday, a market holiday. U.S. markets will be closed on Monday for the Labor Day holiday. The S&P 500 E-mini futures are traded internationally, and often there will be price updates during a holiday period. If there are any significant price changes on Monday, I’ll post a Trader’s Notebook update.

What’s happening now? The S&P 500 E-mini futures rose as the opening bell approached, coinciding with the release of August’s jobs numbers in the U.S., showing a 315,000 increase in non-farm payroll employment and also a 0.2 percentage point rise in the unemployment rate, to 3.7%.

What does it mean? The rise carried the upward correction that began on September 1 into the low 4000s, more than 100 points above where the correction began. The correction, when complete, will be followed by a resumption of the downtrend that began on August 30 from 4072.75.

What are the alternatives? Internally, the correction is in its 3rd leg. How should this be interpreted? As the 3rd and final leg of the correction? As the final leg of the first leg within the correction (if it takes the form of a Flat)? Or as the middle wave within the first leg of the correction (if it takes the form of a Zigzag)? It’s too soon to tell, but the choices are worth keeping in mind while studying the chart.

[S&P 500 E-mini futures at 3:30 p.m., 45-minute bars, with volume]

What does Elliott wave theory say? Under the principal analysis, wave 4{-10} is underway. The wave is an upward correction that began on September 1 from 3902.50. The correction will be followed by a resumption of the downtrend that began on August 30 from 4072.75, as wave 5{-10}, which is likely to carry the price below 3902.50, the starting point of the correction.,

All of this is happening with wave 3{-9}, a downtrend that began on on August 30, which in turn is the middle wave of wave 3{-8}, which began on August 26 from 4117.25. The parent wave of the entire structure is wave 1{-7}, the initial wave within downtrending wave 3{-6}. Both began on August 16 from 4327.50.

The major trend that will dominate the markets for months to come, maybe for a year or so, is five degrees larger, wave 4{-1}, a downtrending wave that began on January 4 from 4808.25. It is the next-to-the-last wave within a very large expanding Diagonal Triangle, wave 5{0}, that began on December 26, 2018 from 2346.58 and that reached its low, so far, of 2191.86 on February 23, 2020, the end of the early pandemic crash.

Learning and other resources. Elliott wave analysis provides context, not prophecy. As the 20th century semanticist Alfred Korzybski put it in his book Science and Sanity (1933), “The map is not the territory … The only usefulness of a map depends on similarity of structure between the empirical world and the map.” And I would add, in the ever-changing markets, we can judge that similarity of structure only after the fact.

See the menu page Analytical Methods for a rundown on where to go for information on Elliott wave analysis.

By Tim Bovee, Portland, Oregon, September 2, 2022

Disclaimer

Tim Bovee, Private Trader tracks the analysis and trades of a private trader for his own accounts. Nothing in this blog constitutes a recommendation to buy or sell stocks, options or any other financial instrument. The only purpose of this blog is to provide education and entertainment.

No trader is ever 100 percent successful in his or her trades. Trading in the stock and option markets is risky and uncertain. Each trader must make trading decisions for his or her own account, and take responsibility for the consequences.

License
Creative Commons License

All content on Tim Bovee, Private Trader by Timothy K. Bovee is licensed under a Creative Commons Attribution-ShareAlike 4.0 International License.

Based on a work at www.timbovee.com.

Trader’s Notebook

3:30 p.m. New York time

Half an hour before the closing bell. I noted this morning that the S&P 500 was close to violating a rule of Elliott wave analysis under the principal scenario I’ve been working with for the past month or so. And around midday, it did just that, reaching a low of 3903.50. I discussed the rule in question in this morning’s post, below.

When an analysis falls afoul of a rule, it’s not the case that the market got it wrong. It’s that the analysis doesn’t match the reality of the chart. Down toward the end of every Trader’s Notebook I quote the 20th century semanticist Alfred Korzybski, who wrote: “The map is not the territory … The only usefulness of a map depends on similarity of structure between the empirical world and the map.”

And that’s what happened today. The map no longer matched the territory, the empirical world had developed differently, and as is always the case when that happens, it’s time to redraw the map. I’ve retained the chart posted this morning, which shows the earlier analysis, now outdated by the new analysis.

A good basis for any analysis is the adage, “When in doubt, return to the beginning.” The beginning on stock charts in September 2022 is the high of January 4, 2022, which marked the end of a major rise that began on February 23, 2020, the low point of the early pandemic crash.

The decline after January 4 is a major correction within that rise. And within that corrective decline, the market movements are structured as a series of smaller downtrends and upward corrections, as we would expect, given the fractal nature of the market’s charts.

At this point, I’m going to switch to Elliott wave terminology, first posting a chart that shows the S&P 500 E-mini futures from the January 4 peak to the present, marked with the new analysis.

[S&P 500 E-mini futures at 3:30 p.m., 10-hour bars, with volume]

Under my new principal analysis, the downward correction that began on January 4 is wave 4{-1} within a larger expanding Diagonal Triangle, wave 5{0}, which began on December 27, 2018.

Early on in a trend, the degree of the wave being tracked is more or less a guess. I’ve chosen to treat the decline from January 4 to June 16 was wave 1{-6} within wave 4{-1}. The preceding rise, wave 3{-1}, took nearly two years to complete, so the {-6} degree for the first wave down doesn’t seem out of proportion. That may well change as wave 4{-1} continues to unfold.

Wave 1{-6} has been followed by an upward correction, wave 2{-6}, which ended on August 16. Alternatively, the August 16 high could be the end of wave A{-7}, the first leg of the correction.

Under the principal analysis, the decline that began on August 16 is downtrending wave 3{-6}, and internally it is in the middle leg, wave 3{-8} within the larger downtrend, wave 3{-6}.

This is all happening within a nested series of larger 1st waves, from wave 1{-5} up to wave 1{-2}, all of which began on January 4. And of course, above wave 1{-2} is wave 4{-1}, discussed above.

Here is a chart of the S&P 500 index showing the entire expanding Diagonal Triangle that began in December 2018.

[S&P 500 index, 3-day bars, with volume]

Beginning with tomorrow’s Trader’s Notebook, I’ll focus more closely on understanding the new analysis of the internals of the decline that began on August 16.

10 a.m. New York time

NTNX earnings play exit. I’ve exited my short bull put options spread on NTNX for 66.3% of maximum potential profit and have updated the trade analysis with full results.

9:35 a.m. New York time

What’s happening now? The S&P 500 E-mini futures fell further overnight, reaching a low of 3921.

What does it mean? The downtrend within a downward correction that began on August 16 continues.

What are the alternatives? The preceding uptrend that began on July 14 ended on August 16 and the subsequent decline is a downtrend of higher degree than the principal analysis would have it.

The chart. I’ve added in the Fibonacci retracement ladder, in red, showing that the retracement has reached the 78.6% level.

[Outdated analysis: S&P 500 E-mini futures at 9:35 a.m., 2-hour bars, with volume]

What does Elliott wave theory say? Under the principal analysis, wave 4{-11} within uptrending wave 3{-10}, a downward retracement, has been underway since August 16. A 78.6% retracement is deep for a 4th wave. Typically, this 4th wave would have ended around the 38.2% to 50% retracements. But that’s a tendency, not a rule, and the analysis complies with the rules of Elliott wave analysis.

There are very few rules that apply to 4th waves. One is that it cannot move past the end of the preceding wave 1, which was at 3909.50 in this case — wave 1{-11} on July 18. The overnight low is only 11.5 points above that level, which means that wave 4{-11}, under the principal analysis, is perilously close to breaking an Elliott rule. If it does, then the alternative analysis normally would replace the present principal analysis.

Under the alternative analysis, the August 16 peak was the end of wave 5{-11} within wave 3{-10}. That is, the internal count of the rise from July 14 to August 16 would be revised. the subsequent decline is wave 4{-10}. However, wave 4{-10} under this scenario has moved beyond the end of wave 1{-10}, which peaked on June 28 at 3950, breaking a rule of Elliott wave analysis.

So the count will have to be revised in some other way. Figuring that out is my project for today.

Learning and other resources. Elliott wave analysis provides context, not prophecy. As the 20th century semanticist Alfred Korzybski put it in his book Science and Sanity (1933), “The map is not the territory … The only usefulness of a map depends on similarity of structure between the empirical world and the map.” And I would add, in the ever-changing markets, we can judge that similarity of structure only after the fact.

See the menu page Analytical Methods for a rundown on where to go for information on Elliott wave analysis.

By Tim Bovee, Portland, Oregon, September 1, 2022

Disclaimer

Tim Bovee, Private Trader tracks the analysis and trades of a private trader for his own accounts. Nothing in this blog constitutes a recommendation to buy or sell stocks, options or any other financial instrument. The only purpose of this blog is to provide education and entertainment.

No trader is ever 100 percent successful in his or her trades. Trading in the stock and option markets is risky and uncertain. Each trader must make trading decisions for his or her own account, and take responsibility for the consequences.

License
Creative Commons License

All content on Tim Bovee, Private Trader by Timothy K. Bovee is licensed under a Creative Commons Attribution-ShareAlike 4.0 International License.

Based on a work at www.timbovee.com.

NTNX Trade

Nutanix Inc. (NTNX)

Update 9/1/2022: I exited my short bull put vertical spread on NTNX, 50 days before expiration, for a $0.32 debit per contract/share, a profit before fees of $63 per contract. Shares were trading at $21.50, up $3.83 from the entry level.

The Implied Volatility Rank at exit was 51.3%, down 27.9 points from the entry level.

I exited on the day after entry because the position reached 66.3% of maximum potential profit, well above the 25% of max that is my normal exit point for earnings plays.

Shares rose by 21.7% over one day for a +7,911% annual rate. The options position produced a 196.9% return for a +71,859% annual rate.


I have entered a short bull put vertical spread on NTNX, using options that trade for the last time 51 days hence, on October 21. The premium is a $0.95 credit per contract share and the stock at the time of entry was priced at $17.67.

The Implied Volatility Ratio stood at 79.2%.

Premium:$0.95Expire OTM
NTNX-bull put spreadStrikeOddsDelta
Puts
Long15.0067.2%22
Break-even18.4557.6%31
Short17.5048.0%40

The premium is 76% of the width of the position’s short/long spread. The profit zone covers a 4.4% move to the downside and an unlimited move to the upside.

The risk/reward ratio is 1.6:1, with maximum risk of $155 and maximum reward of $95 per contract.

How I chose the trade. The trade was placed to coincide with NTNX’s earnings announcement, after the closing bell on the day of entry. The short strikes were set to coincide with the expected move of $0.76 either way, based on options pricing, which gives a price range of $17.37 to $18.88. The Zacks Investment Research earnings surprise predictor gave NTNX a score of 4.66%, with a rank of 3. The Zacks momentum and overall style scores were both C.

By Tim Bovee, Portland, Oregon, August 31, 2022

Disclaimer

Tim Bovee, Private Trader tracks the analysis and trades of a private trader for his own accounts. Nothing in this blog constitutes a recommendation to buy or sell stocks, options or any other financial instrument. The only purpose of this blog is to provide education and entertainment.

No trader is ever 100 percent successful in his or her trades. Trading in the stock and option markets is risky and uncertain. Each trader must make trading decisions for his or her own account, and take responsibility for the consequences.

License
Creative Commons License

All content on Tim Bovee, Private Trader by Timothy K. Bovee is licensed under a Creative Commons Attribution-ShareAlike 4.0 International License.

Based on a work at www.timbovee.com.

Trader’s Notebook

3:30 p.m. New York time

Half an hour before the closing bell. The S&P 500 continued to fall during the session, reaching beyond the overnight low down to 3956.50 on the futures. No change in the analysis. Downward wave 5{-13} with wave A{-12} within 4{-11} is still underway. I’ve updated the chart.

1 p.m. New York time

NTNX earnings play entry. I’ve entered a short bull put vertical spread on NTNX, using options that trade for the last time on October 21, and have posted an analysis of the trade.

9:35 a.m. New York time

What’s happening now? The S&P 500 E-mini futures reached a low overnight of 3979.25 and then bounced slightly.

What does it mean? The sharp price drop that began on August 26 continues, although at a more moderate pace.

What are the alternatives? There are two.

Alternative #1: The overnight low was the end of the price drop and an uptrend is underway.

Alternative #2: The uptrend that began on June 14 ended on August 16 and a larger downward movement is underway.

[S&P 500 E-mini futures at 3:30 p.m., 2-hour bars, with volume]

What does Elliott wave theory say? Under the principal analysis, downward wave 5{-13} within wave A{-12} within wave 4{-11}, a downward correction, is underway. It will be followed by a B wave to the upside, and then a continuation of the correction with a C wave to the downside.

Under the first alternative analysis, the overnight low marked the end of wave 4{-11}, and uptrending wave 5{-11} is now underway and will reach into the 4300s.

Under the second alternative, the August 16 peak was the end of wave 5{-11} and its parent, wave 3{-10}, which began on July 14. This scenario sees a downward correction, wave 4{-10}, as being underway.

Learning and other resources. Elliott wave analysis provides context, not prophecy. As the 20th century semanticist Alfred Korzybski put it in his book Science and Sanity (1933), “The map is not the territory … The only usefulness of a map depends on similarity of structure between the empirical world and the map.” And I would add, in the ever-changing markets, we can judge that similarity of structure only after the fact.

See the menu page Analytical Methods for a rundown on where to go for information on Elliott wave analysis.

By Tim Bovee, Portland, Oregon, August 31, 2022

Disclaimer

Tim Bovee, Private Trader tracks the analysis and trades of a private trader for his own accounts. Nothing in this blog constitutes a recommendation to buy or sell stocks, options or any other financial instrument. The only purpose of this blog is to provide education and entertainment.

No trader is ever 100 percent successful in his or her trades. Trading in the stock and option markets is risky and uncertain. Each trader must make trading decisions for his or her own account, and take responsibility for the consequences.

License
Creative Commons License

All content on Tim Bovee, Private Trader by Timothy K. Bovee is licensed under a Creative Commons Attribution-ShareAlike 4.0 International License.

Based on a work at www.timbovee.com.