Trader’s Notebook

3:30 p.m. New York time

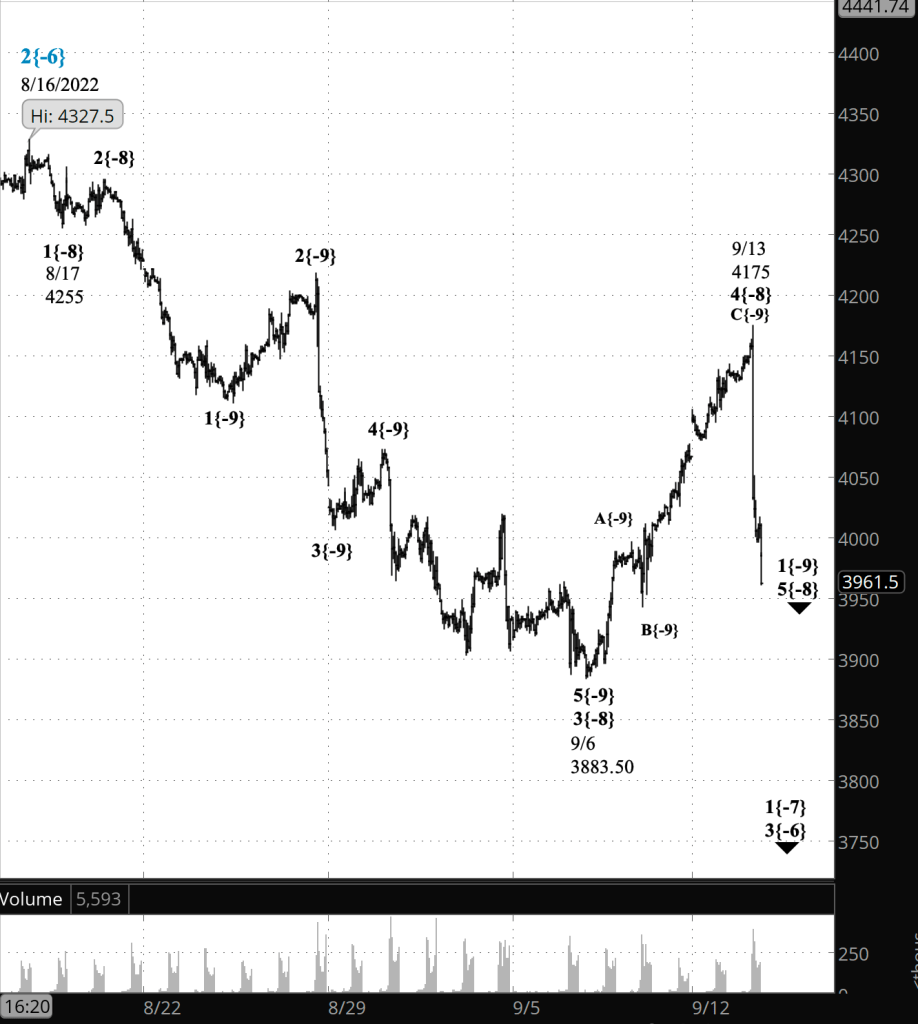
Half an hour before the closing bell. The downtrend that began yesterday from 3833 continued to fall during the session, reaching 3660.25 as the closing bell approached. The downtrend its middle segment, the 3rd wave, which is generally the most powerful of a five-wave trend. In Elliott wave terms, smaller to larger, wave 3{-14} within wave 5{-13} within wave 5{-12} is underway,

No change in the analysis. I’ve updated the chart.

1:05 p.m. New York time

Bearish entry on LVS. I’ve entered a bear call vertical spread on LVS, using options that trade for the last time on October 21 and have posted an analysis of the trade.

9:35 a.m. New York time

What’s happening now? The S&P 500 E-mini futures fell in overnight trading, reaching the mid-3710s.

What does it mean? The decline is a resumption of the downtrend that began on September 20. The downtrend is presently in its fifth and final segment.

What are the alternatives? None at present. Ambiguities will develop, I’m sure.

[S&P 500 E-mini futures at 3:30 p.m., 35-minute bars, with volume]

What does Elliott wave theory say? Downtrending wave 5{-13}, which began from yesterday’s peak, 3833, is underway. It is a subwave of wave 5{-12}, which began on September 20 from 3936.25. The starting point of wave 5{-13} was also the end point of an upward correction, wave 4{-13}.

When wave 5{-13} is complete, it will also mark the end of wave 5{-12}, its wave 5{-11} parent and above that, its wave 3{-10} grandparent, which began on September 13 from 4051.25. Wave 3{-10} will be followed by an upward correction, wave 4{-10}.

Fourth waves typically end in the 4th subwave of the preceding 3rd wave of the same degree. Wave 4{-11} within wave 3{-10} began on September 13 from 3938.30 and ended on September 15 at 3977.50. The correction hit a lower of 3929, giving a target range for the futures wave 4{-10} of 3929 to 3977.50. Fourth waves don’t always turn out that way, but they do often enough to take that tendency seriously.

If wave 4{-10} were to begin right now (it won’t), the minimum rise would be 5%.

Above the present wave 3{-10} are a series of nested downtrending waves, each of increasing size, from waves 1{-9} up to wave 4{-1}, which began on January 4 from 4818.62. Enclosing them all is wave 5{0}, an expanding Diagonal Triangle that began on December 26, 2018, from 2346.58. In this case, the Triangle constitutes the form of an uptrending wave, and when it is complete, it will be followed by a much larger downtrend than anything we’ve seen since for a long while.

We Are Here.

These are the waves currently in progress under my principal analysis. Each line on the list shows the wave number, with the subscript in curly brackets, the traditional degree name, the starting date, the starting price of the S&P 500 E-mini futures, and the direction of the wave.

  • S&P 500 Index:
  • 5{+3} Supercycle, 7/8/1932, 4.40 (up)
  • 5{+2} Cycle, 12/9/1974, 60.96 (up)
  • 5{+1} Primary, 3/6/2009, 666.79 (up)
  • 5{0} Intermediate, 12/26/2018, 2346.58 (up)
  • 4{-1} Minor, 1/4/2022 4818.62 (down)
  • 1{-2} Minute, 1/4/2022 4818.62 (down)
  • S&P 500 Futures and index:
  • 1{-3} Minuette, 1/4/2022, 4808.25 (down) (futures), 4818.62 (down) (index)
  • S&P 500 Futures:
  • 1{-4} Subminuette, 1/4/2022, 4808.25 (down)
  • 1{-5} Micro, 1/4/2022, 4808.25 (down)
  • 3{-6} Submicro, 8/16/2022, 4325.28 (down)
  • 1{-7} Minuscule, 8/16/2022, 4325.28 (down)
  • 5{-8} Subminuscule, 9/13/2022, 4175 (down)
  • 1{-9} (no name), 9/13/2022, 4175 (down)
  • 3{-10} (no name), 9/13/2022, 4051.25 (down)
  • 5{-11} (no name), 9/15/2022, 3977.50 (down)

Learning and other resources. Elliott wave analysis provides context, not prophecy. As the 20th century semanticist Alfred Korzybski put it in his book Science and Sanity (1933), “The map is not the territory … The only usefulness of a map depends on similarity of structure between the empirical world and the map.” And I would add, in the ever-changing markets, we can judge that similarity of structure only after the fact.

See the menu page Analytical Methods for a rundown on where to go for information on Elliott wave analysis.

By Tim Bovee, Portland, Oregon, September 23, 2022

Disclaimer

Tim Bovee, Private Trader tracks the analysis and trades of a private trader for his own accounts. Nothing in this blog constitutes a recommendation to buy or sell stocks, options or any other financial instrument. The only purpose of this blog is to provide education and entertainment.

No trader is ever 100 percent successful in his or her trades. Trading in the stock and option markets is risky and uncertain. Each trader must make trading decisions for his or her own account, and take responsibility for the consequences.

License
Creative Commons License

All content on Tim Bovee, Private Trader by Timothy K. Bovee is licensed under a Creative Commons Attribution-ShareAlike 4.0 International License.

Based on a work at www.timbovee.com.
Trader’s Notebook

3:30 p.m. New York time

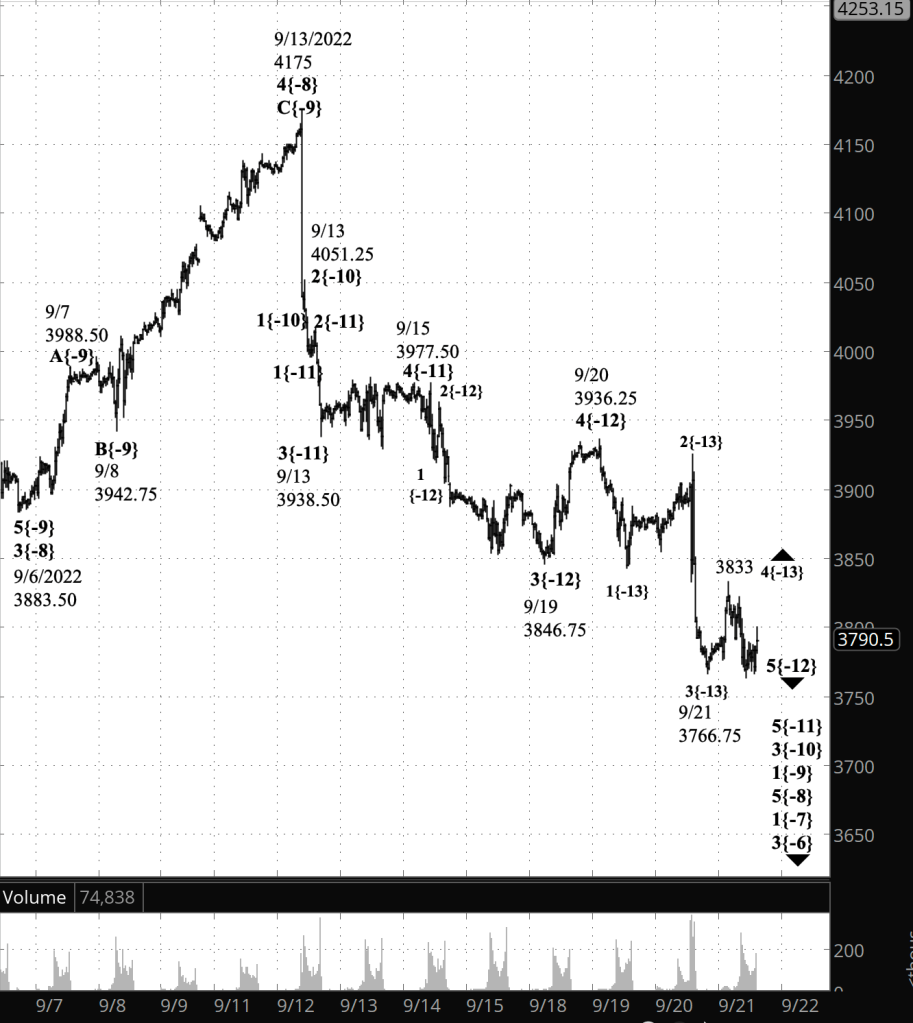
Half an hour before the closing bell. The S&P 500 has traced out two segments of the small upward correction that began yesterday. The end of the ascending third and likely final segment of the correction will be followed by a resumption of the downtrend that began on September 20.

Switching to the terminology of Elliott wave analysis: Wave 4{-13}, the upward correction, is in its third and likely final internal wave, C{-14}. When that wave is complete, wave 5{-13} will begin its downward course within the parent wave 5{-12}, which began on September 20, and which in turn is a subwave of wave 5{-11}, which began on September 15. There is no change in the principal analysis. I’ve updated the chart.

2:30 p.m. New York time

DRI earnings play exit. I’ve exited my short bull put options spread on DRI for 81.8% of maximum potential loss and have updated the trade analysis with details.

9:35 a.m. New York time

What’s happening now? The S&P 500 E-mini futures reached a low of 3766.75 after the closing bell, and then reversed, rising to 3833 overnight.

What does it mean? As the chart has played out in the past few days, it has become clear that the low level upward correction that began on September 19 ended on September 20, and that the downtrend that began on September 15 has resumed. The upward reversal overnight is the start of an upward correction within that downtrend.

What are the alternatives? The main ambiguity on the chart is one I referred to after the mid-August downtrend resumed: How large is each movement in connection with the fractal structure of movements ranging from big to small? Subsequent events could require a change in my present labeling of the degrees, using subscripts in curly brackets. For example, the decline from August 16 is wave 3{-6}, but it could just as easily be larger, wave 3{-5}, or even larger still, wave 3{-4}.

[S&P 500 E-mini futures at 3:30 p.m., 30-minute bars, with volume]

What does Elliott wave theory say? I revised my analysis after the close to align with the S&P 500’s path on the chart: Wave 5{-12} is underway and internally is in an upward correction, wave 4{-13}. I also moved the end of a prior upward correction, wave 4{-12}, to a point a few days earlier, September 20. And that peak is the starting point of wave 5{-12}.

Under the principal analysis, wave 4{-13} will be followed by downtrending wave 5{-13}, the final wave within the parent wave 5{-12}. The end of wave 5{-13} will also be the end of wave 5{-12}, and will cascade up two nested waves of increasing size, wave 5{-11}, which began on September 15, and wave 3{-10}, which began on September 13 from 4051.25. An upward correction, wave 4{-10}, will ensue, likely carrying the price back up into the mid- and high-3900s.

All of this is happening within a nested series of increasingly larger waves, all declining, ranging from wave 1{-9}, which began on September 13 from 4175, up to wave 4{-1}, which began on January 4 from 4818.62.

We Are Here.

These are the waves currently in progress under my principal analysis. Each line on the list shows the wave number, with the subscript in curly brackets, the traditional degree name, the starting date, the starting price of the S&P 500 E-mini futures, and the direction of the wave.

  • S&P 500 Index:
  • 5{+3} Supercycle, 7/8/1932, 4.40 (up)
  • 5{+2} Cycle, 12/9/1974, 60.96 (up)
  • 5{+1} Primary, 3/6/2009, 666.79 (up)
  • 5{0} Intermediate, 12/26/2018, 2346.58 (up)
  • 4{-1} Minor, 1/4/2022 4818.62 (down)
  • 1{-2} Minute, 1/4/2022 4818.62 (down)
  • S&P 500 Futures and index:
  • 1{-3} Minuette, 1/4/2022, 4808.25 (down) (futures), 4818.62 (down) (index)
  • S&P 500 Futures:
  • 1{-4} Subminuette, 1/4/2022, 4808.25 (down)
  • 1{-5} Micro, 1/4/2022, 4808.25 (down)
  • 3{-6} Submicro, 8/16/2022, 4325.28 (down)
  • 1{-7} Minuscule, 8/16/2022, 4325.28 (down)
  • 5{-8} Subminuscule, 9/13/2022, 4175 (down)
  • 1{-9} (no name), 9/13/2022, 4175 (down)
  • 3{-10} (no name), 9/13/2022, 4051.25 (down)
  • 5{-11} (no name), 9/15/2022, 3977.50 (down)

Learning and other resources. Elliott wave analysis provides context, not prophecy. As the 20th century semanticist Alfred Korzybski put it in his book Science and Sanity (1933), “The map is not the territory … The only usefulness of a map depends on similarity of structure between the empirical world and the map.” And I would add, in the ever-changing markets, we can judge that similarity of structure only after the fact.

See the menu page Analytical Methods for a rundown on where to go for information on Elliott wave analysis.

By Tim Bovee, Portland, Oregon, September 22, 2022

Disclaimer

Tim Bovee, Private Trader tracks the analysis and trades of a private trader for his own accounts. Nothing in this blog constitutes a recommendation to buy or sell stocks, options or any other financial instrument. The only purpose of this blog is to provide education and entertainment.

No trader is ever 100 percent successful in his or her trades. Trading in the stock and option markets is risky and uncertain. Each trader must make trading decisions for his or her own account, and take responsibility for the consequences.

License
Creative Commons License

All content on Tim Bovee, Private Trader by Timothy K. Bovee is licensed under a Creative Commons Attribution-ShareAlike 4.0 International License.

Based on a work at www.timbovee.com.

DRI Trade

Darden Restaurants Inc. (DRI)

Lot 2022-2

Update 9/22/2022: I exited my short bull put vertical spread on DRI, 29 days before expiration, for a $2.92 debit per contract/share, a loss before fees of $102 per contract. Shares were trading at $125.38, down $6.68 from the entry level.

The Implied Volatility Rank at exit was 32.8%, down 12.1 points from the entry level.

DRI’s earnings came in as expected, at $1.56 per share, but some same-store sales fell short and the share price fell, turning my bear position unprofitable. I exited on the day after entry for 81.8% of maximum potential loss.

Shares fell by 5.1% over one day for a -1,846% annual rate. The options position produced a 34.9% loss for a -12,750% annual rate.


I have entered a short bull put vertical spread on DRI, using options that trade for the last time 30 days hence, on October 21. The premium is a $1.90 credit per contract share and the stock at the time of entry was priced at $132.06.

The Implied Volatility Ratio stood at 44.9%.

Premium:$1.90Expire OTM
DRI-bull put spreadStrikeOddsDelta
Puts
Long125.0064.0%31
Break-even131.9058.0%36.5
Short130.0052.0%42

The premium is 76% of the width of the position’s short/long spread. The profit zone covers a 5% move to the downside and an unlimited move to the upside.

The risk/reward ratio is 1.6:1, with maximum risk of $190 and maximum reward of $360 per contract.

How I chose the trade. The trade was placed to coincide with DRI’s earnings announcement, before the opening bell on the day after entry. The Zacks Investment Research earnings surprise predictor gave DRI a score of 0.21%, with a rank of 3. The analysts’ consensus is that DRI will announce earnings of $1.56 per share.

By Tim Bovee, Portland, Oregon, September 21, 2022

Disclaimer

Tim Bovee, Private Trader tracks the analysis and trades of a private trader for his own accounts. Nothing in this blog constitutes a recommendation to buy or sell stocks, options or any other financial instrument. The only purpose of this blog is to provide education and entertainment.

No trader is ever 100 percent successful in his or her trades. Trading in the stock and option markets is risky and uncertain. Each trader must make trading decisions for his or her own account, and take responsibility for the consequences.

License
Creative Commons License

All content on Tim Bovee, Private Trader by Timothy K. Bovee is licensed under a Creative Commons Attribution-ShareAlike 4.0 International License.

Based on a work at www.timbovee.com.
Trader’s Notebook

3:30 p.m. New York time

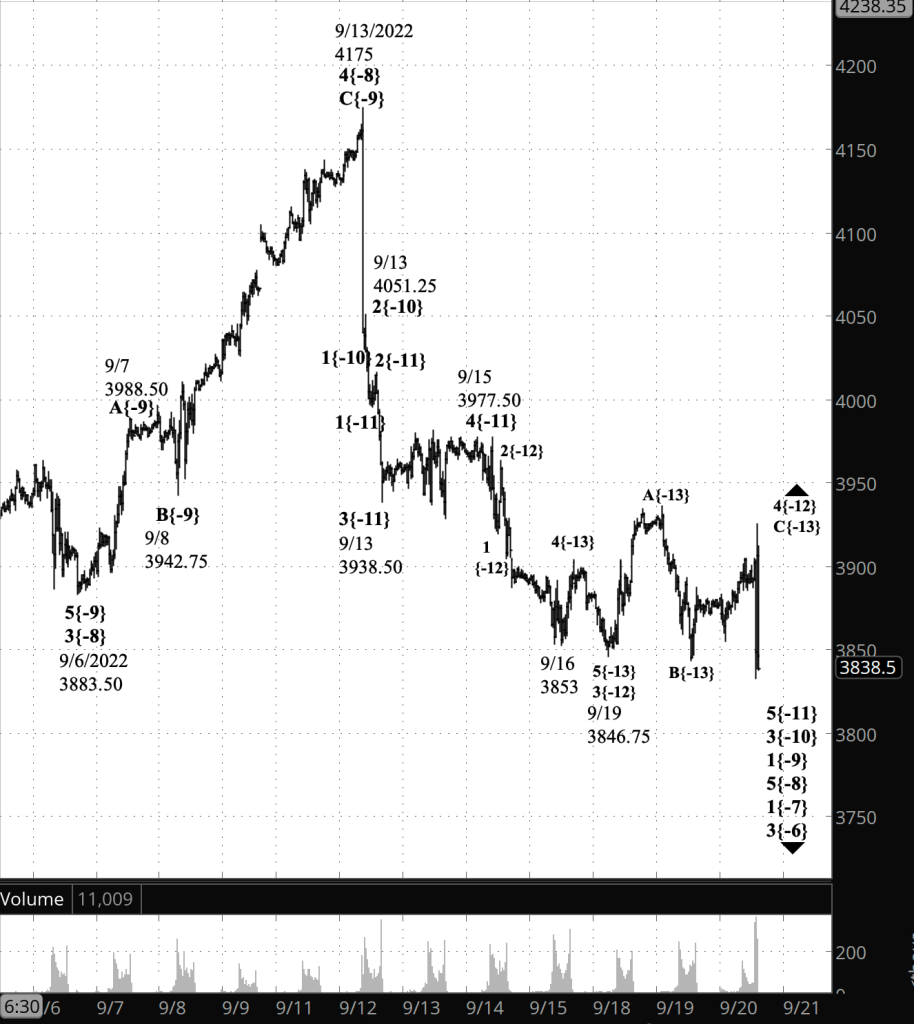
Half an hour before the closing bell. The S&P 500 whipsawed over nearly 100 points as the Federal Open Market Committee announced a 75-basis-point rise in the Fed funds rate. On the futures, the price fell from 3905 to 3832.75, and then rose again to 3925.25 before slipping back sharply.

Rather than selecting a principal analysis for such a move, I shall list the possibilities. Subsequent movements will clarify which is correct.

  1. Wave C{-13}, the final wave within an upward correction, wave 4{-12}, is underway. Wave 4{-12} is taking the form of a Flat. This was the principal analysis this morning and the one that I used to label the updated chart.
  2. Wave C{-13} is taking the form of a Triangle, which implies more whipsawing rather than a directional movement.
  3. Wave 4{-12} is taking a compounds form and the rapid decline was wave X{-13}, a connector wave that is being followed by a second corrective pattern.
  4. The whipsaw high this afternoon was the end of wave 4{-12} and downtrending wave 5{-12} has begun.

Here is very close-up chart showing the whipsaw. I’ve also updated the chart posted this morning.

[S&P 500 E-mini futures at 3:30 p.m., 1-minute bars]

2:20 p.m. New York time

DRI earnings play entry. I’ve entered a short bull put vertical spread on DRI, using options that trade for the last time on October 19, and have posted an analysis of the trade.

9:35 a.m. New York time

What’s happening now? The S&P 500 E-mini futures continued tor rise overnight, coming within a quarter point of 3900.

What does it mean? The third and final leg of an upward corrective pattern that began on September 19 is underway. When the correction is complete, it will be followed by a resumption of the downtrend that began on September 15.

What are the alternatives? None as regards the context of the rise set forth in the principal analysis. The alternatives have to do with determining when the upward correction is over. Corrections generally have three segments internally, and if that’s the case with the present correction, then the end or the present rise will also be the end of the correction and the resumption of the downtrend. Sometimes corrections take a compound form, stringing two or three corrective patterns together. If that’s the case here, then the end of the present rise will be followed by a decline that will connect the present corrective pattern with another one.

[S&P 500 E-mini futures at 3:30 p.m., 30-minute bars, with volume]

What does Elliott wave theory say? The present upward correction is wave 4{-12}, and internally, it is in wave C{-13}, the third wave of a corrective pattern called a Flat.

Under the principal analysis, the end of wave C{-13} will also be the end of its parent, wave 4{-12}, and the beginning of downtrending wave 5{-12}, a resumption of the downtrend, wave 5{-11}, that began on September 15 from 3977.50.

Under the alternative analysis, wave 4{-12} will form a compound correction, a not uncommon event within 4th waves. If that occurs, then wave C{-13} will be followed by a connector wave, X{-13}, and then by a wave A{-13}, the first wave within a second corrective pattern. That second pattern may take a different form than did the first, such as a Zigzag or a triangle of some sort. A compound correction can contain up to three corrective patterns, so might end with the second pattern, or have another connector wave and be followed by a third pattern. In any case, once wave 4{-12} is complete, it will be followed by wave 5{-12}, the final wave in a downtrend, wave 5{-11}.

This is all happening within a nested series of downtrends, each larger than the one before: Waves 3{-10}, 1{-9}, 5{-8}, all the way up to wave 1{-2}, the first wave within wave 4{-1}, which began on January 4 from 4808.25. Wave 4{-1} is the next-to-the-last leg of an expanding Diagonal Triangle, wave 5{0}, that began on December 26, 2018, from 2346.58. Wave 4{-1} will be followed by wave 5{-1}, the rising final wave of the triangle that will carry the price the January 4 high, perhaps significantly higher.

We Are Here.

These are the waves currently in progress under my principal analysis. Each line on the list shows the wave number, with the subscript in curly brackets, the traditional degree name, the starting date, the starting price of the S&P 500 E-mini futures, and the direction of the wave.

  • S&P 500 Index:
  • 5{+3} Supercycle, 7/8/1932, 4.40 (up)
  • 5{+2} Cycle, 12/9/1974, 60.96 (up)
  • 5{+1} Primary, 3/6/2009, 666.79 (up)
  • 5{0} Intermediate, 12/26/2018, 2346.58 (up)
  • 4{-1} Minor, 1/4/2022 4818.62 (down)
  • 1{-2} Minute, 1/4/2022 4818.62 (down)
  • S&P 500 Futures and index:
  • 1{-3} Minuette, 1/4/2022, 4808.25 (down) (futures), 4818.62 (down) (index)
  • S&P 500 Futures:
  • 1{-4} Subminuette, 1/4/2022, 4808.25 (down)
  • 1{-5} Micro, 1/4/2022, 4808.25 (down)
  • 3{-6} Submicro, 8/16/2022, 4325.28 (down)
  • 1{-7} Minuscule, 8/16/2022, 4325.28 (down)
  • 5{-8} Subminuscule, 9/13/2022, 4175 (down)
  • 1{-9} (no name), 9/13/2022, 4175 (down)
  • 3{-10} (no name), 9/13/2022, 4051.25 (down)
  • 5{-11} (no name), 9/15/2022, 3977.50 (down)

Learning and other resources. Elliott wave analysis provides context, not prophecy. As the 20th century semanticist Alfred Korzybski put it in his book Science and Sanity (1933), “The map is not the territory … The only usefulness of a map depends on similarity of structure between the empirical world and the map.” And I would add, in the ever-changing markets, we can judge that similarity of structure only after the fact.

See the menu page Analytical Methods for a rundown on where to go for information on Elliott wave analysis.

By Tim Bovee, Portland, Oregon, September 21, 2022

Disclaimer

Tim Bovee, Private Trader tracks the analysis and trades of a private trader for his own accounts. Nothing in this blog constitutes a recommendation to buy or sell stocks, options or any other financial instrument. The only purpose of this blog is to provide education and entertainment.

No trader is ever 100 percent successful in his or her trades. Trading in the stock and option markets is risky and uncertain. Each trader must make trading decisions for his or her own account, and take responsibility for the consequences.

License
Creative Commons License

All content on Tim Bovee, Private Trader by Timothy K. Bovee is licensed under a Creative Commons Attribution-ShareAlike 4.0 International License.

Based on a work at www.timbovee.com.
Trader’s Notebook

3:30 p.m. New York time

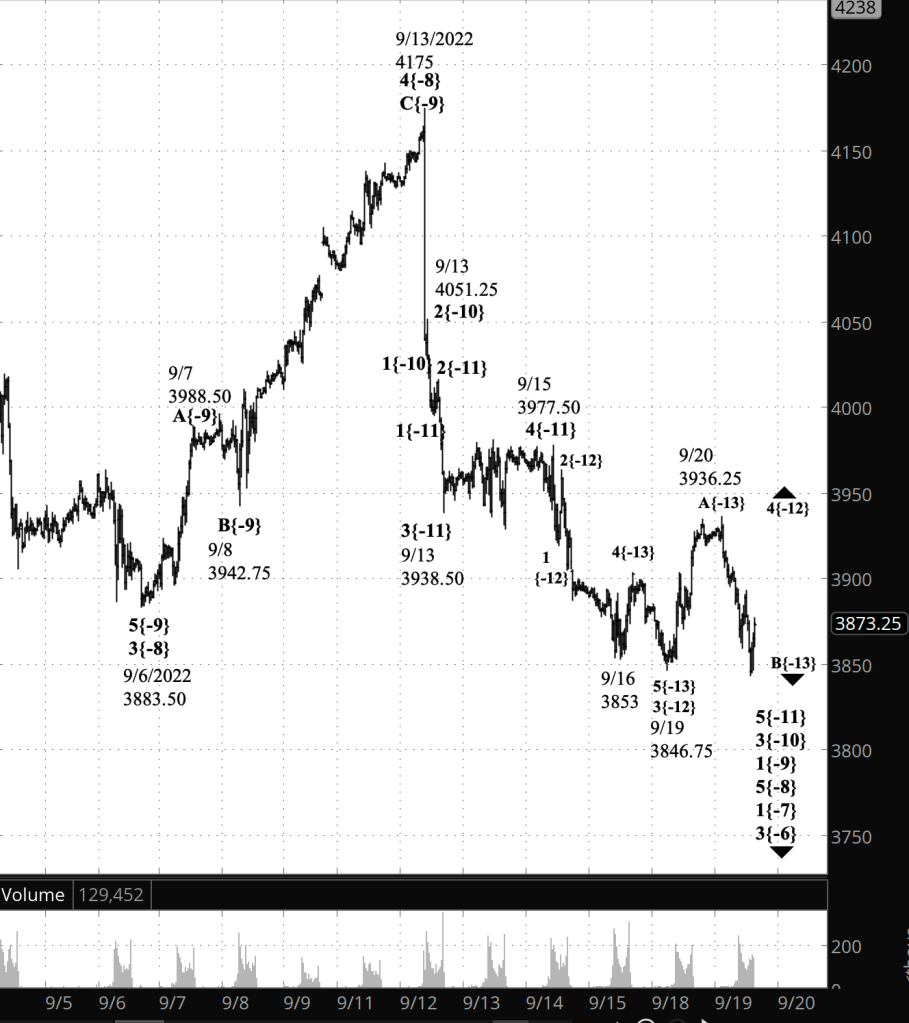
Half an hour before the closing bell. The S&P 500 fell during the session, so far reaching 3843.25 on the futures. The decline, wave B{-13}, brought the price below the beginning of the upward correction, wave 4{-12}. The first wave of the correction, wave A{-13}, has three waves internally, which means that the correction is taking the form of a Flat, the most common corrective form of 4th waves.

If my principal analysis from this morning still matches the reality on the chart, then wave B{-13} will reverse soon, as wave C{-13} carries the price higher, perhaps above this morning’s peak, 3936.25, which was the beginning of declining wave B{-13}. If instead the wave continues to move lower, then the chances increase that the alternative analysis is correct: Wave 5{-12}, a downtrend, is underway. The the price goes, the greater those chances grow.

I’ve updated the chart.

9:35 a.m. New York time

What’s happening now? The S&P 500 E-mini futures reversed sharply in overnight trading and began a decline that has traveled from the peak, 3936.25, down into the 3870s so far.

What does it mean? Under my principal analysis, the peak was the end of the initial wave within an upward correction that began on September 19 and the start of the middle internal wave. This is a change from yesterday’s analysis. I’ll discuss it in detail in the Elliott wave section below.

What is the alternative? The new alternative analysis is yesterday’s principal analysis. The upward correction ended at the overnight high, and the downtrend that began on September 15 is now underway.

[S&P 500 E-mini futures at 3:30 p.m., 30-minute bars, with volume]

What does Elliott wave theory say? Under the principal analysis, wave 4{-11} began from the September 19 low (the end of wave B{-12} under the principal analysis. The overnight high is the end of wave A{-12} within the correction, and wave B{-12} is underway. Wave B{-12} will be followed by rising wave C{-13}, the final wave of the corrective pattern, that may well exceed the overnight high, 3936.25.

Under the alternative analysis, the overnight peak is the end of wave C{-12} within the upward correction, wave 4{-11}. Wave 5{-11} has begun, a downtrending wave within a larger downtrend, wave 3{-10}, which began on September 13.

The internal structure of the waves in an extremely close-up view clarified the wave count. The rise that began on September 19 has five waves internally, as it should if the correction takes the form of a Zigzag. The rise that began on September 16 has three wave internally, which would be the case for a 4th wave, wave 4{-13}, within downtrending wave 3{-12}.

Also, the new principal analysis was wave 3{-11} ending at the low point of the decline. The alternative analysis has wave B{-13}, the middle wave of the correction, moving below the end of wave 3[-12}. This is allowed in a Flat corrective pattern, but under that scenario, the rise that followed, wave C{-13}, must have five waves internally, whether the form is a Zigzag or a Flat. It has three waves internally, and therefore must be an A wave for a Flat.

There are problems with the look of some of the waves; they appear too long or two short of their position in the structure. That has been the case with the entire decline, wave 5{-8}, that began on September 13 and is perhaps an effect of heightened uncertainty, heightened emotion, as traders and algorithms make their decisions. It reminds of the look of the early pandemic crash in 2020 — wave 2{-1} — in which every downtrending wave looked like a straight line and every upward correction like a slip of the pen.

We Are Here.

These are the waves currently in progress under my principal analysis. Each line on the list shows the wave number, with the subscript in curly brackets, the traditional degree name, the starting date, the starting price of the S&P 500 E-mini futures, and the direction of the wave.

  • S&P 500 Index:
  • 5{+3} Supercycle, 7/8/1932, 4.40 (up)
  • 5{+2} Cycle, 12/9/1974, 60.96 (up)
  • 5{+1} Primary, 3/6/2009, 666.79 (up)
  • 5{0} Intermediate, 12/26/2018, 2346.58 (up)
  • 4{-1} Minor, 1/4/2022 4818.62 (down)
  • 1{-2} Minute, 1/4/2022 4818.62 (down)
  • S&P 500 Futures and index:
  • 1{-3} Minuette, 1/4/2022, 4808.25 (down) (futures), 4818.62 (down) (index)
  • S&P 500 Futures:
  • 1{-4} Subminuette, 1/4/2022, 4808.25 (down)
  • 1{-5} Micro, 1/4/2022, 4808.25 (down)
  • 3{-6} Submicro, 8/16/2022, 4325.28 (down)
  • 1{-7} Minuscule, 8/16/2022, 4325.28 (down)
  • 5{-8} Subminuscule, 9/13/2022, 4175 (down)
  • 1{-9} (no name), 9/13/2022, 4175 (down)
  • 3{-10} (no name), 9/13/2022, 4051.25 (down)
  • 5{-11} (no name), 9/15/2022, 3977.50 (down)

Learning and other resources. Elliott wave analysis provides context, not prophecy. As the 20th century semanticist Alfred Korzybski put it in his book Science and Sanity (1933), “The map is not the territory … The only usefulness of a map depends on similarity of structure between the empirical world and the map.” And I would add, in the ever-changing markets, we can judge that similarity of structure only after the fact.

See the menu page Analytical Methods for a rundown on where to go for information on Elliott wave analysis.

By Tim Bovee, Portland, Oregon, September 20, 2022

Disclaimer

Tim Bovee, Private Trader tracks the analysis and trades of a private trader for his own accounts. Nothing in this blog constitutes a recommendation to buy or sell stocks, options or any other financial instrument. The only purpose of this blog is to provide education and entertainment.

No trader is ever 100 percent successful in his or her trades. Trading in the stock and option markets is risky and uncertain. Each trader must make trading decisions for his or her own account, and take responsibility for the consequences.

License
Creative Commons License

All content on Tim Bovee, Private Trader by Timothy K. Bovee is licensed under a Creative Commons Attribution-ShareAlike 4.0 International License.

Based on a work at www.timbovee.com.

Trader’s Notebook

3:31 p.m. New York time

Half an hour before the closing bell. The S&P 500 rose to 39-teens on the futures and then fell again. The movement means that the upward correction that began on September 16 from 3853 has further to go. In Elliott wave terminology, wave upward wave 4{-12} within wave downtrending wave 5{-11} is underway and is nearing its end. Any fresh high could be the end of the correction, or not. I’ve updated the chart.

9:35 a.m. New York time

What’s happening now? The S&P 500 E-mini futures resumed their fall after trading resumed overnight, reaching into the 3840s.

What does it mean? The downtrend that began on September 13 from 4051.25 continues and is in its middle leg. It will be followed by an upward correction that can be expected to take back a portion — perhaps a significant amount — of the decline. Or, the decline could be quite shallow, depending upon the form the correction takes. Corrective movements have a lot of variety.

What is the alternative? The main ambiguity is where the price stands within that middle leg of the downtrend. The principal analysis has it as two levels smaller. It could be three. More on this in the Elliott wave theory section below. There are similar ambiguities at larger levels.

The charts. The upper chart gives a close-up view of the S&P 500 futures from September 6 to the present. The lower chart gives a long-term view of the S&P 500 index from February 19, 2020 to the present.

[S&P 500 E-mini futures at 3:31 p.m., 25-minute bars, with volume]

What does Elliott wave theory say? The downtrend that began on September 13, wave 3{-10}, is now its its middle subwave, 3{-11}, under the principal analysis. Under an alternative analysis, that 3rd wave is a degree smaller, wave 3{-12}. Under both scenarios, the 3rd wave that began on September 13 is in its 5th wave internally, wave 5{-12} under the principal analysis and wave 5{-13} under the alternative.

The conundrum illustrates the difficulty in judging the precise degree of subwaves. The only guides are the size of the waves and how much time they take to reach their completion. On this chart, the decline was more powerful than is commonly seen on a routine trading day. Wave 5{-8} began on September 13 from 4175, ended its 3rd subwave three degrees down, wave 3{-11} within its subwave two degrees down, wave 3{-10}, within its first subwave, 1{-9}, all within one day.

That complicates the limited methods the chart offers us to set the degree. Long story short, it’s uncertain how far along the S&P 500 is in wave 5{-8}. It will become clear over time.

The patterns shown on the chart above are of unusual importance for such low degrees, given the vast uncertainties that presently afflict the markets. In good times a trader can track the larger degrees, relaxing throughout the week and checking positions on Mondays. In bad times it pays to keep a closer watch. These aren’t good times.

The big picture, on the other hand, provides a window into the S&P 500’s futures.

[S&P 500 index at 9:35 a.m., 2-day bars]

The lower chart shows the S&P 500 index from the start of the early pandemic crash in February 2020 and the long rise that followed, ending with the decline that began on January 4 of the present year.

As the chart shows, the S&P 500 is in a major 4th wave correction, wave 4{-1}, the next-to-the-last leg of an expanding Diagonal Triangle that is the from taken by its parent, uptrending wave, 5{0}, which began in December 2018 from 2346.58. The triangle’s price channel for the triangle appears on the chart as two red lines. The more time passes, the more space there is within that channel for a corrective wave to fall.

Like any downtrend, wave 4{-1} will have its up waves and down that can be traded profitably. For example, the present larger downtrend, wave 3{-6}, began on August 16. It is still underway — bear trade — and will be followed by a 4th wave upward correction, wave 4{-6} — bull trade.

Given the fractal nature of the markets — waves within waves of smaller and larger degree — even major downward corrections provide opportunities for the bullish trader.

And wave 4{-1} will be followed by wave 5{-1}, the final wave of the expanding Diagonal Triangle, which will carry the price back to the constantly rising upper boundary of the triangle’s price channel.

We Are Here.

These are the waves currently in progress under my principal analysis. Each line on the list shows the wave number, with the subscript in curly brackets, the traditional degree name, the starting date, the starting price of the S&P 500 E-mini futures, and the direction of the wave.

  • S&P 500 Index:
  • 5{+3} Supercycle, 7/8/1932, 4.40 (up)
  • 5{+2} Cycle, 12/9/1974, 60.96 (up)
  • 5{+1} Primary, 3/6/2009, 666.79 (up)
  • 5{0} Intermediate, 12/26/2018, 2346.58 (up)
  • 4{-1} Minor, 1/4/2022 4818.62 (down)
  • 1{-2} Minute, 1/4/2022 4818.62 (down)
  • S&P 500 Futures and index:
  • 1{-3} Minuette, 1/4/2022, 4808.25 (down) (futures), 4818.62 (down) (index)
  • S&P 500 Futures:
  • 1{-4} Subminuette, 1/4/2022, 4808.25 (down)
  • 1{-5} Micro, 1/4/2022, 4808.25 (down)
  • 3{-6} Submicro, 8/16/2022, 4325.28 (down)
  • 1{-7} Minuscule, 8/16/2022, 4325.28 (down)
  • 5{-8} Subminuscule, 9/13/2022, 4175 (down)
  • 1{-9} (no name), 9/13/2022, 4175 (down)
  • 3{-10} (no name), 9/13/2022, 4051.25 (down)
  • 5{-11} (no name), 9/15/2022, 3977.50 (down)

Learning and other resources. Elliott wave analysis provides context, not prophecy. As the 20th century semanticist Alfred Korzybski put it in his book Science and Sanity (1933), “The map is not the territory … The only usefulness of a map depends on similarity of structure between the empirical world and the map.” And I would add, in the ever-changing markets, we can judge that similarity of structure only after the fact.

See the menu page Analytical Methods for a rundown on where to go for information on Elliott wave analysis.

By Tim Bovee, Portland, Oregon, September 19, 2022

Disclaimer

Tim Bovee, Private Trader tracks the analysis and trades of a private trader for his own accounts. Nothing in this blog constitutes a recommendation to buy or sell stocks, options or any other financial instrument. The only purpose of this blog is to provide education and entertainment.

No trader is ever 100 percent successful in his or her trades. Trading in the stock and option markets is risky and uncertain. Each trader must make trading decisions for his or her own account, and take responsibility for the consequences.

License
Creative Commons License

All content on Tim Bovee, Private Trader by Timothy K. Bovee is licensed under a Creative Commons Attribution-ShareAlike 4.0 International License.

Based on a work at www.timbovee.com.
Trader’s Notebook

3:30 p.m. New York time

Half an hour before the closing bell. The S&P 500 has continued falling during the session, reaching a low so far today of 3853 on the futures. Wave 5{-11} is underway. It is the final wave within a downtrend that began on September 13, wave 3{-10}. No change in the analysis. I’ve updated the chart.

9:35 a.m. New York time

What’s happening now? The S&P 500 E-mini futures reached a high of 3977.50 on September 15 and overnight declined below the narrow range within which it had fluctuated since September 13.

What does it mean? The upward correction, which took the form of a Horizontal Triangle having five segments internally, ended at the September 15 high. The downtrend that began on September 13 then resumed.

What are the alternatives? None at this point, beyond determining the size of the early waves within the resumed downtrend. Ambiguities always develop, of course. Such is the way of Elliott wave analysis.

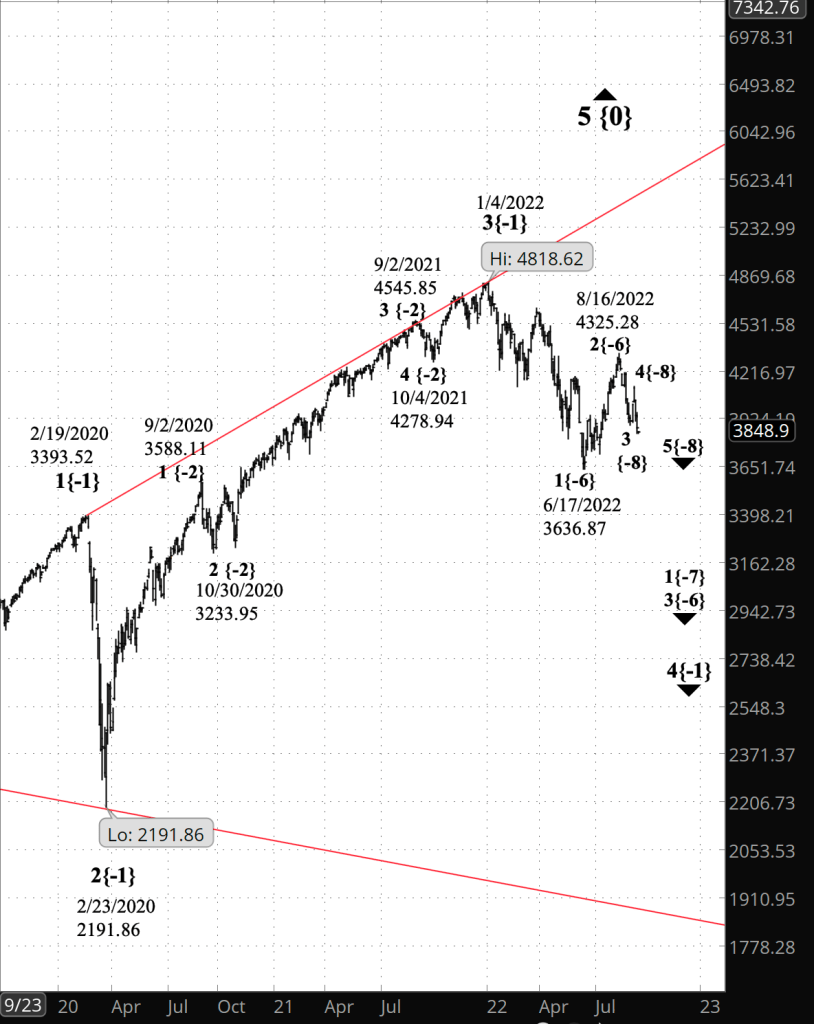
[S&P 500 E-mini futures at 3:30 p.m., 25-minute bars, with volume]

What does Elliott wave theory say? Wave 4{-11}, an upward correction, ended on September 15 at 3977.50, and from that point downtrending wave 5{-11} began. Fifth waves vary in their behavior. Sometimes they can extend into nine waves internally and move far beyond the end of the preceding 3rd wave (in this case, 3938.50 on September 13). Or they can be cut short — “truncated” is the term in Elliott wave theory — and fail to reach the end of the preceding 3rd wave. Or they can behave normally, tracing out five internal waves and then moving on.

In this case, wave 5{-11} is already below the end of wave 3{-11}, so there is no truncation. The degrees of the early portion of a trend can be an estimate at best; the time taken by a wave and the distance traveled are the guideposts. On this chart it looks to me like wave 5{-11} internally is in wave 1{-12}, which in turn is within wave 3{-13}.

Wave 5{-11} when complete will also be the end of its parent wave, 3{-10}, and will be followed by wave 4{-10}, a larger upward correction by one degree than the one just completed.

Wave 3{-10} is one of a series of nested ever larger downtrending waves, stretching up nine degrees to wave 4{-1}, which began January 4 from 4818.62. Wave 4{-1} is the next-to-the-last wave in an expanding Diagonal Triangle, wave 5{0}, that began on December 26, 2018.

We Are Here.

These are the waves currently in progress under my principal analysis. Each line on the list shows the wave number, with the subscript in curly brackets, the traditional degree name, the starting date, the starting price of the S&P 500 E-mini futures, and the direction of the wave. (The smallest waves — Bitsy, Subbitsy and Deci — aren’t named as part of the Elliott scheme.)

  • S&P 500 Index:
  • 5{+3} Supercycle, 7/8/1932, 4.40 (up)
  • 5{+2} Cycle, 12/9/1974, 60.96 (up)
  • 5{+1} Primary, 3/6/2009, 666.79 (up)
  • 5{0} Intermediate, 12/26/2018, 2346.58 (up)
  • 4{-1} Minor, 1/4/2022 4818.62 (down)
  • 1{-2} Minute, 1/4/2022 4818.62 (down)
  • S&P 500 Futures and index:
  • 1{-3} Minuette, 1/4/2022, 4808.25 (down) (futures), 4818.62 (down) (index)
  • S&P 500 Futures:
  • 1{-4} Subminuette, 1/4/2022, 4808.25 (down)
  • 1{-5} Micro, 1/4/2022, 4808.25 (down)
  • 3{-6} Submicro, 8/16/2022, 4325.28 (down)
  • 1{-7} Minuscule, 8/16/2022, 4325.28 (down)
  • 5{-8} Subminuscule, 9/13/2022, 4175 (down)
  • 1{-9} (no name), 9/13/2022, 4175 (down)
  • 3{-10} (no name), 9/13/2022, 4051.25 (down)
  • 5{-11} (no name), 9/15/2022, 3977.50 (down)

Learning and other resources. Elliott wave analysis provides context, not prophecy. As the 20th century semanticist Alfred Korzybski put it in his book Science and Sanity (1933), “The map is not the territory … The only usefulness of a map depends on similarity of structure between the empirical world and the map.” And I would add, in the ever-changing markets, we can judge that similarity of structure only after the fact.

See the menu page Analytical Methods for a rundown on where to go for information on Elliott wave analysis.

By Tim Bovee, Portland, Oregon, September 16, 2022

Disclaimer

Tim Bovee, Private Trader tracks the analysis and trades of a private trader for his own accounts. Nothing in this blog constitutes a recommendation to buy or sell stocks, options or any other financial instrument. The only purpose of this blog is to provide education and entertainment.

No trader is ever 100 percent successful in his or her trades. Trading in the stock and option markets is risky and uncertain. Each trader must make trading decisions for his or her own account, and take responsibility for the consequences.

License
Creative Commons License

All content on Tim Bovee, Private Trader by Timothy K. Bovee is licensed under a Creative Commons Attribution-ShareAlike 4.0 International License.

Based on a work at www.timbovee.com.

Trader’s Notebook

3:30 p.m. New York time

Half an hour before the closing bell. The S&P 500 has moved below the overnight low, to 3905 on the futures. The waves on the chart have a disproportionate feel as I’ve labeled them, which is the most likely analysis that I’m able to see. The internal patterns are unclear. It happens. Eventually, the chart regains its clarity.

So this afternoon’s analysis is this: Just as was the case overnight, wave 4{-11} reached a new low, and that low could mean that wave 4{-11} ended at its high point, 3977.50, attained during today’s session. If that high was indeed the end of wave 4{-11}, then wave 5{-11} is underway and will carry the price lower. If not, then we’re still in wave 4{-11}. I’ve updated the chart.

9:35 a.m. New York time

What’s happening now? The S&P 500 E-mini futures continued to trade in a narrow range overnight, remaining within the high and low of the day before, 3981.25 and 3929.

What does it mean? An upward correction that began on September 13 continues. When it is complete, the downtrend that began on that same day will resume. At this point we’re fishing for an end to the correction. Any new low can mean that the prior high in the correction marked its end and that the downtrend has resumed. The September 13 start of the downtrend came within a larger uptrend that began the same day and that followed a larger upward correction that began on September 6.

Whether it’s the principal analysis or an alternative, this is all happening within a major downtrend that began on January 4.

What is the alternative? It’s possible that the larger upward correction is still underway. Under this scenario, the September 13 high is the end of the first leg of the correction, the subsequent decline — still underway — is the correction’s middle leg, and a future rise that will approach or exceed the September 13 high will be the end of the correction.

[S&P 500 E-mini futures at 3:30 p.m., 20-minute bars, with volume]

What does Elliott wave theory say? Under the principal analysis, wave 4{-11}, an upward correction within downtrending wave 3{-10}, is underway. It will be followed by downtrendng wave 5{-11}, which will complete wave 3{-10} and will be followed by a larger uptrending correction, wave 4{-10}, and then a larger downtrending wave, 5{-10}, which will complete its parent wave, wave 1{-9}, whose starting point on September 13 was the beginning of the swift one-day decline that followed publication of the government’s most recent inflation figures.

This is all happening within wave 5{-8}, which is a downward reversal that began on September 13.

The present tangle of waves illustrates the fractal nature of any stock chart. Each wave has subwaves and in turn is itself a subwave of a larger wave. And whatever the level, whatever the degree, those waves all follow the same patterns.

Under the alternative analysis, wave 4{-8}, an upward correction that began on September 6, is still underway and is in wave B{-9}, its descending middle wave that began on September 13. It will be followed by rising wave C{-9}, which will probably be the end of the correction and which may exceed the September 13 high.

All of that is occurring within a series of downtrending waves, ranging in size from the smaller, wave 1{-7}, which began on August 16 from 4325.25, to wave 1{-2}, five degrees larger, which began on January 4 from 4818.62.

So if someone asks, “How’s the market doing?”, the short answer is, “Falling”. And I might add, “As it has all year.”

We Are Here.

These are the waves currently in progress under my principal analysis. Each line on the list shows the wave number, with the subscript in curly brackets, the traditional degree name, the starting date, the starting price of the S&P 500 E-mini futures, and the direction of the wave.

  • S&P 500 Index:
  • 5{+3} Supercycle, 7/8/1932, 4.40 (up)
  • 5{+2} Cycle, 12/9/1974, 60.96 (up)
  • 5{+1} Primary, 3/6/2009, 666.79 (up)
  • 5{0} Intermediate, 12/26/2018, 2346.58 (up)
  • 4{-1} Minor, 1/4/2022 4818.62 (down)
  • 1{-2} Minute, 1/4/2022 4818.62 (down)
  • S&P 500 Futures and index:
  • 1{-3} Minuette, 1/4/2022, 4808.25 (down) (futures), 4818.62 (down) (index)
  • S&P 500 Futures:
  • 1{-4} Subminuette, 1/4/2022, 4808.25 (down)
  • 1{-5} Micro, 1/4/2022, 4808.25 (down)
  • 3{-6} Submicro, 8/16/2022, 4325.25 (down)
  • 1{-7} Minuscule, 8/16/2022, 4325.25 (down)
  • 5{-8} Subminuscule, 9/13/2022, 4175 (down)

Learning and other resources. Elliott wave analysis provides context, not prophecy. As the 20th century semanticist Alfred Korzybski put it in his book Science and Sanity (1933), “The map is not the territory … The only usefulness of a map depends on similarity of structure between the empirical world and the map.” And I would add, in the ever-changing markets, we can judge that similarity of structure only after the fact.

See the menu page Analytical Methods for a rundown on where to go for information on Elliott wave analysis.

By Tim Bovee, Portland, Oregon, September 15, 2022

Disclaimer

Tim Bovee, Private Trader tracks the analysis and trades of a private trader for his own accounts. Nothing in this blog constitutes a recommendation to buy or sell stocks, options or any other financial instrument. The only purpose of this blog is to provide education and entertainment.

No trader is ever 100 percent successful in his or her trades. Trading in the stock and option markets is risky and uncertain. Each trader must make trading decisions for his or her own account, and take responsibility for the consequences.

License
Creative Commons License

All content on Tim Bovee, Private Trader by Timothy K. Bovee is licensed under a Creative Commons Attribution-ShareAlike 4.0 International License.

Based on a work at www.timbovee.com.
Trader’s Notebook

3:30 p.m. New York time

Half an hour before the closing bell. The S&P 500 has traded in a narrow range during the session, swinging between the 3970s and the 3920s on the futures. Any new low could mean that the upward correction, wave 4{-11}, has ended, and downtrending wave 5{-11} is underway. Meanwhile, no change in the analysis. I’ve updated the upper, close-up chart.

9:35 a.m. New York time

What’s happening now? The S&P 500 E-mini futures reached into the 3930s yesterday and then switched to a shallow rise that so far has returned the price to the 3970s.

What does it mean? The downtrend that began on September 13 continues. It is now in its middle segment, which internally is in an upward correction that will be followed by a further decline. That larger middle segment, in turn, will be followed by a larger upward correction, and then an even deeper decline.

The further the price declines, the more likely this scenario becomes. The key price level is the September 6 low, 3883.50, the starting point of the upward correction. A drop below that level gives this principal analysis greater credibility.

What is the alternative? It’s possible that the decline that began on September 13 is the middle leg of an ongoing upward correction that began on September 6. If that proves to be the case, then there will be a return to a rising price soon that will likely exceed the September 13 high, 4175. A reversal above the September 6 low, 3883.50, gives this alternative analysis greater credibility.

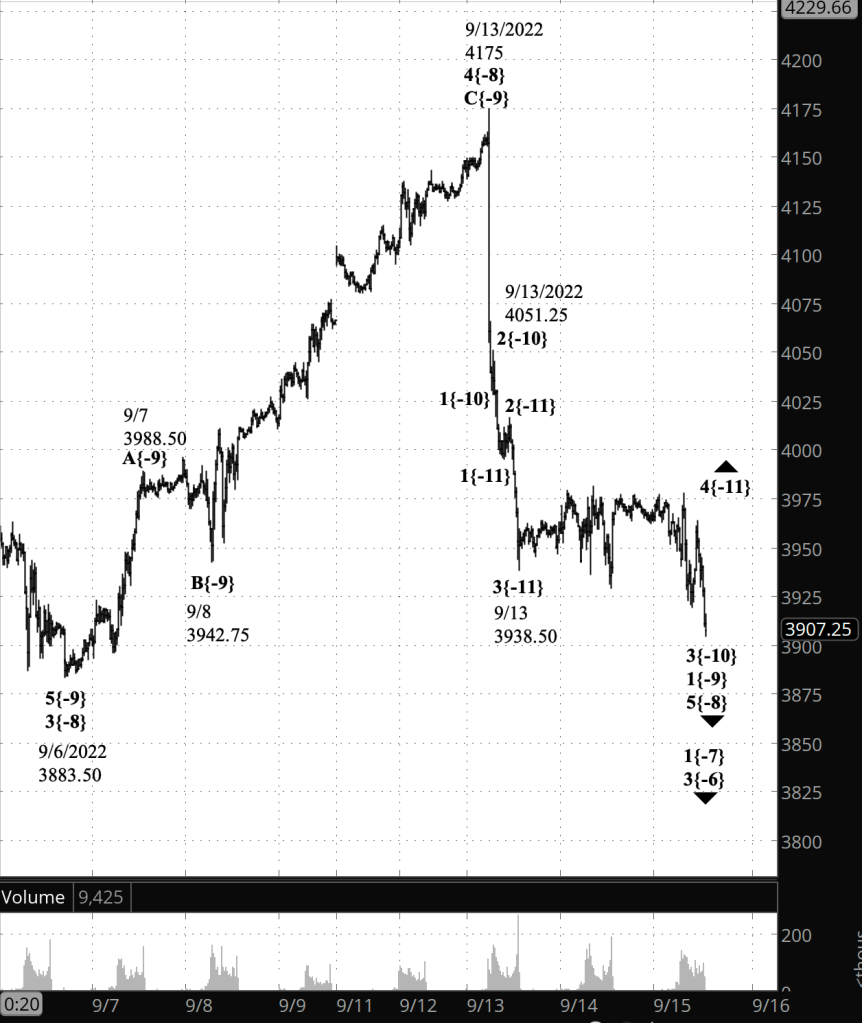
The charts. The upper chart, showing the S&P 500 E-mini futures, focuses is on the decline that began on September 13 and the upward correction that preceded it, showing the internal count. The lower chart, showing the S&P 500 index, puts the price rise from October 30, 2020, the end of the early pandemic crash, into a larger context.

[S&P 500 E-mini futures at 3:30 p.m., 15-minute bars, with volume]
[S&P 500 index, daily bars]

What does Elliott wave theory say? Under the principal analysis, the September 13 peak, 4175, was the end of wave 4{-8}, an upward correction, and the beginning of wave 5{-8}, a downtrend, the final wave within wave 1{-7}, which began on August 16. Wave 4{-8} began on September 6 from 3883.50, and that’s a key level in judging the nature of the decline since September 13. The further the price falls bellow 3883.50, the more likely the principal scenario becomes. Under this scenario, wave 5{-8} internally is in wave 1{-9}, which in turn is in wave 3{-10}, and which in turn is within wave 4{-11}, its next-to-the-last wave.

Under the alternative analysis, the September 13 peak was the end of wave A{-9}, the first subwave within wave 4{-8}, and the subsequent decline, now underway, is wave B{-9}. A reversal above 3883.50 and a clear rise toward the September 13 peak makes this alternative scenario more likely. Internally, wave B{-9} appears to be in its middle wave, B{-10}.

This is all happening within two waves that began on August 16, the child wave 1{-7} and the parent wave 3{-6}. They in turn are within wave 1{-4}, which began on January 4 — the end of the rise wave wave 3{-1}, which followed the early pandemic crash of 2020. The crash, the subsequent rise, and the present decline since January 4 are part of wave 5{0}, an expanding Diagonal Triangle that began on December 26, 2018 and that is the final wave with wave 5{+1}, which began on March 6, 2009 at the amazingly low price of 666.79 on the S&P 500 index. The top channel line of the wave 5{0} can be seen in red on the lower chart.

These charts ultimately have a lot of downside ahead. But the enclosing wave 5{0}, the Diagonal Triangle, is an uptrending wave, as is its parent and grandparent waves, from wave 5{+1}, which began in 2009, to wave 5{+3}, which began in 1932, during the Great Depression.

What’s the end game? The end of the Diagonal Triangle, wave 5{0}, will also be the end of the larger waves, up to 5{+3}. Afterward comes a correction that takes back a large portion of the entire rise since 1932.

So, bottom line: A rough few years ahead, followed by an impressive recovery and then some distance down the road, a decline of a magnitude that has not been seen for a almost century.

We Are Here.

These are the waves currently in progress under my principal analysis. Each line on the list shows the wave number, with the subscript in curly brackets, the traditional degree name, the starting date, the starting price of the S&P 500 E-mini futures, and the direction of the wave.

  • S&P 500 Index:
  • 5{+3} Supercycle, 7/8/1932, 4.40 (up)
  • 5{+2} Cycle, 12/9/1974, 60.96 (up)
  • 5{+1} Primary, 3/6/2009, 666.79 (up)
  • 5{0} Intermediate, 12/26/2018, 2346.58 (up)
  • 4{-1} Minor, 1/4/2022 4818.62 (down)
  • 1{-2} Minute, 1/4/2022 4818.62 (down)
  • S&P 500 Futures and index:
  • 1{-3} Minuette, 1/4/2022, 4808.25 (down) (futures), 4818.62 (down) (index)
  • S&P 500 Futures:
  • 1{-4} Subminuette, 1/4/2022, 4808.25 (down)
  • 1{-5} Micro, 1/4/2022, 4808.25 (down)
  • 3{-6} Submicro, 8/16/2022, 4325.28 (down)
  • 1{-7} Minuscule, 8/16/2022, 4325.28 (down)
  • 5{-8} Subminuscule, 9/13/2022, 4175 (down)

Learning and other resources. Elliott wave analysis provides context, not prophecy. As the 20th century semanticist Alfred Korzybski put it in his book Science and Sanity (1933), “The map is not the territory … The only usefulness of a map depends on similarity of structure between the empirical world and the map.” And I would add, in the ever-changing markets, we can judge that similarity of structure only after the fact.

See the menu page Analytical Methods for a rundown on where to go for information on Elliott wave analysis.

By Tim Bovee, Portland, Oregon, September 14, 2022

Disclaimer

Tim Bovee, Private Trader tracks the analysis and trades of a private trader for his own accounts. Nothing in this blog constitutes a recommendation to buy or sell stocks, options or any other financial instrument. The only purpose of this blog is to provide education and entertainment.

No trader is ever 100 percent successful in his or her trades. Trading in the stock and option markets is risky and uncertain. Each trader must make trading decisions for his or her own account, and take responsibility for the consequences.

License
Creative Commons License

All content on Tim Bovee, Private Trader by Timothy K. Bovee is licensed under a Creative Commons Attribution-ShareAlike 4.0 International License.

Based on a work at www.timbovee.com.
Trader’s Notebook

3:30 p.m. New York time

Half an hour before the closing bell. The S&P 500 continued to decline, reaching into the 3950s on the futures as the end of the session approached.

The analysis from this morning stands, as modified by the correction in the degree labeling that I made at midday. Internally, wave 1{-9} within with 5{-8} has had a single, small reversal to the upside. Which could mean the end of wave 1 and beginning of the 2nd wave of the five-wave structure. But the smallness of the reversal seems disproportionate to me, and I’m reluctant to adopt that count.

I do see an interesting prospect ahead. A firm rule of Elliott wave analysis is that the 3rd wave of a trend can’t be shorter than both waves 1 and 5. This is a fairly long 1st wave already, and usually the 1st wave is the shortest of them all. So that means that we can look forward to a really long 3rd wave — to the downside — or a 5th wave that’s unusually short, in order to be shorter than the 3rd wave. Wave 1{-9} so far is more than 200 points in length.

I’ve updated the chart.

12:40 p.m. New York time

Chart labeling correction. I’ve updated the chart to correct the labeling of the subwaves of wave 4{-8}, changing the degree from {-10} to {-9}. The futures have continued to fall during the session, so far reaching a low of 3995.75.

9:35 a.m. New York time

What’s happening now? The S&P 500 E-mini futures dropped overnight by 100 points in a single minute after inflation rose by 0.1% in August, to 8.3%. The price then continued to fall, at a slightly slower pace, with the entire decline covering from 4175 down to 4030.5.

What does it mean? The overnight high marked the end of an upward correction that began on September 6 and the start of a resumption of the downtrend that began on August 16. The decline is part of the final segment of that downtrend.

What is the alternative? The overnight high can also be counted as the end of the 1st wave of an ongoing upward correction, with the peak being the end of the initial segment within the correction, and the subsequent decline the beginning of the middle segment.

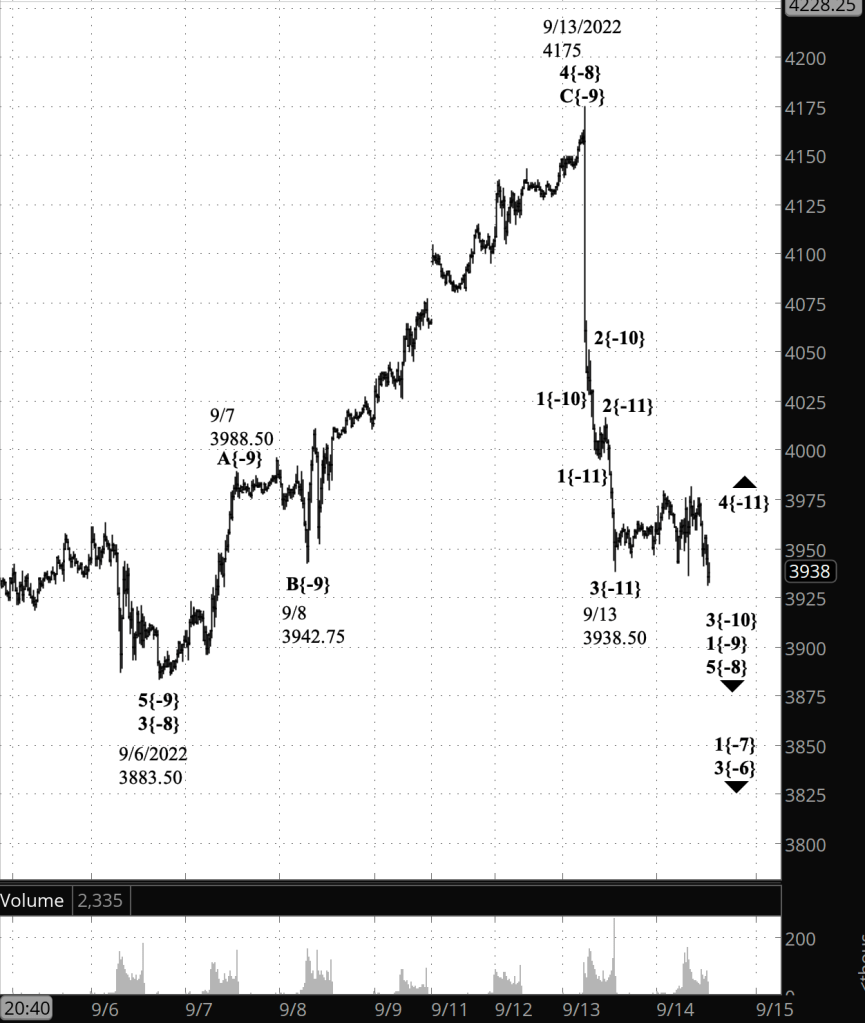
[S&P 500 E-mini futures at 3:30 p.m., 55-minute bars, with volume]

What does Elliott wave theory say? The overnight peak is the end of wave 4{-8}, an upward correction that began on September 6, and the beginning of wave 5{-8}, the final wave within wave 1{-7}, a downtrend that began on August 16 from 4327.50.

Under the alternative analysis, the overnight peak is the end of wave A{-9}, the first wave within the upward correction, wave 4{-8}. The subsequent decline is downward wave B{-9}, the middle wave of the correction, and it will be followed by upward wave C{-9}, the final wave within wave 4{-8}, which may carry the price above the overnight high.

I chose the wave 5{-8} scenario because of the power of the decline. Trending waves — especially the 3rd but also the 5th — tend to be powerful. Corrective waves tend to be more tentative. But there are powerful B waves, and so those tendencies don’t make the alternative analysis implausible.

When wave 1{-7} is complete, it will be followed by wave 2{-7}, another upward correction a degree larger than the one that was just completed.

This is all happening within downtrending wave 3{-6}, which also began on August 16.

We Are Here.

These are the waves currently in progress under my principal analysis. Each line on the list shows the wave number, with the subscript in curly brackets, the traditional degree name, the starting date, the starting price of the S&P 500 E-mini futures, and the direction of the wave.

  • S&P 500 Index:
  • 5{+3} Supercycle, 7/8/1932, 4.40 (up)
  • 5{+2} Cycle, 12/9/1974, 60.96 (up)
  • 5{+1} Primary, 3/6/2009, 666.79 (up)
  • 5{0} Intermediate, 12/26/2018, 2346.58 (up)
  • 4{-1} Minor, 1/4/2022 4818.62 (down)
  • 1{-2} Minute, 1/4/2022 4818.62 (down)
  • S&P 500 Futures and index:
  • 1{-3} Minuette, 1/4/2022, 4808.25 (down) (futures), 4818.62 (down) (index)
  • S&P 500 Futures:
  • 1{-4} Subminuette, 1/4/2022, 4808.25 (down)
  • 1{-5} Micro, 1/4/2022, 4808.25 (down)
  • 3{-6} Submicro, 8/16/2022, 4325.28 (down)
  • 1{-7} Minuscule, 8/16/2022, 4325.28 (down)
  • 5{-8} Subminuscule, 9/13/2022, 4175 (down)

Learning and other resources. Elliott wave analysis provides context, not prophecy. As the 20th century semanticist Alfred Korzybski put it in his book Science and Sanity (1933), “The map is not the territory … The only usefulness of a map depends on similarity of structure between the empirical world and the map.” And I would add, in the ever-changing markets, we can judge that similarity of structure only after the fact.

See the menu page Analytical Methods for a rundown on where to go for information on Elliott wave analysis.

By Tim Bovee, Portland, Oregon, September 13, 2022

Disclaimer

Tim Bovee, Private Trader tracks the analysis and trades of a private trader for his own accounts. Nothing in this blog constitutes a recommendation to buy or sell stocks, options or any other financial instrument. The only purpose of this blog is to provide education and entertainment.

No trader is ever 100 percent successful in his or her trades. Trading in the stock and option markets is risky and uncertain. Each trader must make trading decisions for his or her own account, and take responsibility for the consequences.

License
Creative Commons License

All content on Tim Bovee, Private Trader by Timothy K. Bovee is licensed under a Creative Commons Attribution-ShareAlike 4.0 International License.

Based on a work at www.timbovee.com.