Update 5/20/2022: I exited my short bull put vertical spread on FL, 28 days before expiration, for a $0.27 debit per contract/share, a profit before fees of $38 per contract. Shares were trading at $33.07, up $2.64 from the entry level.
The Implied Volatility Rank at exit was 90.8%, down 13.2 points from the entry level.
I exited on the day after entry at 58.5% of maximum potential profit, well above my normal exit point for earnings plays, 25% of max.
Shares rose by 8.7% over one day for a +3,167% annual rate. The options position produced a 140.7% return for a +51,370% annual rate.
I have entered a short bull put vertical spread on FL, using options that trade for the last time 29 days hence, on June 17. The premium is a $0.65 credit per contract share and the stock at the time of entry was priced at $30.43.
The Implied Volatility Ratio stood at 104.0%.
Premium:
$0.65
Expire OTM
FL-bull put spread
Strike
Odds
Delta
Puts
Long
25.00
71.0%
20
Break-even
28.15
65.0%
25.5
Short
27.50
59.0%
31
The premium is 52% of the width of the position’s short/long spread. The profit zone covers a 7.5% move to the downside and an unlimited move to the upside.
The risk/reward ratio is 2.8:1, with maximum risk of $185 and maximum reward of $65 per contract.
How I chose the trade. The trade was placed to coincide with FL’s earnings announcement, before the closing bell on the day after entry. The short strikes were set to coincide with the expected move of $4.59 either way, based on options pricing, which gives a price range of $25.92 to $34.94.
By Tim Bovee, Portland, Oregon, May 19, 2022
Disclaimer
Tim Bovee, Private Trader tracks the analysis and trades of a private trader for his own accounts. Nothing in this blog constitutes a recommendation to buy or sell stocks, options or any other financial instrument. The only purpose of this blog is to provide education and entertainment.
No trader is ever 100 percent successful in his or her trades. Trading in the stock and option markets is risky and uncertain. Each trader must make trading decisions for his or her own account, and take responsibility for the consequences.
Half an hour before the closing bell. The S&P 500 traded in a narrow range during the session, remaining fewer than 90 points above the overnight low on the futures. No change in the analysis. I’ve updated the chart.
2:05 p.m. New York time
FL earnings play entry. I’ve entered an earnings play on FL, using options that expire in 29 days, and have posted an analysis of the trade.
9:35 a.m. New York time
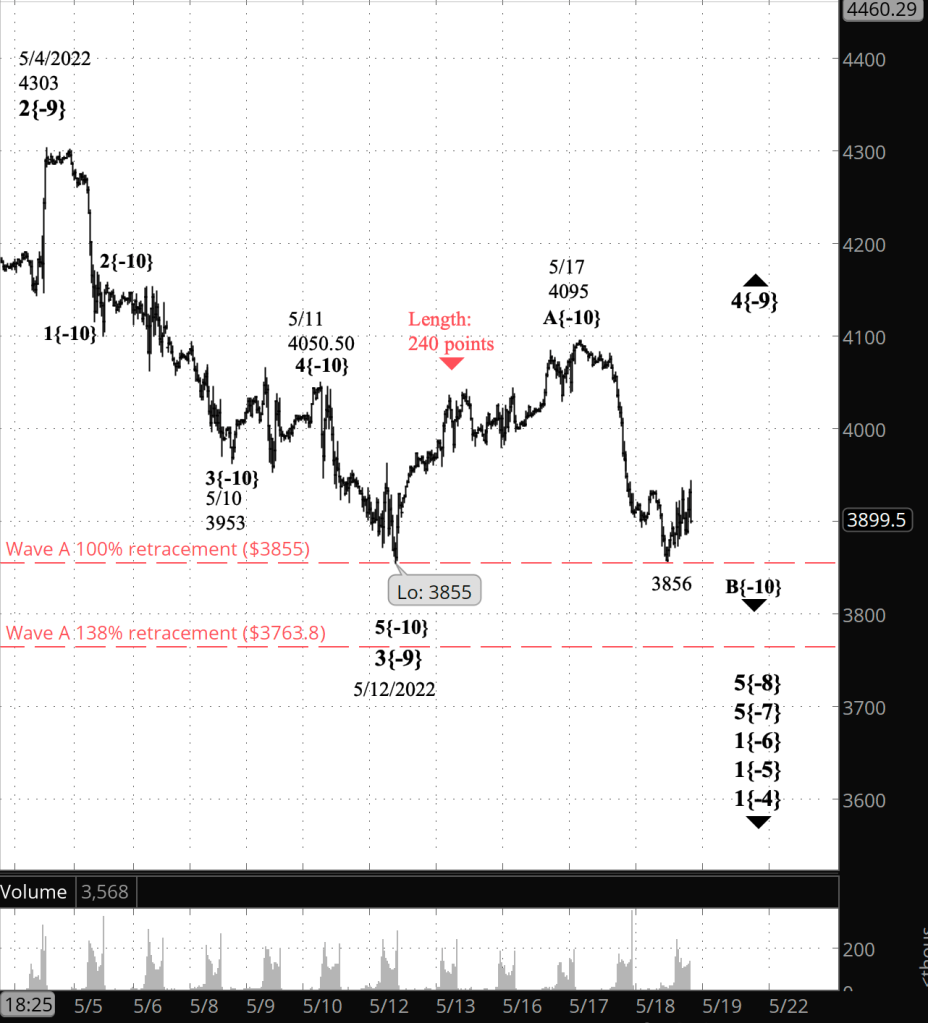
What’s happening now? The S&P 500 E-mini futures fell overnight to 3856, a point above the starting point of the upward correction that began on May 12, and then rose slightly.
What does it mean? The upward correction is in its second leg, and how much further the price can fall will depend upon what form the correction is taking. Under my principal analysis, the correction is a Flat and could reach as low as the 3760s.
What’s the alternative? Under my first alternative analysis, the correction taking the form of a Zigzag, which never moves below the start of the first leg of a correction. The downside potential is one point, to 3855.
Under a second alternative analysis, the entire upward correction ended on May 17 and there is no specified limit to the downside.
[S&P 500 E-mini futures at 3:30 p.m., 35-minute bars, with volume]
What does Elliott wave theory say? Wave 4{-9}, an upward correction, began May 12 from 3855. On that all three possible analyses agree.
Under my principal analysis, the first wave within the correction, wave A{-10}, has three waves internally, meaning that the correction is taking the form of a Flat, with three subwaves within the A wave. This is the more common form of a 4th wave correction. The B wave of a Flat often will retrace 100% to 138% of the preceding A wave (the dotted red lines on the chart), bringing the price potentially as low as 3763.80. This is the scenario shown in the chart.
Under my first alternative analysis, wave A{-10} has five waves internally meaning that the correction is taking the form of a Zigzag. The A-wave count is a bit messy, and I can see it as five waves or three, depending upon how I define the degree of each movement within the wave. The B wave of a Zigzag never moves below the start of the preceding A wave. The B wave’s overnight low, 3856, is one point above the start of wave A (the top dotted red line on the chart).
Under my second alternative analysis, the rise from May 12 to May 17 is the entirety of wave 4{-9}, with three waves within it. Under this scenario, the decline now underway is wave 5{-9}, and there is no limit to how low it can go, beyond the need for waves of the same degree to be more or less proportionally similar to each other.
What the chart shows as wave B{-10} is consistent with both the principal and first alternative analyses, and with the second analysis, if the wave is renumbered to wave 5{-9}. A dip below 3855 would eliminate the first alternative — the Zigzag scenario. A move below 3763.80 would most likely eliminate the principal analysis — the Flat scenario. If both are eliminated, then the 5th wave scenario remains.
We Are Here.
These are the waves currently in progress under my principal analysis. Each line on the list shows the wave number, with the subscript in curly brackets, the traditional degree name, the starting date, the starting price of the S&P 500 E-mini futures, and the direction of the wave.
Learning and other resources. Elliott wave analysis provides context, not prophecy. As the 20th century semanticist Alfred Korzybski put it in his book Science and Sanity (1933), “The map is not the territory … The only usefulness of a map depends on similarity of structure between the empirical world and the map.” And I would add, in the ever-changing markets, we can judge that similarity of structure only after the fact.
See the menu page Analytical Methods for a rundown on where to go for information on Elliott wave analysis.
By Tim Bovee, Portland, Oregon, May 19, 2022
Disclaimer
Tim Bovee, Private Trader tracks the analysis and trades of a private trader for his own accounts. Nothing in this blog constitutes a recommendation to buy or sell stocks, options or any other financial instrument. The only purpose of this blog is to provide education and entertainment.
No trader is ever 100 percent successful in his or her trades. Trading in the stock and option markets is risky and uncertain. Each trader must make trading decisions for his or her own account, and take responsibility for the consequences.
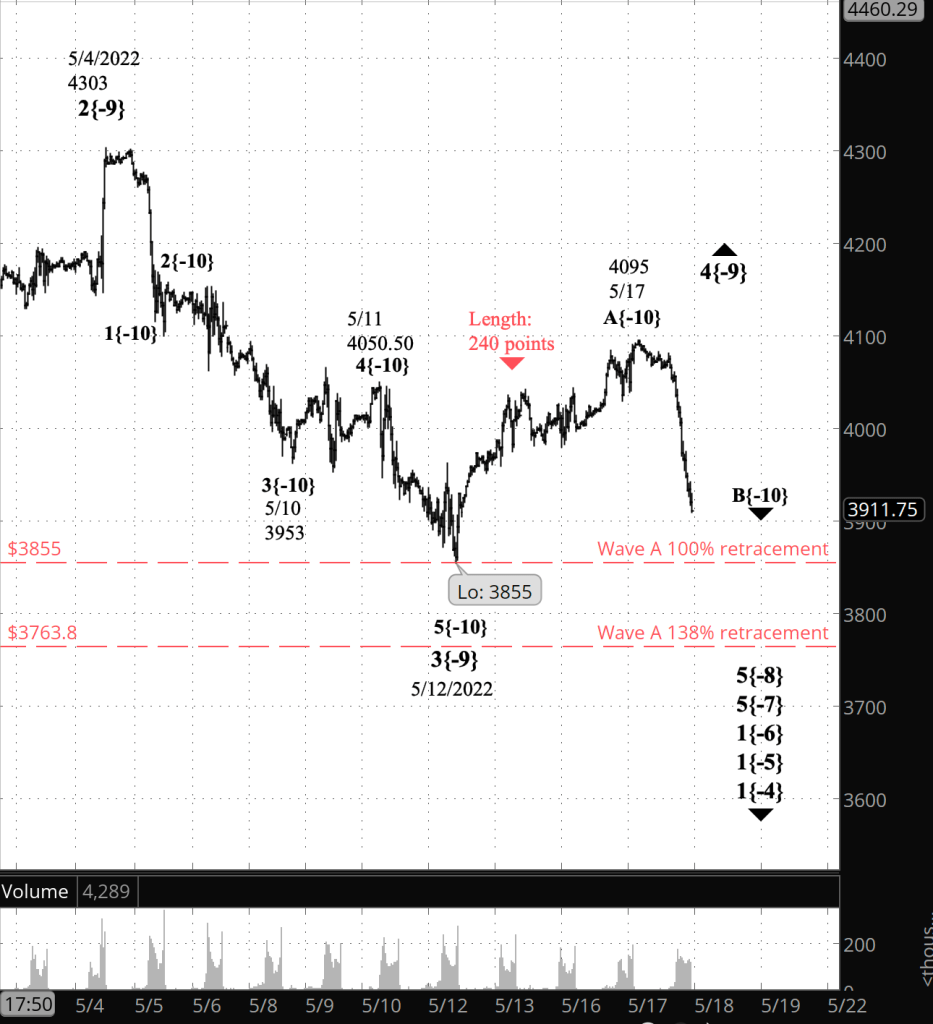
Half an hour before the closing bell. The S&P 500 fell during the day in the downward middle wave of an upward correction that began on May 12. The correction is wave 4{-9}, and the middle wave is B{-10}. Fourth waves tend to be Flats,. and that’s how I count wave 4{-9}.
The B wave within a Flat tends to retrace from 100% to 138% of the preceding A wave. Wave A{-10} was 247 points long. If this B-wave retracement behaves normally, it will end between 3855 and 3763.80.
No change in the analysis. I’ve updated the chart, with red lines showing the 100% and 138% retracement levels.
2:20 p.m. New York time
LOW earnings play exit. I’ve exited my short bull put vertical spread on LOW, for 75.6% of maximum potential loss, and have updated the trade analysis with results.
9:35 a.m. New York time
What’s happening now? The S&P 500 E-mini futures stayed close to the 50% retracement mark in overnight trading, and then declined as the opening bell drew near.
What does it mean? The first leg of the upward correction that began on May 12 ended at yesterday’s high, 4095. The second leg, a downward move, can be expected to retrace at least 90% of the first wave and perhaps as much as 138%.
What’s the alternative? Although the first leg appears to have met the requirements for completion — three subwaves within a Flat pattern — there’s enough ambiguity on the chart to suggest that the first leg may still be unfinished.
[S&P 500 E-mini futures at 3:30 p.m., 35-minute bars, with volume]
What does Elliott wave theory say? Under my principal analysis, wave A{-10} within wave 4{-9} ended at Tuesday’s peak, 4095, and wave B{-10} to the downside has begun. Fourth waves tend to take a Flat pattern — although not always — and Flats internally have three subwaves within the A wave, three within B and five within C. However, if wave 4{-9} turns out to be a Zigzag, then subwave A{-10} must have five waves internally and will rise ore before reaching completion. That possibility is my alternative analysis.
We Are Here.
These are the waves currently in progress under my principal analysis. Each line on the list shows the wave number, with the subscript in curly brackets, the traditional degree name, the starting date, the starting price of the S&P 500 E-mini futures, and the direction of the wave.
Learning and other resources. Elliott wave analysis provides context, not prophecy. As the 20th century semanticist Alfred Korzybski put it in his book Science and Sanity (1933), “The map is not the territory … The only usefulness of a map depends on similarity of structure between the empirical world and the map.” And I would add, in the ever-changing markets, we can judge that similarity of structure only after the fact.
See the menu page Analytical Methods for a rundown on where to go for information on Elliott wave analysis.
By Tim Bovee, Portland, Oregon, May 18, 2022
Disclaimer
Tim Bovee, Private Trader tracks the analysis and trades of a private trader for his own accounts. Nothing in this blog constitutes a recommendation to buy or sell stocks, options or any other financial instrument. The only purpose of this blog is to provide education and entertainment.
No trader is ever 100 percent successful in his or her trades. Trading in the stock and option markets is risky and uncertain. Each trader must make trading decisions for his or her own account, and take responsibility for the consequences.
Update 5/18/2022: I exited my short bull put vertical spread on LOW, 30 days before expiration, for a $257 debit per contract/share, a loss before fees of $97 per contract. Shares were trading at $180.15, down $11.25 from the entry level.
The Implied Volatility Rank at exit was 81.8%, down 11.2 points from the entry level.
I exited on the day after entry, for 76.6% of maximum potential loss, because the position moved against my trade and was unprofitable.
Shares fell by 5.9% over one day for a -2,145% annual rate. The options position produced a 37.7% loss for a -13,776% annual rate.
I have entered a short bull put vertical spread on LOW, using options that trade for the last time 31 days hence, on June 17. The premium is a $1.60 credit per contract share and the stock at the time of entry was priced at $191.40.
The Implied Volatility Ratio stood at 93.0%.
Premium:
$1.60
Expire OTM
LOW-bull put spread
Strike
Odds
Delta
Puts
Long
180.00
66.0%
29
Break-even
186.60
62.0%
32.5
Short
185.00
58.0%
36
The premium is 64% of the width of the position’s short/long spread. The profit zone covers a 5.1% move to the downside and an unlimited move to the upside.
The risk/reward ratio is 2.1:1, with maximum risk of $340 and maximum reward of $160 per contract.
How I chose the trade. The trade was placed to coincide with LOW’s earnings announcement, before the opening bell on the day after entry. The short strikes were set in consideration of the expected move of $10.62 either way, based on options pricing, which gives a price range of $180.78 to $202.20, balanced against the need for a low risk/reward ratio and a sufficiently high premium to make the trade worthwhile.
By Tim Bovee, Portland, Oregon, May 17, 2022
Disclaimer
Tim Bovee, Private Trader tracks the analysis and trades of a private trader for his own accounts. Nothing in this blog constitutes a recommendation to buy or sell stocks, options or any other financial instrument. The only purpose of this blog is to provide education and entertainment.
No trader is ever 100 percent successful in his or her trades. Trading in the stock and option markets is risky and uncertain. Each trader must make trading decisions for his or her own account, and take responsibility for the consequences.
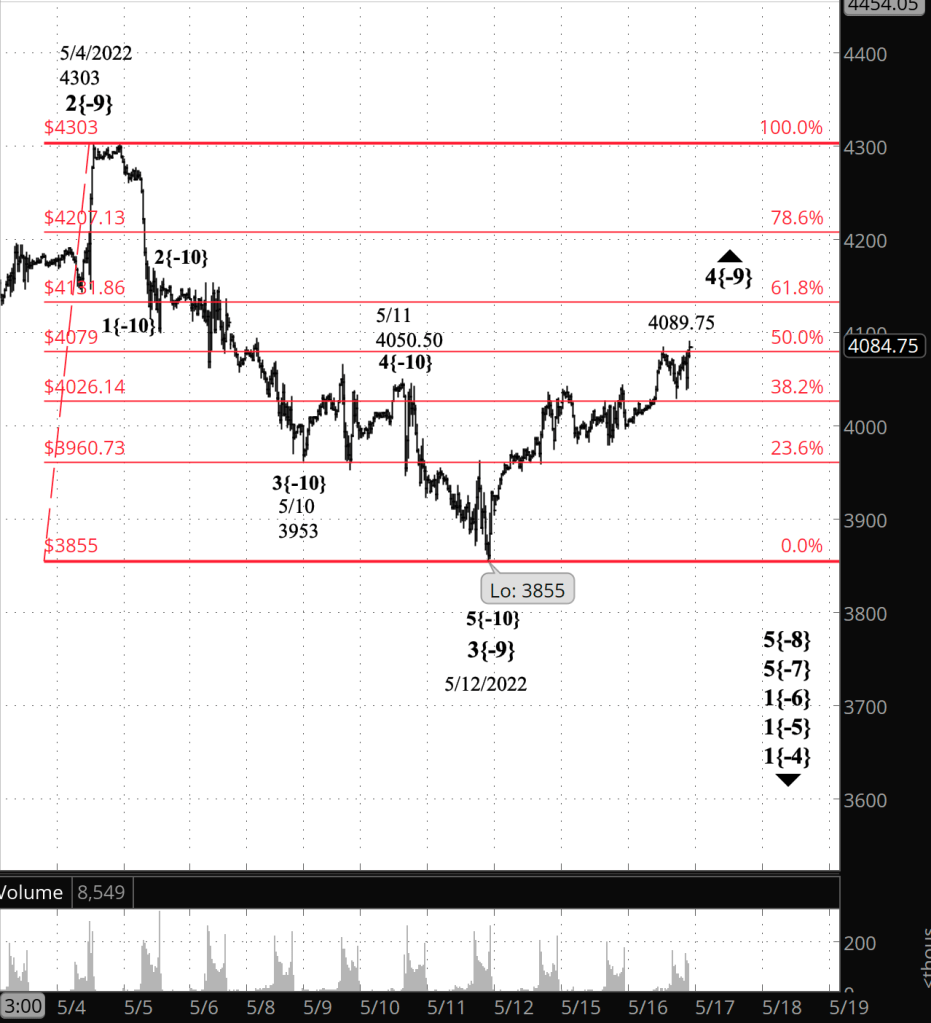
Half an hour before the closing bell. The S&P 500 rose six points above the overnight high, to 4089.75 on the futures. The price declined to a 38.2% retracement of the decline from May 4 to May 12 and then moved back up to a 50% retracement. The upward correction, wave 4{-9}, continues. No change in the analysis. I’ve updated the chart.
1:30 p.m. New York time
LOW earnings play entry. I’ve entered a short bull put vertical spread, using options that expire on June 17, and have posted an analysis of the trade.
12:55 p.m. New York time
HD earnings play exit. I’ve exited my short bull put options spread on HD for 64.9% of maximum potential profit and have updated the trade analysis with results.
9:35 a.m. New York time
What’s happening now? The S&P 500 E-mini futures continued to rise overnight, reaching into the 4080s.
What does it mean? I’ve revised the principal analysis to accommodate the length of the rise. The March 12 low marks the end of the downtrend that began on May 4 from 4303. The subsequent rise is an upward correction that has so far retraced 50% of the decline. I’ve placed a Fibonacci retracement grid over the chart.
What’s the alternative? If the price moves above 4303, the high of May 4, then the count may require a revision. I discuss the reasoning behind that conclusion in the Elliott wav theory section below.
[S&P 500 E-mini futures at 3:30 p.m., 30-minute bars, with volume]
What does Elliott wave theory say? The Elliott wave theory rule that required a reanalysis imposes a limitation on 4th waves: They never move beyond the end of the preceding 1st wave. Under my previous analysis (see yesterday’s Trader’s Notebook), the uptrend that began May 12 was labeled as wave 4{-11}. Its overnight move beyond the end of wave 1{-11} meant the labeling no longer matched the chart — the map no longer matched the territory.
Under the new analysis, I’ve raised the degree of waves within the decline that began on May 4 — wave 3{-9} — and labelled the low of May 12, at 3855, as the end of that decline. The subsequent rise is wave 4{-9}, an upward correction that will likely take the form of a Flat.
Wave 4{-9}, of course, has the same limitation as any 4th wave: It can’t move beyond the end of wave 1{-9}, which is 4303, attained on May 4.
One quirk of the labeling is the placement of waves 1{-10} and 2{-10}. That 2nd wave is extraordinarily small. It doesn’t mean it’s wrong, but it is unusual, perhaps showing the power of the bearish sentiment in early May. I chose that labeling to ensure that wave 3{-10} wouldn’t be shorter than both wave 1{-10} and 5{10}.
We Are Here.
These are the waves currently in progress under my principal analysis. Each line on the list shows the wave number, with the subscript in curly brackets, the traditional degree name, the starting date, the starting price of the S&P 500 E-mini futures, and the direction of the wave.
Learning and other resources. Elliott wave analysis provides context, not prophecy. As the 20th century semanticist Alfred Korzybski put it in his book Science and Sanity (1933), “The map is not the territory … The only usefulness of a map depends on similarity of structure between the empirical world and the map.” And I would add, in the ever-changing markets, we can judge that similarity of structure only after the fact.
See the menu page Analytical Methods for a rundown on where to go for information on Elliott wave analysis.
By Tim Bovee, Portland, Oregon, May 17, 2022
Disclaimer
Tim Bovee, Private Trader tracks the analysis and trades of a private trader for his own accounts. Nothing in this blog constitutes a recommendation to buy or sell stocks, options or any other financial instrument. The only purpose of this blog is to provide education and entertainment.
No trader is ever 100 percent successful in his or her trades. Trading in the stock and option markets is risky and uncertain. Each trader must make trading decisions for his or her own account, and take responsibility for the consequences.
Update 5/17/2022: I exited my short bull put vertical spread on HD, one day before expiration, for a $1.10 debit per contract/share, a profit before fees of $66 per contract. Shares were trading at $308.87, up $17.32 from the entry level.
The Implied Volatility Rank at exit was 68.8%, down 21.3 points from the entry level.
I exited on the day after entry, at 64.9% of maximum potential profit, well above my normal exit point for earnings plays, 25% of max.
Shares rose by 5.9% over one day for a +2,168% annual rate. The options position produced a 60.0% return for a +21,900% annual rate.
I have entered a short bull put vertical spread on HD, using options that trade for the last time 32 days hence, on June 17. The premium is a $1.87 credit per contract share and the stock at the time of entry was priced at $291.55.
The Implied Volatility Ratio stood at 90.1%.
Premium:
$1.87
Expire OTM
HD-bull put spread
Strike
Odds
Delta
Puts
Long
280.00
59.0%
35
Break-even
286.87
56.5%
37.5
Short
285.00
54.0%
40
The premium is 74.8% of the width of the position’s short/long spread. The profit zone covers a 1.6% move to the downside and an unlimited move to the upside.
The risk/reward ratio is 1.7:1, with maximum risk of $313 and maximum reward of $187 per contract.
How I chose the trade. The trade was placed to coincide with HD’s earnings announcement, before the opening bell on the day after entry. The expected move after the announcement is $15.09 either way, based on options pricing, which gives a price range of $277.95 to $308.13. I moved closer in than the price range would suggest for the sake of a lower risk in comparison with the reward.
By Tim Bovee, Portland, Oregon, May 16, 2022
Disclaimer
Tim Bovee, Private Trader tracks the analysis and trades of a private trader for his own accounts. Nothing in this blog constitutes a recommendation to buy or sell stocks, options or any other financial instrument. The only purpose of this blog is to provide education and entertainment.
No trader is ever 100 percent successful in his or her trades. Trading in the stock and option markets is risky and uncertain. Each trader must make trading decisions for his or her own account, and take responsibility for the consequences.
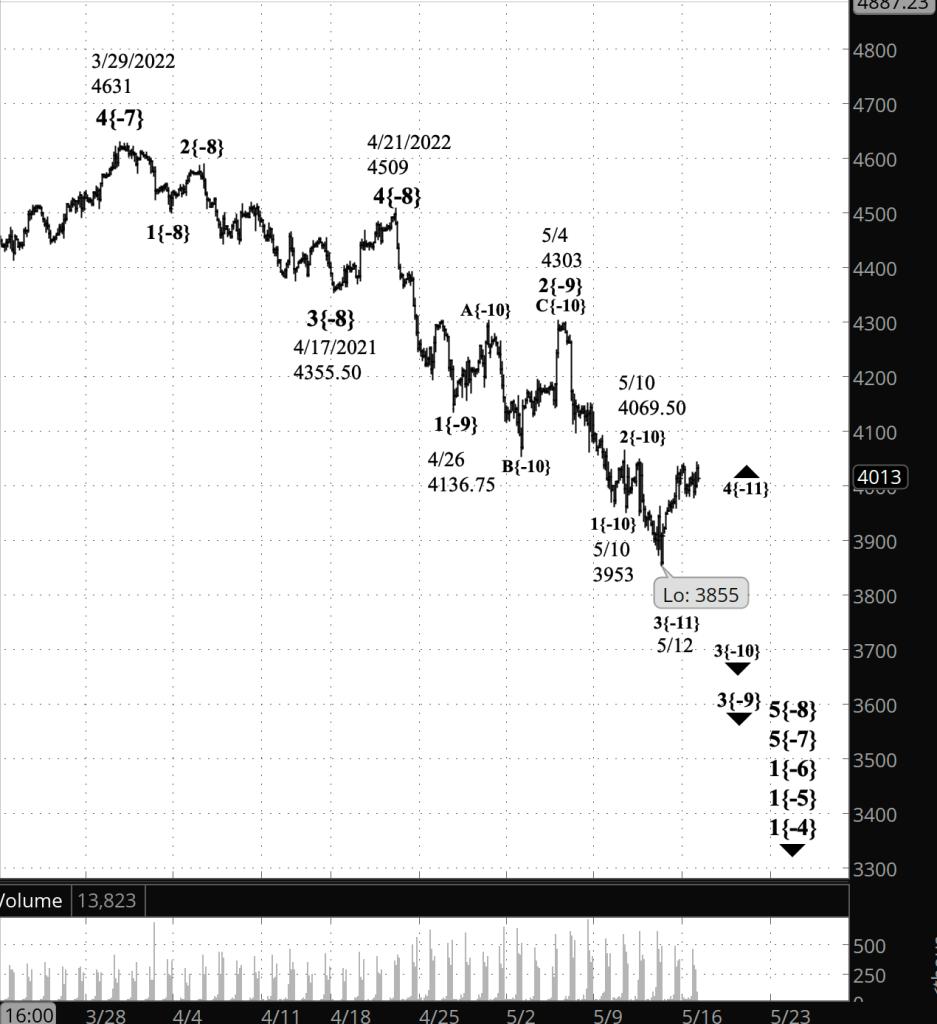
Half an hour before the closing bell. The S&P 500 traded in a narrow range during the session. The wave 4{-11} upward correction is still underway. It lie within a series of increasingly larger downtrends — wave 3{-10} within wave 3{-9} within wave 5{-8}. No change in the analysis from this morning. I’ve updated the chart.
10:05 a.m. New York time
HD earnings play entry. I’ve entered a short bull put vertical spread on HD, using options that expire in 32 days, and have posted an analysis of the trade.
Sunday
Bitcoin analysis. Over the weekend I posted an Elliott wave analysis of Bitcoin. The cryptocurrency, which has been the subject of much bearish anxiety in recent weeks, is on the last leg of a downward correction that began on May 14, 2021 from 65,520. When the correction is complete, the price will rise above last year’s peak, most likely by a significant distance.
9:35 a.m. New York time
What’s happening now? The S&P 500 E-mini futures rose after trading resumed after the weekend.
What does it mean? The rise is a low-level upward correction within the downtrend that began on May 10.
What’s the alternative? It’s possible that the correction is one degree larger than my principal analysis has it. If so, it would mean that the downtrend that began on May 10 ended on May 12, although the larger downtrend that began on April 21 is still underway.
[S&P 500 E-mini futures at 3:30 p.m., 2-hour bars, with volume]
What does Elliott wave theory say? Under the principal analysis, wave 3{-10} within wave 3{-9} within wave {5-8} is is still underway. The present upward correction is a subwave of 3{-10}.
Under the alternative analysis, wave 3{-10} ended on May 10 and the low of May 12 is the end of wave 3{-9}. Under this scenario, the upward correction is wave 4{-9}.
For both analyses, a firm rule of Elliott wave theory is guiding the wave count. Wave 3 can never be shorter than both waves 1 and 5 in a trend, and the 3rd wave is almost always the longest of the three. So if I see a 3rd wave that’s shorter the preceding 1st wave, I tend to change the count. True, that change might be unnecessary; the 5th wave could be shorter than the 3rd, and in that case the Elliott wave rule would be satisfied. Nonetheless, the odds are that the 5th wave will be longer than the 1st wave, so changing the count is usually the more accurate decision.
We Are Here.
These are the waves currently in progress under my principal analysis. Each line on the list shows the wave number, with the subscript in curly brackets, the traditional degree name, the starting date, the starting price of the S&P 500 E-mini futures, and the direction of the wave.
Learning and other resources. Elliott wave analysis provides context, not prophecy. As the 20th century semanticist Alfred Korzybski put it in his book Science and Sanity (1933), “The map is not the territory … The only usefulness of a map depends on similarity of structure between the empirical world and the map.” And I would add, in the ever-changing markets, we can judge that similarity of structure only after the fact.
See the menu page Analytical Methods for a rundown on where to go for information on Elliott wave analysis.
By Tim Bovee, Portland, Oregon, May 16, 2022
Disclaimer
Tim Bovee, Private Trader tracks the analysis and trades of a private trader for his own accounts. Nothing in this blog constitutes a recommendation to buy or sell stocks, options or any other financial instrument. The only purpose of this blog is to provide education and entertainment.
No trader is ever 100 percent successful in his or her trades. Trading in the stock and option markets is risky and uncertain. Each trader must make trading decisions for his or her own account, and take responsibility for the consequences.
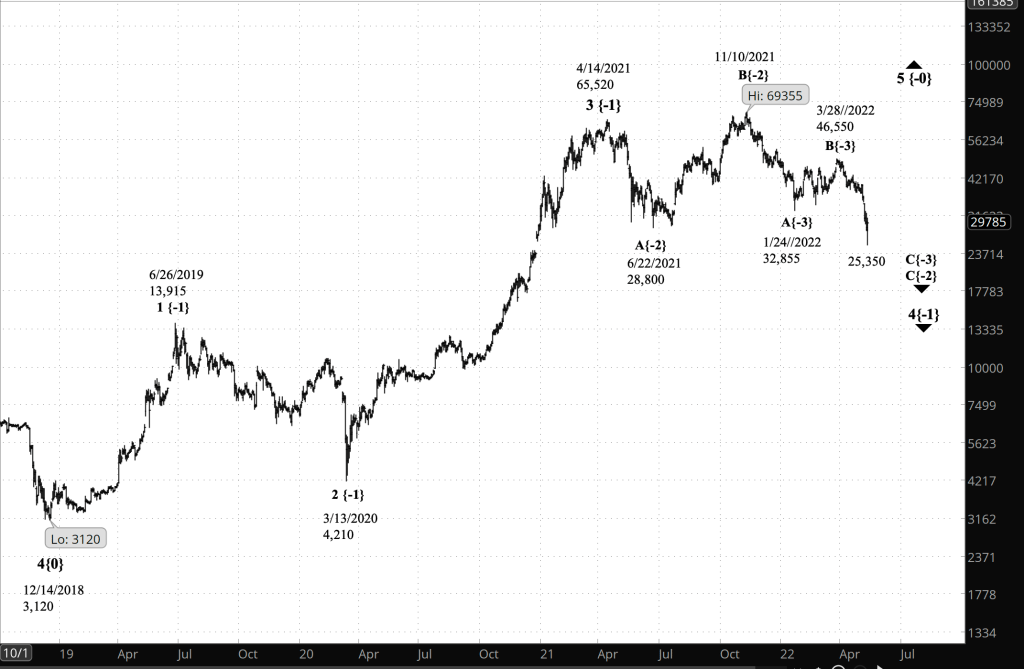
What’s happening now? Bitcoin futures continue a decline that began on March 28 from 46,550, reaching a low of 25,350 before rising slightly.
What does it mean? By my principal analysis, Bitcoin is on the last leg of a downward correction that began on April 14, 2021 from 65,520. When the correction is complete, the price will rise above the April 14 peak, most likely by a significant distance.
What’s the alternative? Corrections sometimes have more than one three-wave corrective pattern, linking together two patterns or three. If that should occur here, then the rise above the April 14 peak will be delayed. The first corrective pattern has so far lasted for more than a year, and I would anticipate that a second and perhaps a third pattern would each last a similar amount of time.
[BTC/USD futures at 11:25 a.m., daily bars]
What does Elliott wave theory say? Bitcoin is presently within wave 4{-1}, a downward correction that began on April 14. The correction is happening within uptrending wave 5{0}, which began on December 14, 2018 from 3,120.
The correction has taken the form of a Flat pattern, with five waves in the first internal movement, wave A{-2}, and three the the next movement, wave B{-2}. The final movement in the Flat, wave C{-2}, is now underway, has completed two waves internally, and is now on its third and final wave.
Fourth waves have a higher likelihood of a compound correction, with two or three corrective patterns, each tied together with a connector, called a X wave, than are 2nd-wave corrections. So while the most likely outcomes for wave 4{-1} is a single pattern, a compound correction of two or three waves isn’t out of the question.
However many patterns there might be, when wave 4{-1} is complete, it will be followed by a resumption of the uptrend, wave 5{-1}, which almost certainly will carry the price above 65,520. Fifth waves have no limit on how far they can travel, beyond the need to be more or or less of a similar magnitude as waves of the same degree. A 5th wave can be truncated, in which case the price will remain below 65,520, or it can be extended, in which case the price will rise far beyond present expectations. Or it could be a normal 5th wave, with five waves within it, which would carry the price a good distance above 65,520.
It is said that things are always darkest before the dawn, and the corollary to that is that dawn is always followed, eventually, by sunset and the dark of night.
Wave 5{-1} is the final leg of wave 5{0}, which began on December 14, 2018 and will end years from now. And the end of 5{-1} and its parent wave 5{0} will mark the beginning of a large-scale downtrend in Bitcoin, that will carry the price well below the wave 4{0} starting point, 3,120.
We Are Here.
These are the waves currently in progress under my principal analysis. Each line on the list shows the wave number, with the subscript in curly brackets, the traditional degree name, the starting date, the starting price of the S&P 500 E-mini futures, and the direction of the wave.
Futures:
5{0} Intermediate, 12/14/2018, 3,120 (up)
4{-1} Minor, 4/14/2021, 65,520 (down)
C{-2} Minute, 11/10/2021, 69,355 (down)
C{-3} Minuette, 3/28/2022, 46,550 (down)
Learning and other resources. Elliott wave analysis provides context, not prophecy. As the 20th century semanticist Alfred Korzybski put it in his book Science and Sanity (1933), “The map is not the territory … The only usefulness of a map depends on similarity of structure between the empirical world and the map.” And I would add, in the ever-changing markets, we can judge that similarity of structure only after the fact.
See the menu page Analytical Methods for a rundown on where to go for information on Elliott wave analysis.
By Tim Bovee, Portland, Oregon, May 15, 2022
Disclaimer
Tim Bovee, Private Trader tracks the analysis and trades of a private trader for his own accounts. Nothing in this blog constitutes a recommendation to buy or sell stocks, options or any other financial instrument. The only purpose of this blog is to provide education and entertainment.
No trader is ever 100 percent successful in his or her trades. Trading in the stock and option markets is risky and uncertain. Each trader must make trading decisions for his or her own account, and take responsibility for the consequences.
Half an hour before the closing bell. The S&P 500 rose during the session, reaching 4036, as a lower degree upward correction within downtrending wave 3{-10}. No change in the analysis. I’ve updated the chart.
9:35 a.m. New York time
What’s happening now? The S&P 500 E-mini futures rose in overnight trading, reversing from Thursday’s low, 3855.
What does it mean? The low degree downtrend that began on May 10 continues. The rise is an upward correction and will be followed by another decline, the final leg of the downtrend.
What’s the alternative? It’s possible that the May 12 low, 3855, marked the end of the May 10 downtrend. I’ve rejected this scenario based on the short distance it assigns to the decline from May 10. More on the subject in the Elliott wave theory section, below.
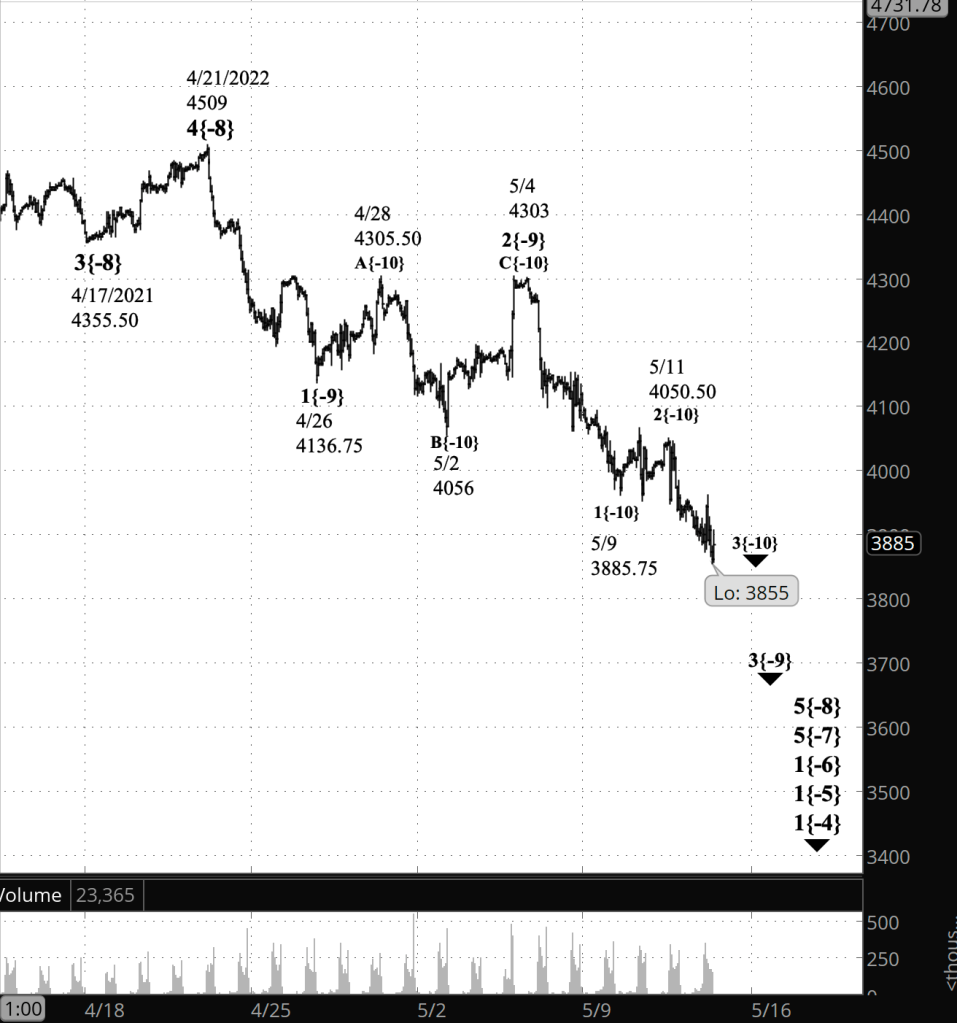
[S&P 500 E-mini futures at 3:30 p.m., 2-hour bars, with volume]
What does Elliott wave theory say? The decline that began from 4069.50 on May 10 is wave 3{-10} within wave 3{-9}.
Under my principal analysis, the May 12 low, 3855, marks the end of wave 1{-11} within wave 3{-10}, and the subsequent rise is an upward correction, wave 2{-11}.
Wave 1{-10} was 350 points long. Under a strict rule of Elliott wave analysis, a 3rd wave can’t be shorter than both the 1st and 5th waves of a trend. So far, wave 3{-10} has covered 214.50 points. It’s possible for a 3rd wave to be shorter than the 1st, as long as the 5th wave is shorter than the 3rd. In this case, I’m skeptical that such a scenario would be playing out. Third waves tend to be the most energetic of all the waves within a trend. Wave 3{-10} is a subwave of another 3rd wave, 3{-9}. I think of it as the 3rd wave of a 3rd wave having extra energy, and I wouldn’t expect to see a 3rd of a 3rd so abysmally truncated.
So my principal analysis has wave 3{-10} as still underway, and wave 2{-11} within it will be followed by wave 3{-11}, a decline that is likely to carry the price significantly below the May 10 starting point of wave 3{-10}.
The alternative analysis labels the May 12 low, 3855, as the end of wave 3{-10}. And for the reasons stated above, it’s possible, but in view view, unlikely.
We Are Here.
These are the waves currently in progress under my principal analysis. Each line on the list shows the wave number, with the subscript in curly brackets, the traditional degree name, the starting date, the starting price of the S&P 500 E-mini futures, and the direction of the wave.
Learning and other resources. Elliott wave analysis provides context, not prophecy. As the 20th century semanticist Alfred Korzybski put it in his book Science and Sanity (1933), “The map is not the territory … The only usefulness of a map depends on similarity of structure between the empirical world and the map.” And I would add, in the ever-changing markets, we can judge that similarity of structure only after the fact.
See the menu page Analytical Methods for a rundown on where to go for information on Elliott wave analysis.
By Tim Bovee, Portland, Oregon, May 13, 2022
Disclaimer
Tim Bovee, Private Trader tracks the analysis and trades of a private trader for his own accounts. Nothing in this blog constitutes a recommendation to buy or sell stocks, options or any other financial instrument. The only purpose of this blog is to provide education and entertainment.
No trader is ever 100 percent successful in his or her trades. Trading in the stock and option markets is risky and uncertain. Each trader must make trading decisions for his or her own account, and take responsibility for the consequences.
DIS earnings play exit. I’ve exited my short bull put spread on DIS for 55.1% of the maximum potential loss and have updated the trade analysis with results.
3:30 p.m. New York time
Half an hour before the closing bell. The S&P 500 rose during the session and then resumed its decline, pushing down to a low so far of 3855. Wave 3{-10} within wave 3{-9} within wave 5{-8} continues. The three waves, each a degree larger than the one listed before, are all downtrending. I’ve updated the upper chart.
10:50 a.m. New York time
What happens in the long run? I’ve added an second analysis, below the Elliott wave analysis section, titled “The road down, and back up, and down again”, that puts the present decline in the context of the equities market stretching back to before the New York Stock Exchange even existed, to the coffee-houses where traders bought and sold shares on the London Stock Exchange, the origin of the present U.S. collection of exchanges.
9:35 a.m. New York time
What’s happening now? The S&P 500 E-mini futures continued to decline overnight, reaching a low of 3883.25 right after the opening bell.
What does it mean? The decline from May 4 has retraced 167% of the rise from May 2 to May 4. That ratio is well in excess of the Elliott wave guidelines for the ratio between the middle wave and the first wave of a Flat correction. The map no longer matches the territory, and when that happens, the map must change.
Under my principal analysis, the upward correction that began on April 26 ended on May 4, and the subsequent decline is a resumption of the downtrend that began on April 21. I’ll discuss the change in analysis in greater detail in the Elliott wave theory section.
What’s the alternative? The alternative is that my previous count is correct, the upward correction is still underway, and the overly long middle wave is just an outlier. The Elliott wave guidelines say that the middle wave of a Flat correction generally reaches no further than 138% retracement of the first wave of the correction. But it’s a guideline, not a rule.
However, the new count is quite clear and that alternative seems far less plausible at this point. If the price reverses soon and exceeds 4303, then that will signal that the implausible analysis is in fact the correct one.
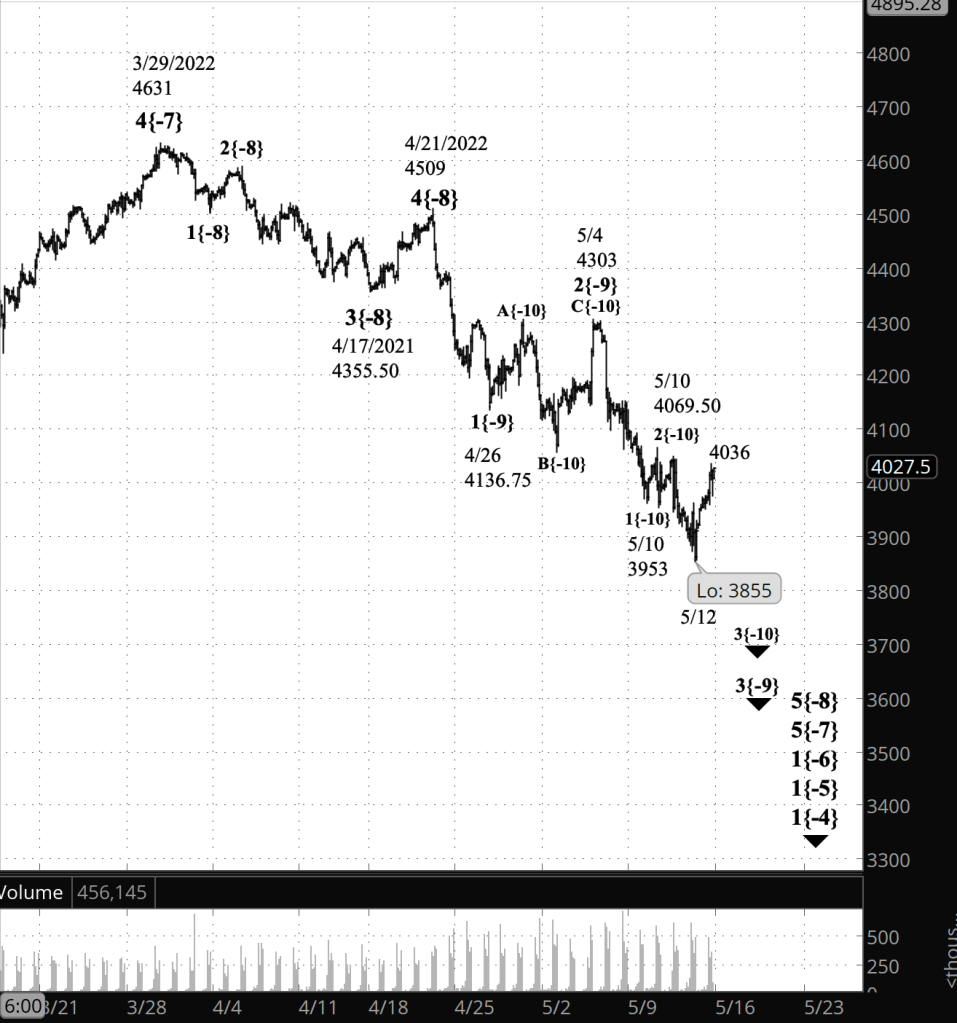
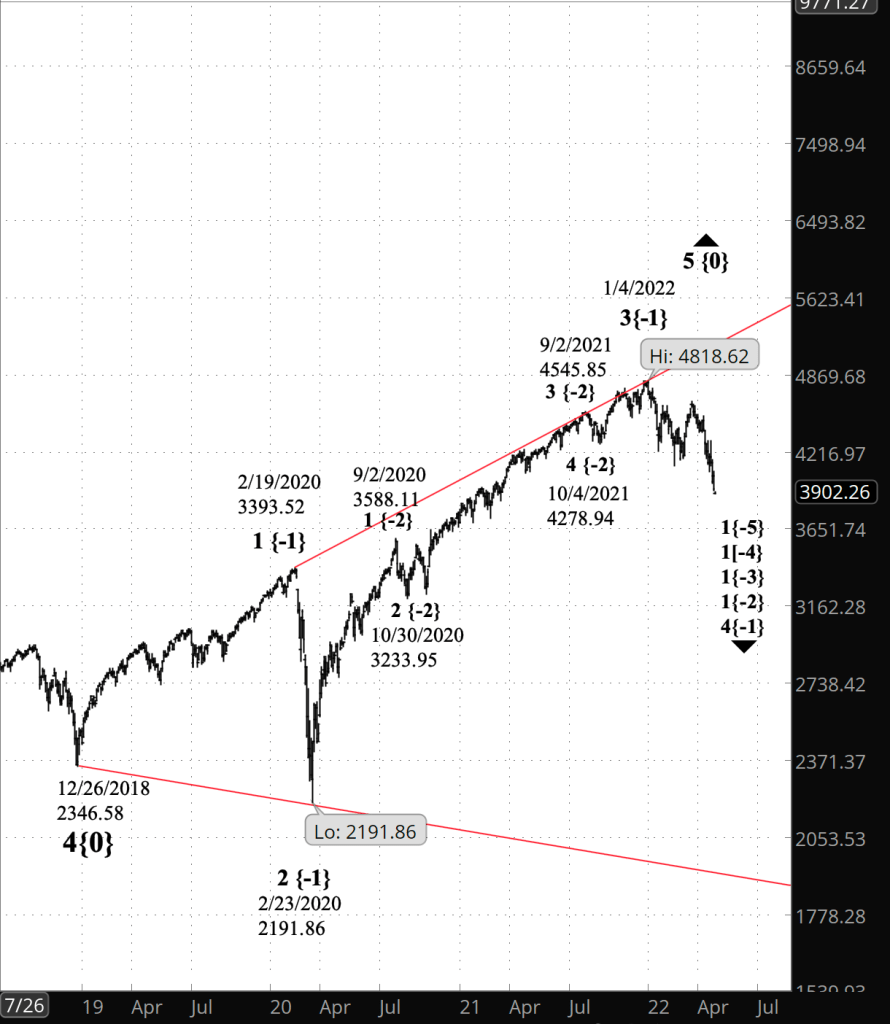
The Charts. I’m posting two S&P 500 charts today. The upper chart, the S&P 500 futures, shows a close-up view of the decline that began on April 21. The lower chart, the S&P 500 index, shows a big-picture view of the massive expanding Diagonal Triangle that began on December 26, 2018.
[S&P 500 E-mini futures at 3:30 p.m., hourly bars, with volume]
[S&P 500 index at 9:32 a.m., 2-day bars]
What does Elliott wave theory say? The issue that required a change in the former analysis is the ratio between wave A{-11} and wave B{-11} within wave 2{-10}, an upward correction. The Elliott wave guidelines for a Flat corrective pattern say that the ratio generally ranges from 100% to 138%. Yesterday’s low was a 144% retracement, a bit too far. Today’s retracement of 167% (so far) is far larger than seems reasonable.
The upper chart above shows the new principal analysis. For a chart of the old analysis, see the May 11 Trader’s Notebook.
The revision to the count is similar in method — raising waves to higher degrees — although not identical in outcome, to my alternative count in Elliott wave theory section of the May 6 Trader’s Notebook.
Under my principal analysis, the decline that began on May 4 from 4303 is wave 3{-9} within wave 5{-8}, which began on April 21 from 4509.
Within wave 3{-9}, the most straight forward count of the internal structure has wave 1{-10} complete on May 9, followed by a brief wave 2{-10} that ended on May 11, and the present wave 3{-10}.
There’s no rule limiting on how far a 3rd wave can go, beyond the need for proportionality with other waves of the same degree. A 3rd wave is usually longer — quite a bit longer — that the preceding 1st wave.
Wave 1{-10} covered 417.25 points. Wave 3{-10} began on May 11 from 4050.50. If wave 3{-10} covers the bare minimum — one point longer than wave 1{-10}, then the price will carry down to 3632.25. If it covers double the length of the 1st wave, then the price would reach 3216, a level last seen in July 2020.
Whatever the actual distance covered turns out to be, 3{-10} has the capacity to carry the price down a significant distance. And after the future 4th wave upward correction that will follow, wave 5{-10} will carry the price down even further.
As the longer-term chart shows, the ultimate target of the decline that began on January 4 is the lower boundary of the expanding Diagonal Triangle that began on December 26, 2018. That lower boundary is presently in the 1900s, and it will move lower each day the S&P 500 and its derivatives are traded, which for the futures is every day except Saturdays and holidays.
Under the highly implausible alternative analysis, downward wave B{-11} within the upward correction, wave 2{-10}, that began on May 2 is still underway, despite having exceeded the Elliott wave guidelines for the ratio between an A wave and a B wave in a Flat corrective pattern.
The road down, and back up, and down again. The nature of the markets is that trends don’t run in a straight line. Elliott wave theory is correct in placing stress on the fractal nature of market prices — each downtrend contains smaller uptrends within it, and those uptrends in turn contain still smaller downtrends.
Looking at the decline that began on January 4 from 4808.25 on the futures, 4818.62 on the index: That point marked the beginning of a wave 1{-6}, which within it contains trends of increasingly smaller degree: downtrending wave 5{-7}, downtrending wave 5{-8}, downtrending wave 3{-9} and downtrending wave 3{-10}.
In the Elliott wave analysis section above, I spoke of the ultimate goal of the decline as being the lower boundary of an expanding Diagonal Triangle that began on December 26, 2018, with the price reaching below 2000, and perhaps significantly so. (See the lower chart below.)
As always, the path downward won’t be straight path. Wave 3{-10] will be followed by a 4th wave upward correction and then a 5th wave downtrend. The end of that final wave will also mark the end of wave 3{-9}, which will in turn also be followed a larger upward correction and then a larger 5th wave downtrend.
The end of wave 5{-9} will also mark the end of several waves, of ascending degree: Waves 5{-8}, 5{-7} and 1{-6}, the last wave having begun on January 4. The end of a 1st wave means that the trend at that particular degree has another four waves to go: An upward 2nd wave, downward 3rd, upward 4th and downward 5th.
Wave 1{-6} is embedded with a series of 1st waves of increasingly higher degree: Wave {-5} through wave 1{-2}, each with four additional up and down waves before reaching completion. At those higher degrees, each downtrending wave and upward correction will potentially feel very much like a major bear market and bull market.
The wave that will carry the price down to the lower boundary of the expanding Diagonal Triangle is wave 4{-1}, which began on January 4. It will be followed by wave 5{-1}, which will carry the price back to the upper boundary of the correction, which is presently in the 5200s and will have climbed much higher by the time the price reaches it again.
The end wave 5{-1} will mark the end of the entire Triangle, wave 5{0}, which in turn will mark the end of three 5th waves, each a degree larger than the one before: Waves 5{+1}, 5{+2} and A{+3} within wave 4{+4}. Wave 4{+4}, according to research by Robert Prechter, the head Elliott Wave International, the pre-eminent center of Elliott wave analysis, had its beginning, long the long before American independence, on the London Stock Exchange, which was established by Queen Elizabeth 1 in 1571.
The downtrending wave 5{+4} that follows 4{+4} will define the lives of many generations of traders as they profit and lose from the massive ups and downs within it.
We Are Here.
These are the waves currently in progress under my principal analysis. Each line on the list shows the wave number, with the subscript in curly brackets, the traditional degree name, the starting date, the starting price of the S&P 500 E-mini futures, and the direction of the wave.
Learning and other resources. Elliott wave analysis provides context, not prophecy. As the 20th century semanticist Alfred Korzybski put it in his book Science and Sanity (1933), “The map is not the territory … The only usefulness of a map depends on similarity of structure between the empirical world and the map.” And I would add, in the ever-changing markets, we can judge that similarity of structure only after the fact.
See the menu page Analytical Methods for a rundown on where to go for information on Elliott wave analysis.
By Tim Bovee, Portland, Oregon, May 12, 2022
Disclaimer
Tim Bovee, Private Trader tracks the analysis and trades of a private trader for his own accounts. Nothing in this blog constitutes a recommendation to buy or sell stocks, options or any other financial instrument. The only purpose of this blog is to provide education and entertainment.
No trader is ever 100 percent successful in his or her trades. Trading in the stock and option markets is risky and uncertain. Each trader must make trading decisions for his or her own account, and take responsibility for the consequences.



You must be logged in to post a comment.