Update 5/12/2022: I exited my short bull put vertical spread on DIS, 36 days before expiration, for a $3.91 debit per contract/share, a loss before fees of $101 per contract. Shares were trading at $103.38, down $5.68 from the entry level.
The Implied Volatility Rank at exit was 51.5%, down 50.2 points from the entry level.
I exited on the day after entry, for 55.1% of maximum potential loss, because the position was unprofitable, despite analyst forecasts that a positive earnings surprise was likely. Instead, the stock lost value.
Shares fell by 5.2% over one day for a -1,901% annual rate. The options position produced a -27.2% loss for a -9,428% annual rate.
I have entered a short bull put vertical spread on DIS, using options that trade for the last time 37 days hence, on June 17. The premium is a $2.90 credit per contract share and the stock at the time of entry was priced at $109.06.
The Implied Volatility Ratio stood at 109.06%.
Premium:
$2.90
Expire OTM
DIS-bull put spread
Strike
Odds
Delta
Puts
Long
95.00
75.0%
20
Break-even
107.90
66.0%
28.5
Short
105.00
57.0%
37
The premium is 58% of the width of the position’s short/long spread. The profit zone covers a 1.1% move to the downside and an unlimited move to the upside.
The risk/reward ratio is 2.4:1, with maximum risk of $710 and maximum reward of $290 per contract.
How I chose the trade. The trade was placed to coincide with DIS’s earnings announcement, after the closing bell on the day of entry. The short strikes were set with consideration given to the expected move of $9.16 either way, based on options pricing, which gives a price range of $99.90 to $118.22.
By Tim Bovee, Portland, Oregon, May 11, 2022
Disclaimer
Tim Bovee, Private Trader tracks the analysis and trades of a private trader for his own accounts. Nothing in this blog constitutes a recommendation to buy or sell stocks, options or any other financial instrument. The only purpose of this blog is to provide education and entertainment.
No trader is ever 100 percent successful in his or her trades. Trading in the stock and option markets is risky and uncertain. Each trader must make trading decisions for his or her own account, and take responsibility for the consequences.
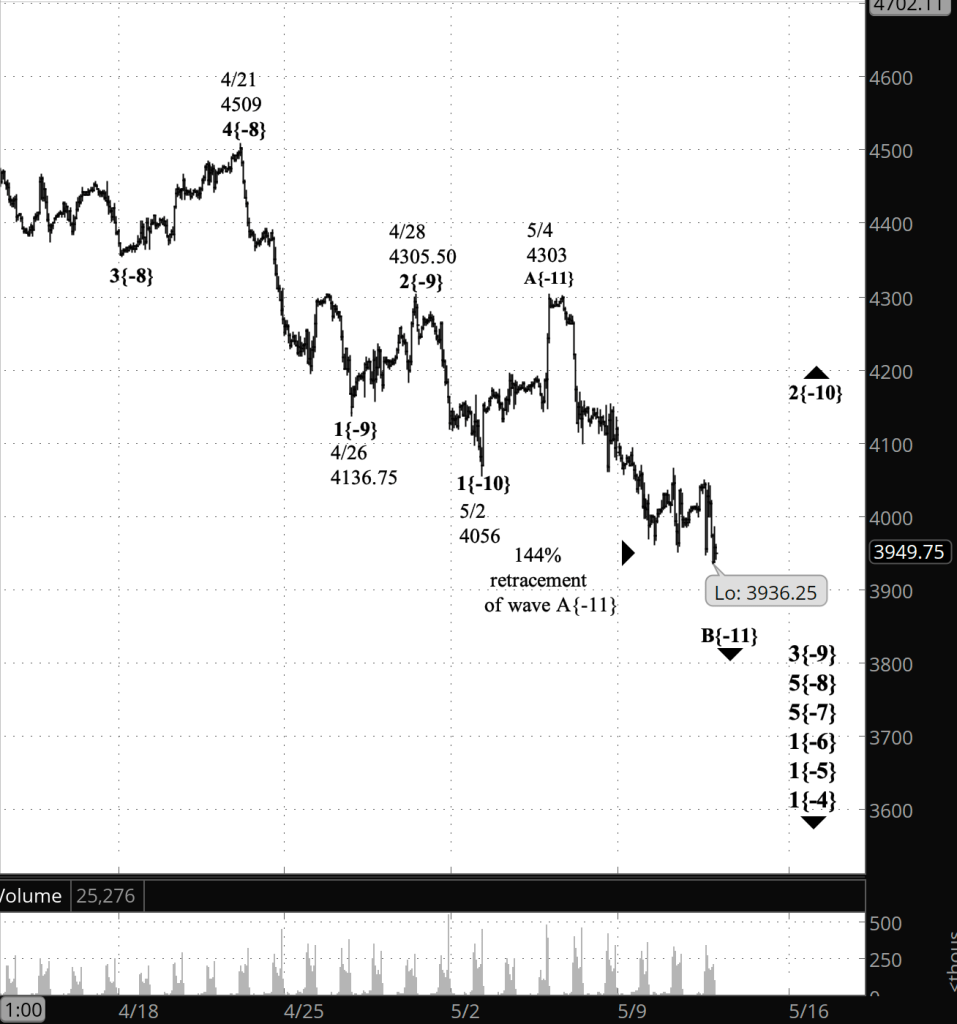
Half an hour before the closing bell. The S&P 500 moved slightly lower during the trading session, to 3936.25. With the exception of that price, this morning’s principal analysis stands. I’ve updated the chart.
2:55 p.m. New York time
DIS earnings play entry. I’ve entered a short bull put vertical spread on DIS, using options that expire on June 17, and have posted an analysis of the trade.
9:35 a.m. New York time
What’s happening now? The S&P 500 E-mini futures traded in a narrow range overnight until the U.S. inflation report was released, when it fell sharply, within half an hour dipping below Tuesday’s low to 3947.25.
What does it mean? The declining middle segment of the upward correction that began on May 4 continues. When it is complete, the final segment of the corrective pattern will carry the price back up, most likely beyond the May 4 high of 4303.
What’s the alternative? The overnight low could mark the end of the middle segment and the start of the final wave of a three-wave corrective pattern.
If correction takes a simple form, then the end of the corrective pattern will also mark the end of the upward correction. However, corrections sometimes take compound forms, linking two or three corrective patterns together. As the New York Yankees baseball great Yogi Berra said, “It ain’t over ’til it’s over.”
[S&P 500 E-mini futures at 3:30 p.m., hourly bars, with volume]
What does Elliott wave theory say? The principal analysis has basically been unchanged for a several days, but each day with a lower low. Wave B{-11} — the middle wave within the wave 2{-10} upward correction that began on May 2 — has so far retraced 144% of wave A{-11}. The rising C wave which will follow can be expected to retrace 100% to 165% of the preceding A wave, giving a target range of 4303 to 4463.50, more or less.
All of this is happening within a series of downtrends of larger degree: Wave 3{-9}, which began April 28, within wave 5{-8} from April 21, within wave 5{-7} from March 29, within wave 1{-6} from January 4, and five more steps further up the ladder of degrees to wave 4{-1}, which also began on January 4. The entire structure is part of wave 5{0}, an expanding Diagonal Triangle that began on December 26, 2018.
The first alternative analysis, similar to the past few days, would place the end of wave B{-11} and the beginning of wave C{-11} at the pre-session low of 3947.25.
The second alternative acknowledges the possibility of a compound correction, where wave C{-11}, instead of marking the end of its parent wave 2{-10}, is followed by a connecting wave, X{-11}, and then a second corrective pattern, extending wave 2{-10}.
We Are Here.
These are the waves currently in progress under my principal analysis. Each line on the list shows the wave number, with the subscript in curly brackets, the traditional degree name, the starting date, the starting price of the S&P 500 E-mini futures, and the direction of the wave.
Learning and other resources. Elliott wave analysis provides context, not prophecy. As the 20th century semanticist Alfred Korzybski put it in his book Science and Sanity (1933), “The map is not the territory … The only usefulness of a map depends on similarity of structure between the empirical world and the map.” And I would add, in the ever-changing markets, we can judge that similarity of structure only after the fact.
See the menu page Analytical Methods for a rundown on where to go for information on Elliott wave analysis.
By Tim Bovee, Portland, Oregon, May 11, 2022
Disclaimer
Tim Bovee, Private Trader tracks the analysis and trades of a private trader for his own accounts. Nothing in this blog constitutes a recommendation to buy or sell stocks, options or any other financial instrument. The only purpose of this blog is to provide education and entertainment.
No trader is ever 100 percent successful in his or her trades. Trading in the stock and option markets is risky and uncertain. Each trader must make trading decisions for his or her own account, and take responsibility for the consequences.
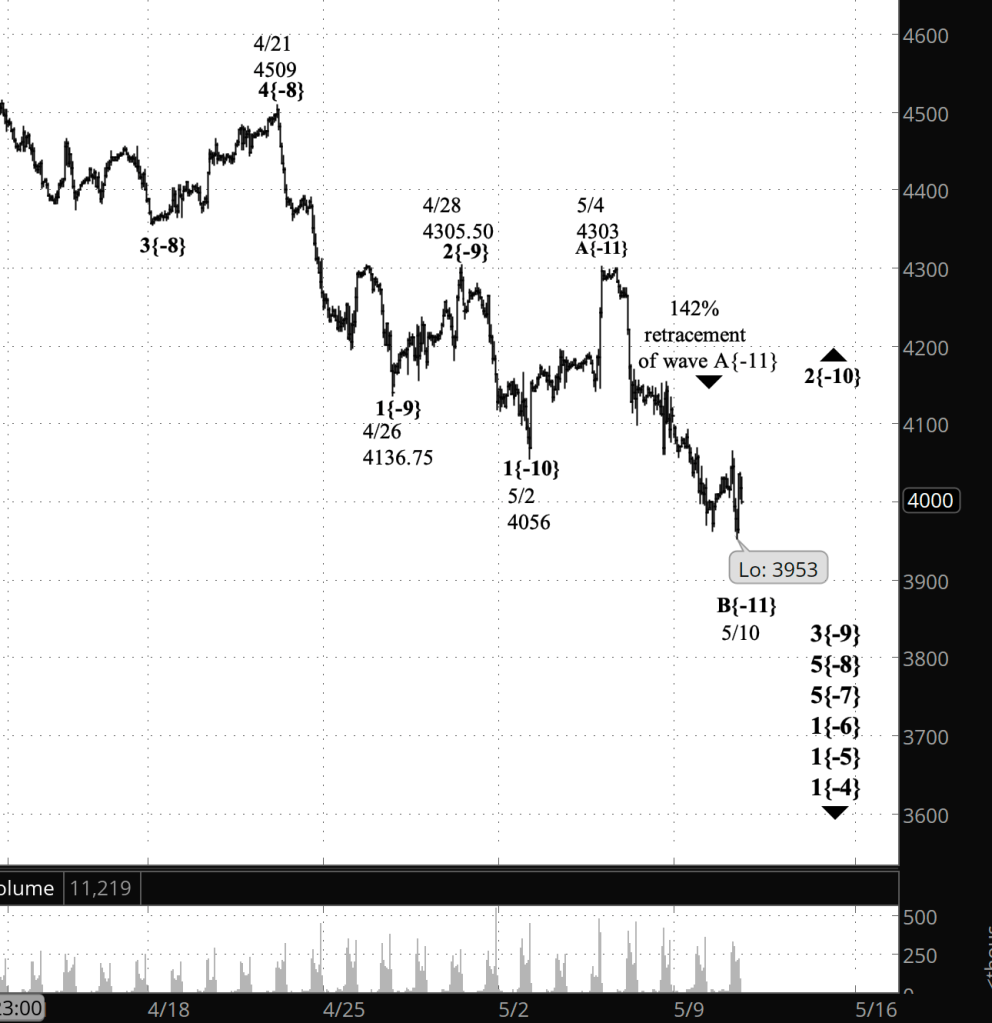
Half an hour before the closing bell. The S&P 500 edged down further during the session, in line with this morning’s alternative analysis, and then rose again. So this afternoon’s analysis is much like this morning’s, with a new low, so far, of 3953 for the session. That places wave B{-11} at a 142% retracement of the preceding A wave. I’ve revised this morning’s target calculation to fix a procedural error and this afternoon’s targets remain the same: 4303 to 4463.50.
2:55 p.m. New York time
SPG earnings play exit. I’ve exited my short bull put spread on SPG for 25.1% of maximum potential profit and have updated the trade analysis with results.
9:35 a.m. New York time
What’s happening now? The S&P 500 E-mini futures declined to 3961.75 in overnight trading and the reversed to the upside.
What does it mean? Tentatively, my principal analysis is that the middle wave of the upward correction that began on May 2 ended at the overnight low, and the final wave in a three-wave Flat corrective pattern has begun and likely will push its way back into the 4200s or 4300s.
What’s the alternative? Or not. If the price reversed and moves below the overnight low, then the middle wave is still underway.
[S&P 500 E-mini futures at 3:30 p.m., 50-minute bars, with volume]
What does Elliott wave theory say? Wave B{-11} within wave 2{-10} — an upward correction within the wave 3{-9} downtrend — ended overnight, and wave C{-11} has begun. The B waves 138% retracement of the preceding A wave strongly suggests that wave {-10} is taking the form of a Flat. In a Flat, wave B usually retraces 100% to 138% of the preceding A wave, so if my principal analysis stands, the chart is showing a classic B-wave retracement. The C wave can be expected to retrace 100% to 165% of the A wave, which is 247 points long. So under that guideline (not a firm rule), we can expect wave C{-11} to rise by between 247 and 407.50 points, a target zone ranging from to 4303 to 4463.50, more or less. (The targets have been revised from today’s first posting of Trader’s Notebook to fix a procedural problem.)
A Flat pattern for a 2nd wave is somewhat unusual. Most often, wave 2 will be a Zigzag and wave 4 will be Flat. A Zigzag wave B cannot move above the starting point of the preceding A wave — 4303 in this case. If the parent wave 2 is indeed taking a Flat form, then no such restriction exists.
The primary evidence for the form of the correction will come from the internal wave counts. In a Flat, the counts are three waves for A, three for B and five for C (3-3-5). For a Zigzag, the internal counts are 5-3-5. In this case, wave A{-11} is a bit messy but can be counted as having three waves, and wave B is also a bit unclear, but can also be seen as having three waves. The main problem is that the upward middle waves within both A and B and quite small; they aren’t proportional to the size of their downward siblings.
I chose to count the overnight low as the end of wave B{-11}, but the price could very well reverse quickly and move lower. And so the alternative analysis is that wave B{-11} is still underway, and a lower ending point would also lower the target range for wave C{-11}. At this point I give equal odds to both the principal and the alternative analyses.
We Are Here.
These are the waves currently in progress under my principal analysis. Each line on the list shows the wave number, with the subscript in curly brackets, the traditional degree name, the starting date, the starting price of the S&P 500 E-mini futures, and the direction of the wave.
Learning and other resources. Elliott wave analysis provides context, not prophecy. As the 20th century semanticist Alfred Korzybski put it in his book Science and Sanity (1933), “The map is not the territory … The only usefulness of a map depends on similarity of structure between the empirical world and the map.” And I would add, in the ever-changing markets, we can judge that similarity of structure only after the fact.
See the menu page Analytical Methods for a rundown on where to go for information on Elliott wave analysis.
By Tim Bovee, Portland, Oregon, May 10, 2022
Disclaimer
Tim Bovee, Private Trader tracks the analysis and trades of a private trader for his own accounts. Nothing in this blog constitutes a recommendation to buy or sell stocks, options or any other financial instrument. The only purpose of this blog is to provide education and entertainment.
No trader is ever 100 percent successful in his or her trades. Trading in the stock and option markets is risky and uncertain. Each trader must make trading decisions for his or her own account, and take responsibility for the consequences.
Update 5/10/2022: I exited my short bull put vertical spread on SPG, 38 days before expiration, for a $1.40 debit per contract/share, a profit before fees of $47 per contract. Shares were trading at $133.31, up $13.56 from the entry level.
The Implied Volatility Rank at exit was 68.2%, down 4.9 points from the entry level.
I exited on the day after entry because the position reached 25.1% of maximum potential profit, a bit above my normal 25% exit point for earnings plays.
Shares rose by 11.3% over one day for a +4,133% annual rate. The options position produced a 33.6% return for a +12,2545% annual rate.
I have entered a short bull put vertical spread on SPG, using options that trade for the last time 39 days hence, on June 17. The premium is a $1.87 credit per contract share and the stock at the time of entry was priced at $119.75.
The Implied Volatility Ratio stood at 73.1%.
Premium:
$1.87
Expire OTM
SPG-bull put spread
Strike
Odds
Delta
Calls/Puts
Long
115.00
67.0%
30
Break-even
121.87
58.0%
38.5
Short
120.00
49.0%
47
The premium is 74.8% of the width of the position’s short/long spread. The profit zone covers a 1.8% move to the downside and an unlimited move to the upside.
The risk/reward ratio is 1.7:1, with maximum risk of $313 and maximum reward of $187 per contract.
How I chose the trade. The trade was placed to coincide with SPG’s earnings announcement, after the closing bell on the day of entry. The expected move, based on options pricing, is $6.47 either way, for range of $117.23 to $123.79, and I placed the short strike within that range in order to get a better risk/reward ratio.
By Tim Bovee, Portland, Oregon, May 9, 2022
Disclaimer
Tim Bovee, Private Trader tracks the analysis and trades of a private trader for his own accounts. Nothing in this blog constitutes a recommendation to buy or sell stocks, options or any other financial instrument. The only purpose of this blog is to provide education and entertainment.
No trader is ever 100 percent successful in his or her trades. Trading in the stock and option markets is risky and uncertain. Each trader must make trading decisions for his or her own account, and take responsibility for the consequences.
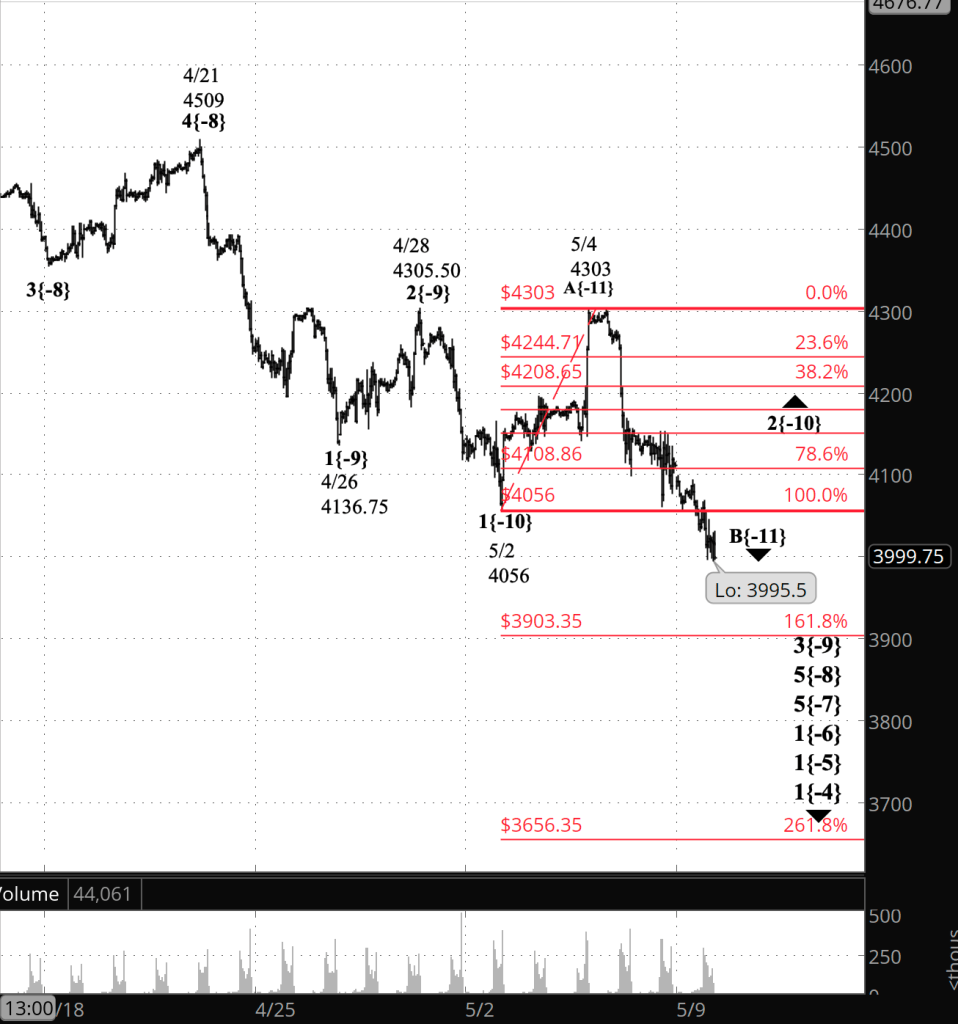
Half an hour before the closing bell. The S&P 500 has continued its decline throughout the trading session. So far wave B{-11} has retraced 124% of wave A{-11}, within the guidelines for a Flat pattern, which usually retraces 100% to 138%. I’ve updated the chart below, having added in a Fibonacci retracement grid.
1:05 p.m. New York time
SPG earnings play entry. I’ve opened a short bull put options spread on SPG, which announces earnings today after the closing bell, and have posted an analysis of the trade.
9:35 a.m. New York time
What’s happening now? The S&P 500 E-mini futures continued to fall after trading resumed overnight, reaching below the May 2 low to 4031 so far.
What does it mean? The falling middle segment of the upward correction that began on May 2 is still underway. It will be followed by a rising segment that will carry the price to around 4,300 or perhaps higher, likely ending the correction.
What’s the alternative? The chart can be interpreted as showing that the upward correction began on April 26, with the first segment ending on April 28, the middle segment on May 2 and the final segment on May 4. Under this scenario, the correction has ended and the downtrend that began on April 29 has begun.
[S&P 500 E-mini futures at 3:30 p.m., 50-minute bars, with volume]
What does Elliott wave theory say? Under my principal analysis, the decline that began on May 4 and that is still underway is wave B{-11} within wave 2{-9}, an upward correction that began on May 2. The B wave’s decline below 4056 , wave 2{-9}’s starting point, suggests that the 2nd wave is taking the form of a Flat rather than a Zigzag, the latter being a more common form for 2nd waves.
Under this scenario, wave C{-11} following the B wave will carry the price above the end of wave A{-11} at 4303. One difficulty in interpreting wave 2{-10} to be a Flat pattern is the lack of clarity in the A wave. In a Flat, that wave should have three waves internally. In a Zigzag, it will have five internal waves. If the pattern is a Flat, wave C{-11} can move above the start of wave 1{-10} under the rules of Elliott wave analysis. If it’s a Zigzag, then the 2nd wave can’t move above the 1st wave’s starting point and would force a re-analysis. Everything — everything! — depends upon how the rise from May 2 to May 4 is counted.
Under the alternative analysis, the upward correction is wave 2{-9} and began on April 26 from 4136.75. Wave A{-10} ended on April 28, wave B{-10} ended on May 2, and wave C{-10} ended on May 4. The present decline that followed is the first steps of wave 3{-9}, which will carry the price significantly lower.
All of this is happening within a series of downtrending waves of increasing degree: Wave 5{-8}, which began on April 21, within wave 5{-8}, which began on March 29, within wave 1{-6}, which began on January 4.
We Are Here.
These are the waves currently in progress under my principal analysis. Each line on the list shows the wave number, with the subscript in curly brackets, the traditional degree name, the starting date, the starting price of the S&P 500 E-mini futures, and the direction of the wave.
Learning and other resources. Elliott wave analysis provides context, not prophecy. As the 20th century semanticist Alfred Korzybski put it in his book Science and Sanity (1933), “The map is not the territory … The only usefulness of a map depends on similarity of structure between the empirical world and the map.” And I would add, in the ever-changing markets, we can judge that similarity of structure only after the fact.
See the menu page Analytical Methods for a rundown on where to go for information on Elliott wave analysis.
By Tim Bovee, Portland, Oregon, May 9, 2022
Disclaimer
Tim Bovee, Private Trader tracks the analysis and trades of a private trader for his own accounts. Nothing in this blog constitutes a recommendation to buy or sell stocks, options or any other financial instrument. The only purpose of this blog is to provide education and entertainment.
No trader is ever 100 percent successful in his or her trades. Trading in the stock and option markets is risky and uncertain. Each trader must make trading decisions for his or her own account, and take responsibility for the consequences.
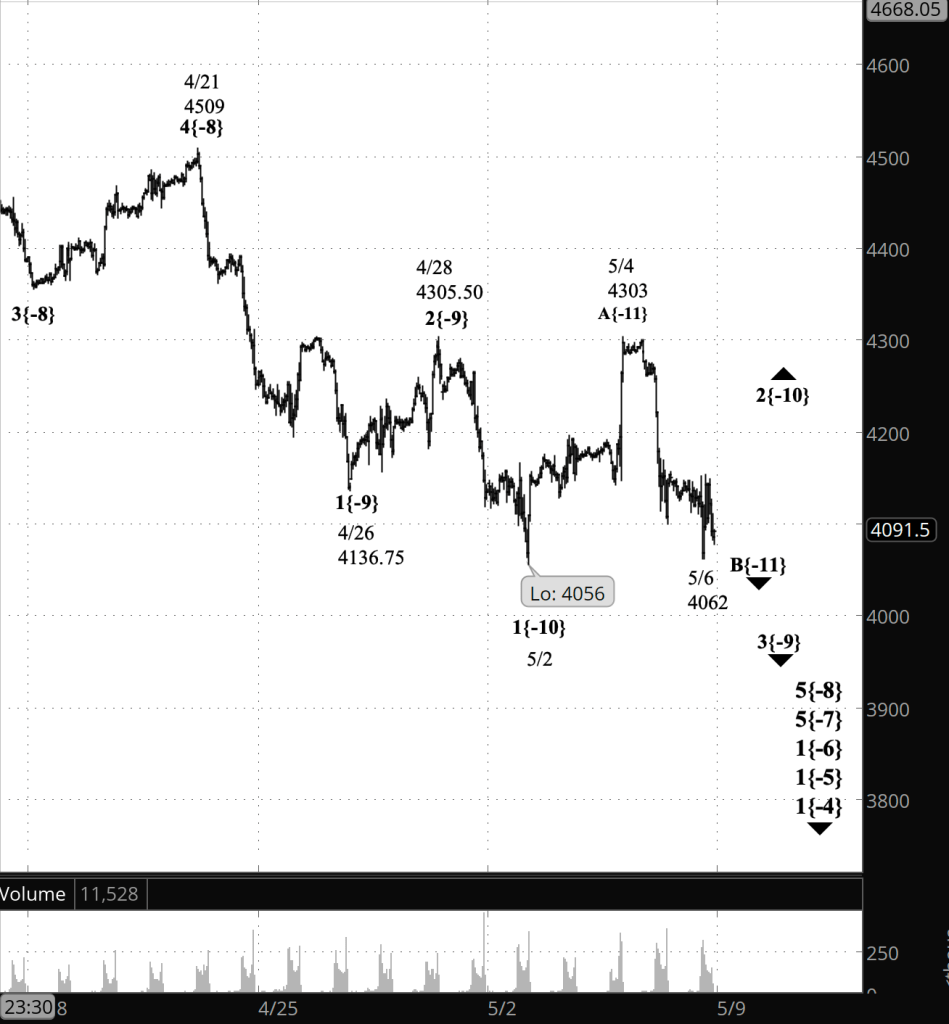
Half an hour before the closing bell. The S&P 500 declined during the session, reaching below the pre-session low. The second alternative from this morning has proven to be correct. The upward correction that began on May 2, wave 2{-10}, is still underway. Within it, wave B{-11} may still be underway, or it may have ended at the session low so far, 4062 on the futures — the wave pattern is somewhat ambiguous.
This morning’s chart somehow never made it in to the post, although it did show up on the Twitter update (@timbovee) and the Facebook update (@PrivateTrader). For this update, I’ve added in chart a showing the S&P 500 futures as of 3:30 p.m.
2 p.m. New York time
MGM earnings play exit. I’ve exited my short bull put vertical spread for 57.1% of maximum potential loss and have updated the trade analysis with results.
9:35 a.m. New York time
What’s happening now? The S&P 500 E-mini futures reached a low on Thursday of 4099.25, dawdled sideways for much of the night, and then rose as the opening bell approached.
What does it mean? Thursday’s low was the end of the middle wave of the upward correction that began on May 2.
What’s the alternative? It’s possible that the correction is of a larger scale that it first appeared to be.
It’s also possible the middle wave may not have ended.
[S&P 500 E-mini futures at 3:30 p.m., 45-minute bars, with volume]
What does Elliott wave theory say? The upward correction is wave 2{-10} within downtrending wave 3{-9}, which began on April 28. The sharp decline from Wednesday to Thursday was the middle wave, B{-11}, within the three-wave correction, and this morning’s rise is the first step within wave C{-11}. Under the rules of Elliott wave analysis, wave 2{-10} cannot exceed the end of the preceding 1st wave, meaning that the April 28 high, 4305.50, is an absolute ceiling for wave C{-11}.
Alternatively, wave 3{-9} ended on May 2 at 4056, the upward correction is wave 4{-9}, the decline that ended Thursday was the middle internal wave, B{-10}, and the present rise is wave C{-10}. Fourth waves, under the Elliott wave rules, can exceed the start of the preceding 1st wave, and so a price rise above 4305.50 will signal that this alternative count is correct.
Under the second alternative, wave C{-11} has not yet begun and wave B{-11} will dip still lower. This scenario will be confirmed if the price drops below 4099.25.
We Are Here.
These are the waves currently in progress under my principal analysis. Each line on the list shows the wave number, with the subscript in curly brackets, the traditional degree name, the starting date, the starting price of the S&P 500 E-mini futures, and the direction of the wave.
Learning and other resources. Elliott wave analysis provides context, not prophecy. As the 20th century semanticist Alfred Korzybski put it in his book Science and Sanity (1933), “The map is not the territory … The only usefulness of a map depends on similarity of structure between the empirical world and the map.” And I would add, in the ever-changing markets, we can judge that similarity of structure only after the fact.
See the menu page Analytical Methods for a rundown on where to go for information on Elliott wave analysis.
By Tim Bovee, Portland, Oregon, May 6, 2022
Disclaimer
Tim Bovee, Private Trader tracks the analysis and trades of a private trader for his own accounts. Nothing in this blog constitutes a recommendation to buy or sell stocks, options or any other financial instrument. The only purpose of this blog is to provide education and entertainment.
No trader is ever 100 percent successful in his or her trades. Trading in the stock and option markets is risky and uncertain. Each trader must make trading decisions for his or her own account, and take responsibility for the consequences.
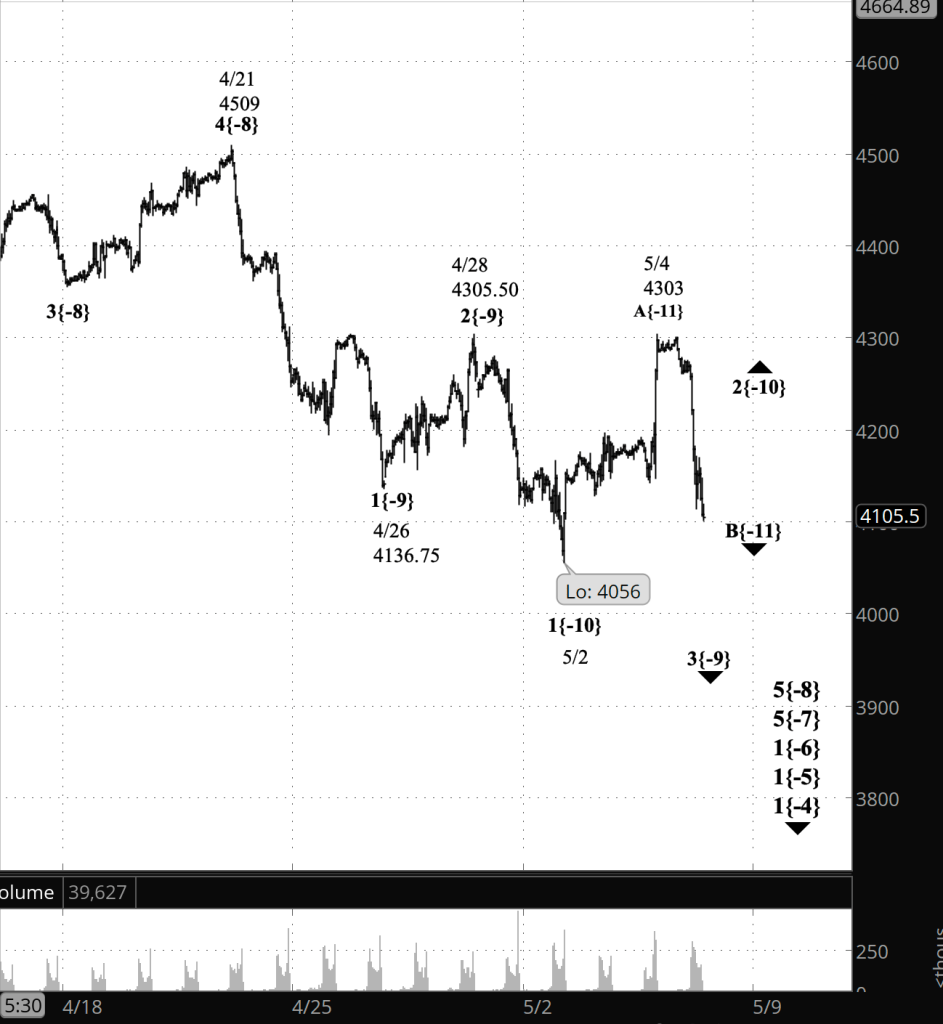
Half an hour before the closing bell. The S&P 500 declined sharply during the session, reaching below 4102, which is 201 points below Monday’s high of 4303. The price never exceeded Monday’s high, and so my principal analysis stands: Wave 2{-10}, an upward correction is underway and internally is in the second of three waves, Wave B{-11}. The B wave will be followed by a rising wave C{-11} that likely will reach above Monday’s high, which was the end of wave A{-11}. The rule I discussed this morning still stands. Wave 2{-10} and the C wave within must remain below 4305.50, the starting point of the preceding downtrending wave 1{-10}, which began on April 28. If it moves above that level, then the present wave count will be revised. I’ve updated the chart.
9:35 a.m. New York time
What’s happening now? The S&P 500 E-mini futures continued to rise in overnight trading, coming to within three points of the prior peak, 4305.50, attained on April 28.
What does it mean? The upward correction that began on May 2 continues.
What’s the alternative? Had the price moved above 4305.50, or if it does so today, then the present size designation of the upward correction would no longer match the chart and would require a reanalysis. For a detailed discussion, see the “Elliott wave theory” below.
[S&P 500 E-mini futures at 3:30 p.m., 45-minute bars, with volume]
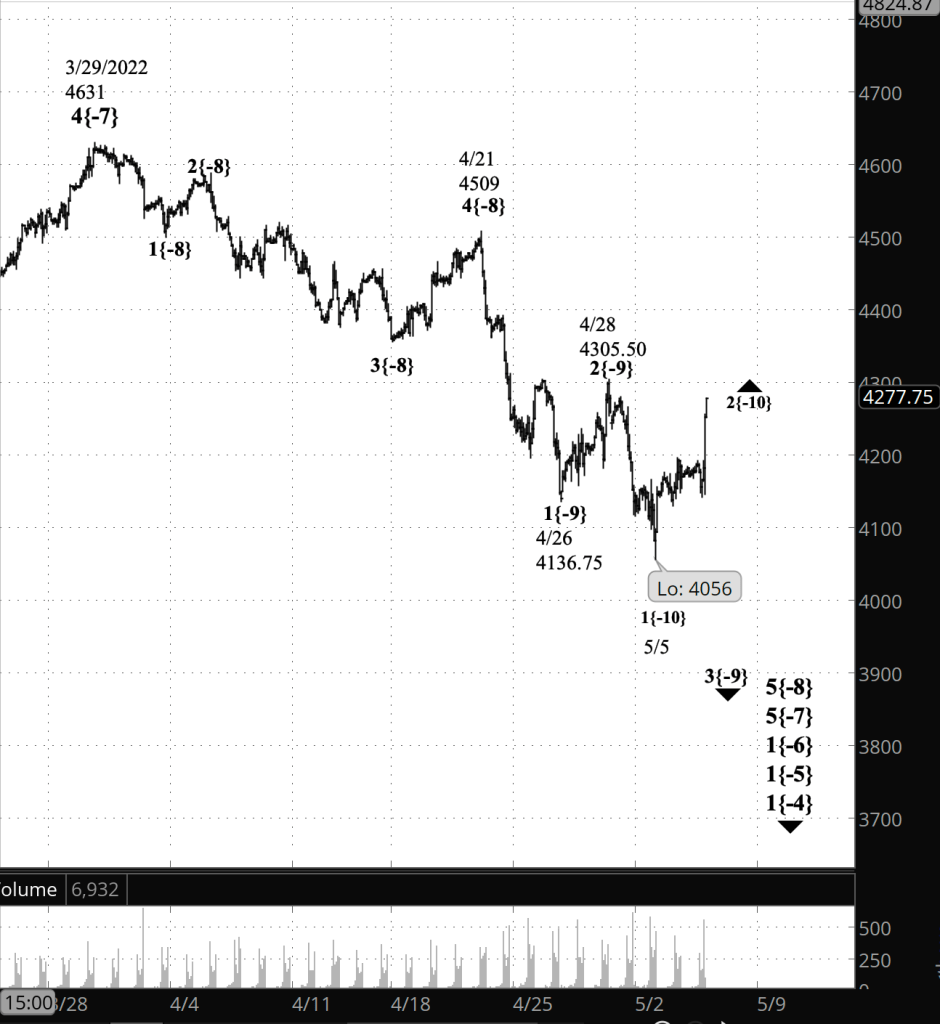
What does Elliott wave theory say? A larger downtrend, wave 5{-8}, began on April 21, and all that we’ve been tracking since has been within that wave. The question is, where do the subsequent wave fit in comparison with wave 5{-8}.
Under my principal analysis, I marked the chart as showing waves of increasingly smaller size. Wave 1{-9} within wave 5{-8} ended on April 26 and wave 2{-9} on April 28. But I labeled the next decline, beginning wave 3{-9}, as wave 1{-10}, the first subwave, which peaked at 4305.50. Under my analysis, the subsequent rise from 4056 on May 2 to 4303 on May 4 is wave 2{-10}, in the form of a subwave, A{-11}, which peaked at 4303.
And that’s a developing problem with the analysis. Second waves never move beyond the start of the preceding 1st wave. This 2nd wave, with its A wave, has come to within three points of that 1st wave starting point. Wave B can be expected to carry the price quite a distance downward. Wave C usually moves beyond the end of wave A. And the problem is, there’s not much space left for that move beyond — only 2-1/2 points. So it’s doable, but it’s inelegant.
If the price does break beyond 4305.50, then the analysis will no longer match the chart — the map will no longer match the territory — and so let’s look at a potential reanalysis.
The most likely, in my opinion, would take wave 1{-9}, which ended on May 2, and move it up a degree, relabeling it as the end of wave 1{-8}. The subsequent rise that ended on April 28, now labeled wave 2{-9}, would be wave A{-9} within wave 2{-8}. The decline that followed, ending on May 2, would be renumbered to B{-9} within 2{-8}. And the label on Wednesday’s rise would change from wave A{-11} to wave C{-9}, most likely the final subwave of the parent wave 2{-8}.
That’s the alternative analysis. In some ways it’s more elegant that the principal analysis. But elegance isn’t everything, and I’m not yet ready to promote this alternative to the top spot.
These are the waves currently in progress under my principal analysis. Each line on the list shows the wave number, with the subscript in curly brackets, the traditional degree name, the starting date, the starting price of the S&P 500 E-mini futures, and the direction of the wave.
Learning and other resources. Elliott wave analysis provides context, not prophecy. As the 20th century semanticist Alfred Korzybski put it in his book Science and Sanity (1933), “The map is not the territory … The only usefulness of a map depends on similarity of structure between the empirical world and the map.” And I would add, in the ever-changing markets, we can judge that similarity of structure only after the fact.
See the menu page Analytical Methods for a rundown on where to go for information on Elliott wave analysis.
By Tim Bovee, Portland, Oregon, May 5, 2022
Disclaimer
Tim Bovee, Private Trader tracks the analysis and trades of a private trader for his own accounts. Nothing in this blog constitutes a recommendation to buy or sell stocks, options or any other financial instrument. The only purpose of this blog is to provide education and entertainment.
No trader is ever 100 percent successful in his or her trades. Trading in the stock and option markets is risky and uncertain. Each trader must make trading decisions for his or her own account, and take responsibility for the consequences.
Half an hour before the closing bell. The S&P 500 rose swiftly after the Federal Open Market Committee announced it was raising the Federal Funds rate by half a percent. An upward correction, wave 2{-10}, continues. It is a subwave within downtrending wave 3{-9}. No change in the analysis. I’ve updated the chart.
3 p.m. New York time
SBUX earnings play exit. I’ve exited my short bear call vertical spread on SBUX for 87.5% of maximum potential loss and have posted an update of the trade analysis with results.
2:45 p.m. New York time
AMD earnings play exit. I’ve exited my short bear call vertical spread on AMD for a 53.6% of maximum potential loss and have posted an update of the trade analysis with results.
9:35 a.m. New York time
What’s happening now? The S&P 500 E-mini futures climbed slightly in overnight trading but remained below Tuesday’s high, 4195.75
What does it mean? The upward correction that began on May 5 continues, a subwave within a larger downtrend that began on April 28.
What’s the alternative? The correction may be one degree larger than I’ve labeled it. Under this scenario, the April 28 downtrend ended on May 5 and the subsequent rise is an upward correction within a larger downtrend that began on April 21.
[S&P 500 E-mini futures at 3:30 p.m., 85-minute bars, with volume]
What does Elliott wave theory say? Under my principal analysis, the rise that began on May 5 is wave 2{-10}, an upward correction within wave 3{-9}, which began on April 28.
Under my alternative analysis, the rise from May 5 is wave 4{-9}, an upward correction. Its predecessor, wave 3{-9}, ended on May 5.
Both the principal and the alternative are happening within wave 5{-8}, which began on April 21.
We Are Here.
These are the waves currently in progress under my principal analysis. Each line on the list shows the wave number, with the subscript in curly brackets, the traditional degree name, the starting date, the starting price of the S&P 500 E-mini futures, and the direction of the wave.
Learning and other resources. Elliott wave analysis provides context, not prophecy. As the 20th century semanticist Alfred Korzybski put it in his book Science and Sanity (1933), “The map is not the territory … The only usefulness of a map depends on similarity of structure between the empirical world and the map.” And I would add, in the ever-changing markets, we can judge that similarity of structure only after the fact.
See the menu page Analytical Methods for a rundown on where to go for information on Elliott wave analysis.
By Tim Bovee, Portland, Oregon, May 5, 2022
Disclaimer
Tim Bovee, Private Trader tracks the analysis and trades of a private trader for his own accounts. Nothing in this blog constitutes a recommendation to buy or sell stocks, options or any other financial instrument. The only purpose of this blog is to provide education and entertainment.
No trader is ever 100 percent successful in his or her trades. Trading in the stock and option markets is risky and uncertain. Each trader must make trading decisions for his or her own account, and take responsibility for the consequences.
Update 5/4/2022: I exited my short bear call vertical spread on AMD, 44 days before expiration, for a $1.95 debit per contract/share, a loss before fees of $53 per contract. Shares were trading at $97.92, up $7.86 from the entry level.
The Implied Volatility Rank at exit was 66.1%, down 16.8 points from the entry level.
I exited on the day after entry, for 53.6% of maximum potential loss, because the position moved opposite the direction of my trade and I judged a fast exit to be the best way of limiting my loss.
Shares rose by 8.7% over one day for a +3,186% annual rate. The options position produced a 27.2% loss for a -9,921% annual rate.
I have entered a short bear call vertical spread on AMD, using options that trade for the last time 45 days hence, on June 17. The premium is a $1.42 credit per contract share and the stock at the time of entry was priced at $90.06.
The Implied Volatility Ratio stood at 82.9%.
Premium:
$1.42
Expire OTM
AMD-bear call spread
Strike
Odds
Delta
Calls
Long
105.00
77.0%
30
Break-even
101.42
73.5%
34
Short
100.00
70.0%
38
The premium is 56.8% of the width of the position’s short/long spread. The profit zone covers a 12.6% move to the upside and an unlimited move to the downside.
The risk/reward ratio is 2.5:1, with maximum risk of $358 and maximum reward of $142 per contract.
How I chose the trade. The trade was placed to coincide with AMD’s earnings announcement, after the closing bell on the day of entry. The short strikes were set to coincide with the expected move of $7.34 either way, based on options pricing, which gives a price range of $82.73 to $97.40.
By Tim Bovee, Portland, Oregon, May 3, 2022
Disclaimer
Tim Bovee, Private Trader tracks the analysis and trades of a private trader for his own accounts. Nothing in this blog constitutes a recommendation to buy or sell stocks, options or any other financial instrument. The only purpose of this blog is to provide education and entertainment.
No trader is ever 100 percent successful in his or her trades. Trading in the stock and option markets is risky and uncertain. Each trader must make trading decisions for his or her own account, and take responsibility for the consequences.
Update 5/4/2022: I exited my short bear call vertical spread on SBUX, 44 days before expiration, for a $2.80 debit per contract/share, a loss before fees of $100 per contract. Shares were trading at $78.37, $0.30 from the entry level.
The Implied Volatility Rank at exit was 62.6%, down 29.5 points from the entry level.
I exited on the day after entry, for 87.5% of maximum potential loss, because the stock moved against the direction of the trade and I judged that exiting early would avoid even greater losses.
Shares fell by 0.4% over one day for a 139.2% annual rate. The options position produced a 35.7% loss for a -13,036% annual rate.
I have entered a short bear call vertical spread on SBUX, using options that trade for the last time 45 days hence, on June 17. The premium is a $1.80 credit per contract share and the stock at the time of entry was priced at $73.87.
The Implied Volatility Ratio stood at 92.1%.
Premium:
$1.80
Expire OTM
SBUX-bear call spread
Strike
Odds
Delta
Calls
Long
80.00
77.0%
27
Break-even
76.80
67.5%
37
Short
75.00
58.0%
47
The premium is 72% of the width of the position’s short/long spread. The profit zone covers a 4% move to the upside and an unlimited move to the downside.
The risk/reward ratio is 1.8:1, with maximum risk of $180 and maximum reward of $320 per contract.
How I chose the trade. The trade was placed to coincide with SBUX’s earnings announcement, after the closing bell on the day of entry. The short strikes were set to coincide with the expected move of $3.63 either way, based on options pricing, which gives a price range of $70.24 to $77.50.
By Tim Bovee, Portland, Oregon, May 3, 2022
Disclaimer
Tim Bovee, Private Trader tracks the analysis and trades of a private trader for his own accounts. Nothing in this blog constitutes a recommendation to buy or sell stocks, options or any other financial instrument. The only purpose of this blog is to provide education and entertainment.
No trader is ever 100 percent successful in his or her trades. Trading in the stock and option markets is risky and uncertain. Each trader must make trading decisions for his or her own account, and take responsibility for the consequences.



You must be logged in to post a comment.