Update 4/19/2022: I exited my short iron condor on WBA 31 days before expiration, for a $1.10 debit per contract/share, a profit before fees of $0.04 per contract. Shares were trading at $45.03, down $2.76 from the entry level.
The Implied Volatility Rank at exit was 24.6%, down 25 points from the entry level.
I exited because the position became immediately unprofitable after earnings were published and shares declined below the profit zone. Rather than retain the position in the hope of profitability, I exited for a minimum profit, freeing up the funds for other trades.
Shares declined by 5.8% over 20 days for a -105% annual rate. The options position produced a 3.6% return for a +66% annual rate.
I have entered a short iron condor on WBA, using options that trade for the last time 51 days hence, on May 20. The premium is a $1.14 credit per contract share and the stock at the time of entry was priced at $47.79.
The Implied Volatility Ratio stood at 49.6%.
Premium:
$1.14
Expire OTM
WBA-iron condor
Strike
Odds
Delta
Calls
Long
52.50
85.0%
19
Break-even
51.14
77.5%
27
Short
50.00
70.0%
35
Puts
Short
45.00
65.0%
29
Break-even
43.64
71.5%
23
Long
42.50
78.0%
17
The premium is 45.6% of the width of the position’s short/long spreads on both the calls and the puts. The profit zone covers a 9.5% move to the downside and a 7.0% move to the upside, for a total 16.5% profit range.
The risk/reward ratio is 1.2:1, with maximum risk of $136 and maximum reward of $114 per contract.
How I chose the trade. The trade was placed to coincide with WBA’s earnings announcement, before the openng bell on the day after entry. The short strikes were set to coincide with the expected move of $1.97 either way, based on options pricing adjusted for expiration two days away, which gives a price range of $45.79 to $49.73.
By Tim Bovee, Portland, Oregon, March 30, 2022
Disclaimer
Tim Bovee, Private Trader tracks the analysis and trades of a private trader for his own accounts. Nothing in this blog constitutes a recommendation to buy or sell stocks, options or any other financial instrument. The only purpose of this blog is to provide education and entertainment.
No trader is ever 100 percent successful in his or her trades. Trading in the stock and option markets is risky and uncertain. Each trader must make trading decisions for his or her own account, and take responsibility for the consequences.
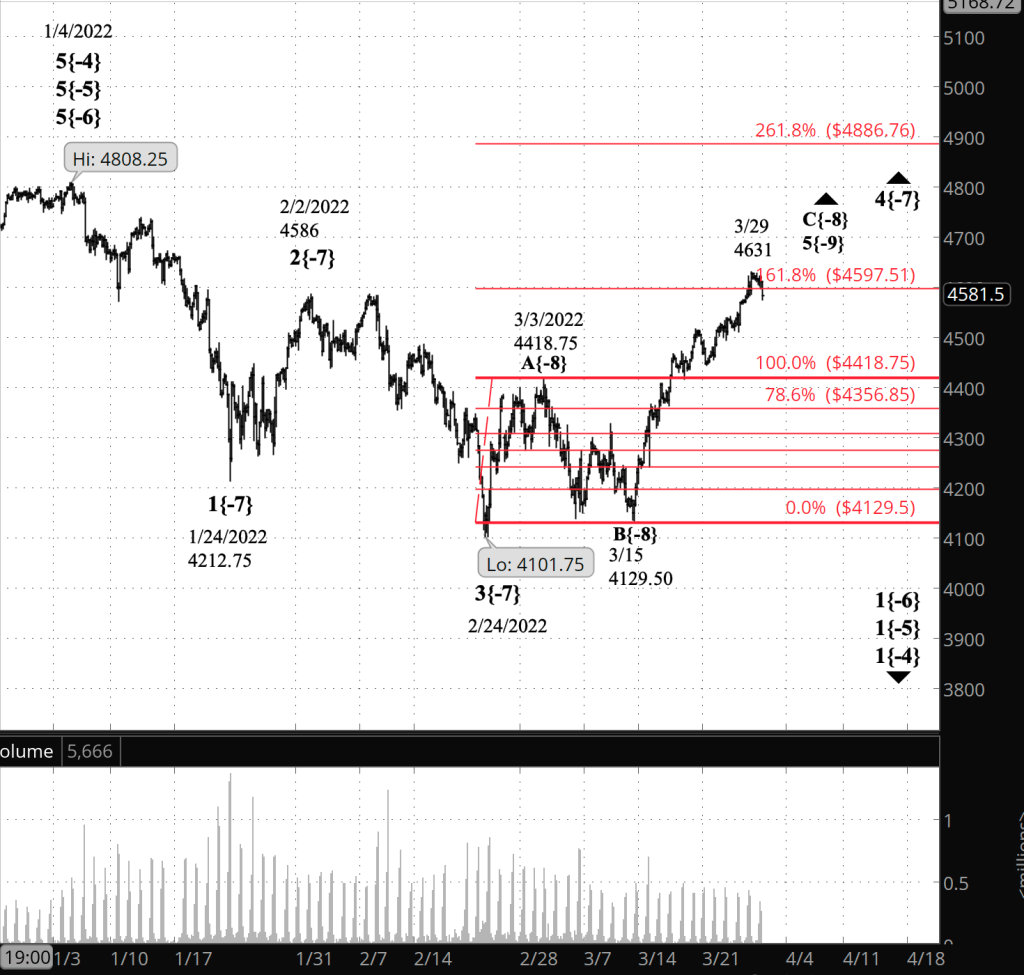
Half an hour before the closing bell. The S&P 500 stayed below the March 29 high, 4631 on the futures, during the trading session, and in the afternoon dropped below the 161.8% Fibonacci retracement level of the preceding downward movement that began on March 3. The upward movement from March 15 is wave C{-8} within wave 4{-7}. The C-wave retracement is of the prior B-wave downward movement. No change in the analysis. I’ve updated the chart below.
11:30 a.m. New York time
WBA earnings play entry. I’ve entered a short iron condor position on WBA, timed to coincide with tomorrow’s earnings announcement, using options that expire on May 20, and have posted an analysis of the trade.
11:10 a.m. New York time
PVH earnings play exit. I’ve exited my short bear call options spread on PVH for 30% of maximum potential profit and have updated the analysis with full results.
10:55 a.m. New York time
MU earnings play exit. I’ve exited my short bull put options spread on MU for 45% of maximum potential profit and have updated the analysis with full results.
9:35 a.m. New York time
What’s happening now? The S&P 500 E-mini futures remained below Tuesday’s high, 4631, in overnight trading, tracing a sideways path.
What does it mean? The upward correction that began on February 24 continues. It is most likely nearing an end and when complete, will be followed by a resumption of the downtrend that began on January 4, which will carry the price down toward the 4100 level and possibly below.
What are the alternatives? The two alternatives describe two possibilities: The correction has already ended, and the correction is forming a complex pattern that will delay its end.
[S&P 500 E-mini futures at 3:30 p.m., 180-minute bars, with volume]
What does Elliott wave theory say? The upward correction is wave 4{-7}, which began on February 24 from 4101.75, within wave 1{-6}, which began on January 4 from 4808.25. Wave 4{-7} is internally in its final wave, C{-8}, which has retraced the proceeding B wave by a Fibonacci 161.8%, indicating a Flat pattern.
Principal analysis: Wave 4{-7} has a bit more upside remaining, but it has fulfilled the requirements of Elliott wave analysis for 4th waves and could end at any time.
Alternative #1: Wave 4{-7} ended on March 29 at 4631 and the downtrend has resumed, wave 5{-7}. Fifth waves sometimes come up short, but most move beyond the end of the preceding 3rd wave, 4101.75 in this case.
Alternative #2: Most 4th waves end after three internal waves, with wave C{-8} in this instance. Sometimes, however, they form a compound structure, connecting two or the three-wave patterns. The correcting wave, moving downward in this case, would be wave X{-8} and would be followed by three more waves in a second corrective pattern. As in the other possibilities, once the correction in complete, the downtrend will resume as wave 5{-7}.
We Are Here.
These are the waves currently in progress under my principal analysis. Each line on the list shows the wave number, with the subscript in curly brackets, the traditional degree name, the starting date, the starting price of the S&P 500 E-mini futures, and the direction of the wave.
Learning and other resources. Elliott wave analysis provides context, not prophecy. As the 20th century semanticist Alfred Korzybski put it in his book Science and Sanity (1933), “The map is not the territory … The only usefulness of a map depends on similarity of structure between the empirical world and the map.” And I would add, in the ever-changing markets, we can judge that similarity of structure only after the fact.
See the menu page Analytical Methods for a rundown on where to go for information on Elliott wave analysis.
By Tim Bovee, Portland, Oregon, March 30, 2022
Disclaimer
Tim Bovee, Private Trader tracks the analysis and trades of a private trader for his own accounts. Nothing in this blog constitutes a recommendation to buy or sell stocks, options or any other financial instrument. The only purpose of this blog is to provide education and entertainment.
No trader is ever 100 percent successful in his or her trades. Trading in the stock and option markets is risky and uncertain. Each trader must make trading decisions for his or her own account, and take responsibility for the consequences.
Update 3/30/2022: I exited my bull put vertical options spread on MU, 51 days before expiration, for a $0.88 debit per contract/share, a profit before fees of $62 per contract. Shares were trading at $84.96, up $4.66 from the entry level.
The Implied Volatility Rank at exit was 40.4, down 23.9 points from the entry level.
I exited at 45.3% of maximum potential profit, well above my normal exit point of 25% of max for earnings plays.
Shares rose by 5.8% over one day for a +2,118% annual rate. The options position produced a 70.5% return for a +25,716% annual rate.
I have entered a short bull put options spread on MU, using options that trade for the last time 52 days hence, on May 20. The premium is a $1.50 credit per contract share and the stock at the time of entry was priced at $80.30.
The Implied Volatility Ratio stood at 64.3%.
Premium:
$1.50
Expire OTM
MU-bull put spread
Strike
Odds
Delta
Puts
Long
70.00
71.0%
23
Break-even
76.50
65.0%
28.5
Short
75.00
59.0%
34
The premium is 60% of the width of the position’s short/long spread. The profit zone covers a 4.7% move to the downside and an unlimited move to the upside.
The risk/reward ratio is 2.3:1, with maximum risk of $150 and maximum reward of $350 per contract.
How I chose the trade. The trade was placed to coincide with MU’s earnings announcement, after the closing bell on the day of entry. The short strikes were set to coincide with the expected move of $6.23 either way, based on options pricing adjusted for time prior to expiration, which gives a price range of $74.72 to $85.94.
By Tim Bovee, Portland, Oregon, March 29, 2022
Disclaimer
Tim Bovee, Private Trader tracks the analysis and trades of a private trader for his own accounts. Nothing in this blog constitutes a recommendation to buy or sell stocks, options or any other financial instrument. The only purpose of this blog is to provide education and entertainment.
No trader is ever 100 percent successful in his or her trades. Trading in the stock and option markets is risky and uncertain. Each trader must make trading decisions for his or her own account, and take responsibility for the consequences.
Update 3/30/2022: I exited my bear call vertical options spread on PVH, 51 days before expiration, for a $0.63 debit per contract/share, a profit before fees of $117 per contract. Shares were trading at $86.01, down $1.71 from the entry level.
The Implied Volatility Rank at exit was 20.4%, down 19.7 points from the entry level.
I exited because the position reached 30% of maximum potential profit, above my normal 25% exit point for earnings plays.
Shares declined by 1.9% over one day for a -712% annual rate. The options position produced a 185.7% return for a +67,786% annual rate.
I have entered a short bear call options spread on PVH, using options that trade for the last time 52 days hence, on May 20. The premium is a $0.90 credit per contract share and the stock at the time of entry was priced at $87.72.
The Implied Volatility Ratio stood at 40.1%.
Premium:
$0.90
Expire OTM
PVH-bear call spread
Strike
Odds
Delta
Calls
Long
105.00
87.0%
18
Break-even
100.90
83.5%
21.5
Short
100.00
80.0%
25
The premium is 36% of the width of the position’s short/long spread. The profit zone covers a 15% move to the upside and an unlimited move to the downside.
The risk/reward ratio is 4.6:1, with maximum risk of $410 and maximum reward of $90 per contract.
How I chose the trade. The trade was placed to coincide with PVH’s earnings announcement, after the closing bell on the day of entry. The short strikes were set to coincide with the expected move of $2.60 either way, based on options pricing, which gives a price range of $85.55 to $90.75, adjusted for time to expiration. The options used for estimating the spread were 16 days away from expiration, and so to account for the uncertainty, in the trade I used an unadjusted range, $77.76 to $98.54, providing a greater chance of success in return for a higher risk/reward ratio.
By Tim Bovee, Portland, Oregon, March 29, 2022
Disclaimer
Tim Bovee, Private Trader tracks the analysis and trades of a private trader for his own accounts. Nothing in this blog constitutes a recommendation to buy or sell stocks, options or any other financial instrument. The only purpose of this blog is to provide education and entertainment.
No trader is ever 100 percent successful in his or her trades. Trading in the stock and option markets is risky and uncertain. Each trader must make trading decisions for his or her own account, and take responsibility for the consequences.
Half an hour before the closing bell. The S&P 500 moved slightly higher during the trading sessions, so far reaching 4626 on the futures, 4631.92 on the index. No change in the analysis. I’ve updated the chart.
1:05 p.m. New York time
MU earnings play entry. I’ve entered a short bull put spread on MU, using options expiring on May 20, and have posted an analysis of the trade.
10:45 a.m. New York time
PVH earnings play entry. I’ve entered a short bear call spread on PVH, using options expiring on May 20, and have posted an analysis of the trade.
9:40 a.m. New York time
What’s happening now? The S&P 500 E-mini futures continued to rise in overnight trading, reaching a high so far of 4623.
What does it mean? The upward correction that began on February 24 continues.
What are the alternatives? There are two, unchanged from yesterday
Alternative #1: The correction has met all of the requirements set out by Elliott wave theory, and so any peak, including today’s, could be the end of the correction. The end of the correction will be followed by a significant decline as the downtrend that began on January 4 resumes.
Alternative #2: The present corrective pattern could be followed by a second corrective pattern and possibly a third. In such a compound correction, the first pattern is followed by a connecting wave — a decline in this case — and if the correction extends to three waves, the second wave is also followed by a downward connecting wave. When complete, the downtrend from January 4 will resume.
[S&P 500 E-mini futures at 3:30 p.m., 180-minute bars, with volume]
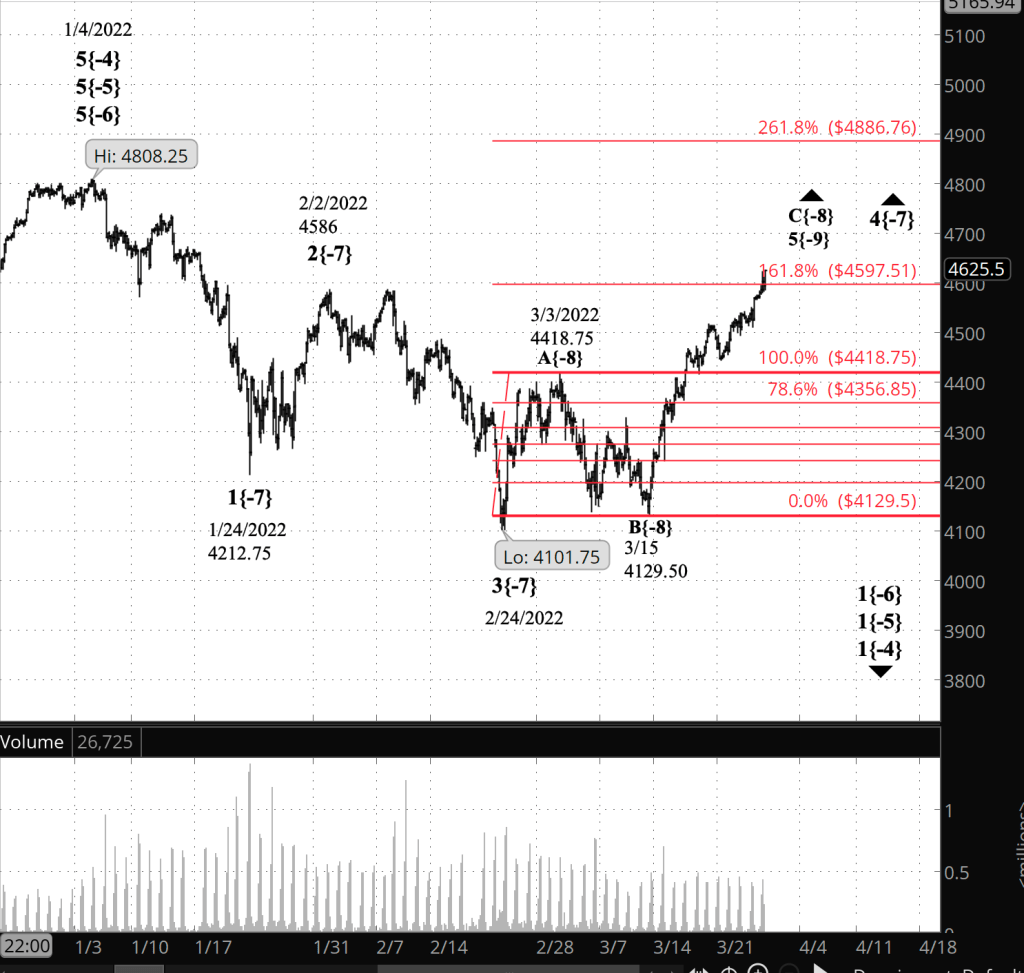
What does Elliott wave theory say? The question with the upward correction, wave 4{-7}, at this point is boundaries. The wave’s overnight high retraced 100% of the preceding wave 3{-7} — the 4586 mark.
There is an Elliott wave guideline that governs how far wave 4{-7} can go. If the parent structure is a Flat, which this 4th wave appears to be, then the C wave within the 4th wave will typically retrace 100% and 165% of wave A. The retracement so far is a Fibonacci level, 161.8%, so this C wave is well within the guidelines. I’ve placed the Fibonacci grid on the chart to show the wave C{-8} retracement of wave B{-8}.
Wave C{-8} has moved beyond the maximum retracement according to the guideline. But since it’s a guideline and not a rule, it won’t break the Elliott wave model if it goes still higher.
We Are Here.
These are the waves currently in progress under my principal analysis. Each line on the list shows the wave number, with the subscript in curly brackets, the traditional degree name, the starting date, the starting price of the S&P 500 E-mini futures, and the direction of the wave.
Learning and other resources. Elliott wave analysis provides context, not prophecy. As the 20th century semanticist Alfred Korzybski put it in his book Science and Sanity (1933), “The map is not the territory … The only usefulness of a map depends on similarity of structure between the empirical world and the map.” And I would add, in the ever-changing markets, we can judge that similarity of structure only after the fact.
See the menu page Analytical Methods for a rundown on where to go for information on Elliott wave analysis.
By Tim Bovee, Portland, Oregon, March 29, 2022
Disclaimer
Tim Bovee, Private Trader tracks the analysis and trades of a private trader for his own accounts. Nothing in this blog constitutes a recommendation to buy or sell stocks, options or any other financial instrument. The only purpose of this blog is to provide education and entertainment.
No trader is ever 100 percent successful in his or her trades. Trading in the stock and option markets is risky and uncertain. Each trader must make trading decisions for his or her own account, and take responsibility for the consequences.
Update 3/31/2022: I exited my short bull put vertical options spread on MKC, 50 days before expiration, for a $1.09 debit per contract/share, a profit before fees of $36 per contract. Shares were trading at $97.10, down $0.12 from the entry level.
The Implied Volatility Rank at exit was 25.8, down 25.3 points from the entry level.
I exited because the position reached 25% of maximum potential profit, my normal exit point for earnings plays.
Shares declined by 0.1% over three days for a -15% annual rate. The options position produced a 33.0% return for a +4,018% annual rate.
I have entered a short bull put options spread on MKC, using options that trade for the last time 53 days hence, on May 20. The premium is a $1.45 credit per contract share and the stock at the time of entry was priced at $97.22.
The Implied Volatility Ratio stood at 51.1%.
Premium:
$1.45
Expire OTM
MKC-bull put spread
Strike
Odds
Delta
Calls/Puts
Long
90.00
78.0%
20
Break-even
96.45
68.0%
28.5
Short
95.00
58.0%
37
The premium is 58% of the width of the position’s short/long spread. The profit zone is fairly constrained on the downside, covering a 0.8% move in that direction, and covers an unlimited move to the upside.
The risk/reward ratio is 2.4:1, with maximum risk of $355 and maximum reward of $145 per contract.
How I chose the trade. The trade was placed to coincide with MKC’s earnings announcement, before the opening bell on the day after entry. The short strikes were set to coincide with the expected move of $0.81 either way, based on options pricing, which gives a price range of $96.41 to $98.03, with adjustments for the options being 17 days out before expiration. An unadjusted expectation gives a range of $93.17 to $101.27
By Tim Bovee, Portland, Oregon, March 28, 2022
Disclaimer
Tim Bovee, Private Trader tracks the analysis and trades of a private trader for his own accounts. Nothing in this blog constitutes a recommendation to buy or sell stocks, options or any other financial instrument. The only purpose of this blog is to provide education and entertainment.
No trader is ever 100 percent successful in his or her trades. Trading in the stock and option markets is risky and uncertain. Each trader must make trading decisions for his or her own account, and take responsibility for the consequences.
Half an hour before the closing bell. The S&P 500 rose during the trading session, reaching 4555.75, slightly above the the overnight low. No change in the analysis. I’ve updated the chart below.
11:20 a.m. New York time
MKC earnings play entry. I’ve entered a short bull put options spread on MKC and have posted an analysis of the trade.
9:35 a.m. New York time
What’s happening now? The S&P 500 E-mini futures continued to rise after trading resumed overnight, reaching a high so far today of 4548.50.
What does it mean? The upward correction that began on February 24 continues and is in its final phase, both at its top degree and at least two degrees smaller. Bottom line: It will be over soon.
What are the alternatives? There are two:
Alternative #1: The correction has met all of the requirements set out by Elliott wave theory, and so any peak, including today’s, could be the end of the correction. The end of the correction will be followed by a significant decline as the downtrend that began on January 4 resumes. Bottom line: It’s over.
Alternative #2: The present corrective pattern could be followed by a second corrective pattern and possibly a third. In such a compound correction, the first pattern is followed by a connecting wave — a decline in this case — and if the correction extends to three waves, the second wave is also followed by a downward connecting wave. When complete, the downtrendd from January 4 will resume. Bottom line: It’s not going to be over as quickly as we expected.
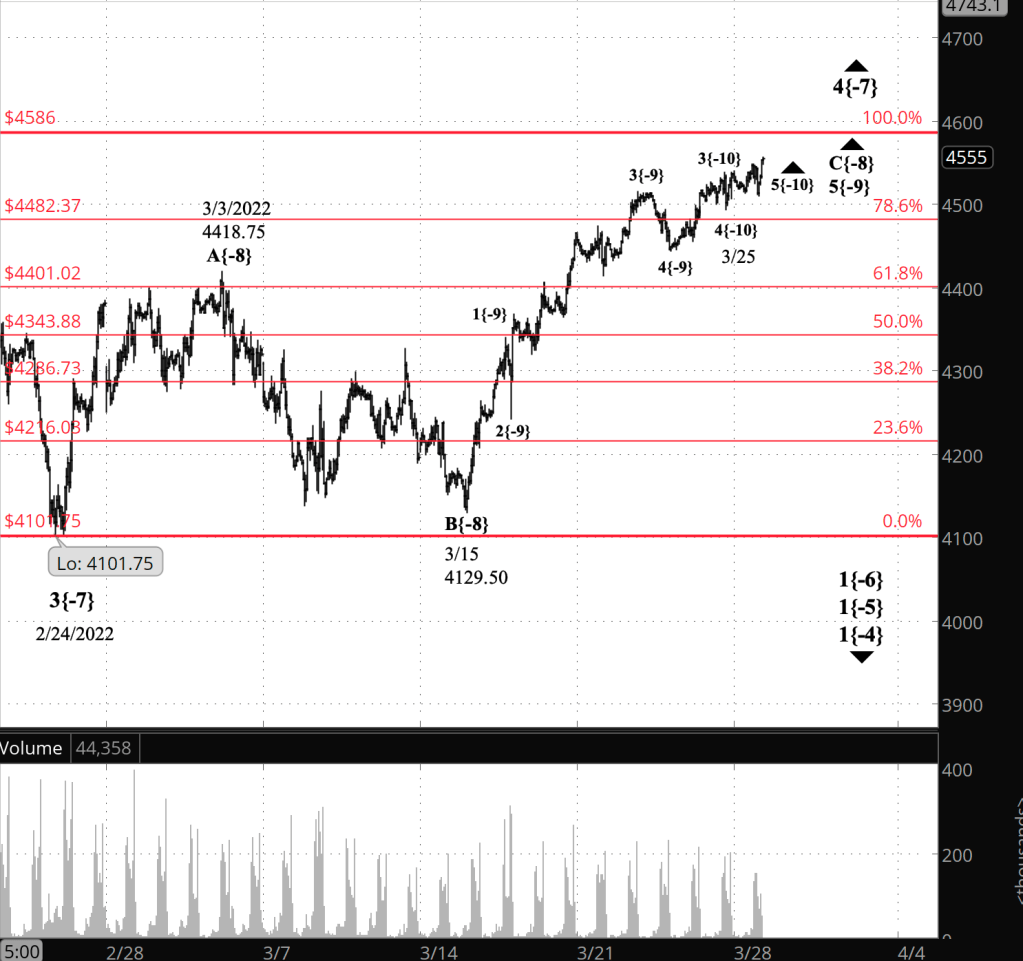
Chart. For today’s chart, I’ve moved in closer to focus on the upward correction, with the goal of seeing more clearly how far advanced it is.
[S&P 500 E-mini futures at 3:30 p.m., hourly bars, with volume]
What does Elliott wave theory say? Under my principal analysis, wave 4{-7}, the upward correction that began on February 24, is underway. Internally, it is in its final wave, C{-8}, if it is structured as a simple correction. C waves in both Flats and Zigzags have five waves internally, and in this case, rising wave 5{-9} is underway, having begun on March 25.
Wave 4{-7} is constrained in that it cannot move above 4808.25, the starting point of wave 1{-7} on January 4.
When wave 4{-7} is complete, it will be followed by wave 5{-7}, a resumption of the downtrend that began on January 4 that will most likely carry the price below 4101.75, the wave 4{-7} starting point, perhaps significantly lower.
Under Alternative #1, the overnight high, 4548.50, is the end of wave 4{-7} and its internal waves. The subsequent decline is the small beginning of what will turn out to be a significant wave 5{-7} decline to 4101.75 and lower.
Under Alternative #2, the end of the present wave C{-8} will be followed by downward wave X{-8}, a connecting wave that will in turn be followed by a second corrective pattern in a compound correction. Such compound structures can have up to three corrective patterns, each separated from the prior pattern by an X wave. When the final pattern is complete, the downtrend will resume as wave 5{-7}.
We Are Here.
These are the waves currently in progress under my principal analysis. Each line on the list shows the wave number, with the subscript in curly brackets, the traditional degree name, the starting date, the starting price of the S&P 500 E-mini futures, and the direction of the wave.
Learning and other resources. Elliott wave analysis provides context, not prophecy. As the 20th century semanticist Alfred Korzybski put it in his book Science and Sanity (1933), “The map is not the territory … The only usefulness of a map depends on similarity of structure between the empirical world and the map.” And I would add, in the ever-changing markets, we can judge that similarity of structure only after the fact.
See the menu page Analytical Methods for a rundown on where to go for information on Elliott wave analysis.
By Tim Bovee, Portland, Oregon, March 28, 2022
Disclaimer
Tim Bovee, Private Trader tracks the analysis and trades of a private trader for his own accounts. Nothing in this blog constitutes a recommendation to buy or sell stocks, options or any other financial instrument. The only purpose of this blog is to provide education and entertainment.
No trader is ever 100 percent successful in his or her trades. Trading in the stock and option markets is risky and uncertain. Each trader must make trading decisions for his or her own account, and take responsibility for the consequences.
Half an hour before the closing bell. The S&P 500 peaked early in the session, at 4539 on the futures, 4546.03 on the index and then dropped sharply within the next 45 minutes, on average shaving off a point each minute. It’s very low level so far, but the sharp decline feels like the opening move of a reversal.
However, given the small degree, that’s not yet enough to support changing the analysis, although it does give added credibility to the first alternative analysis from this morning.
So, either the upward correction, wave 4{-7}, is still underway, or the downtrend resumed, as wave 5{-8} began from 4539 on the futures. There is no way to choose between those two alternatives, at this point. The further the drop, the more likely it is wave wave 5{-7} has begun. A technical problem that kept me from updating the chart has been resolved, and the chart has been updated.
9:35 a.m. New York time
What’s happening now? The S&P 500 E-mini futures continued to rise overnight, reaching a high of 4531.75, which beats the March 22 high by nearly 20 points.
What does it mean? The analysis and the alternatives are a replay of yesterday’s. The upward correction that began on February 24 continues.
What’s the alternative? There are two:
Alternative #1: The overnight high, 4531.75, is the end of the upward correction, and the downtrend that began on January 4 from 4808.25 has resumed and likely will fall below the starting point of the correction, 4101.75.
Alternative #2: The correction is forming a compound structure containing two or three corrective patterns. When the first pattern, now underway, reaches its end, then the price will decline in a connecting movement that will be followed by a second corrective pattern. The connecting movement will end above the starting point of the correction, 4101.75.
Alternative #1 — the correction has ended — has the same likelihood as the principal analysis. Alternative #2 — a compound correction — while not uncommon, is less common than the principal analysis or the first alternative.
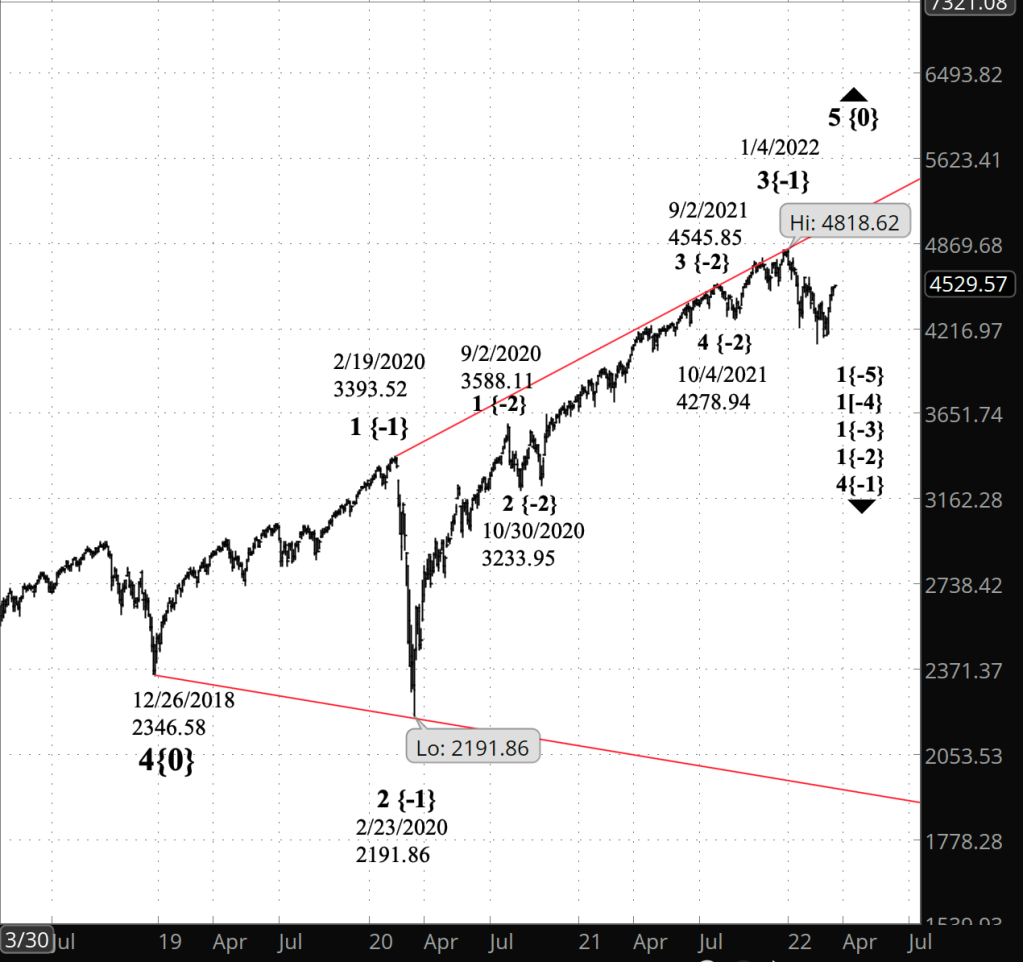
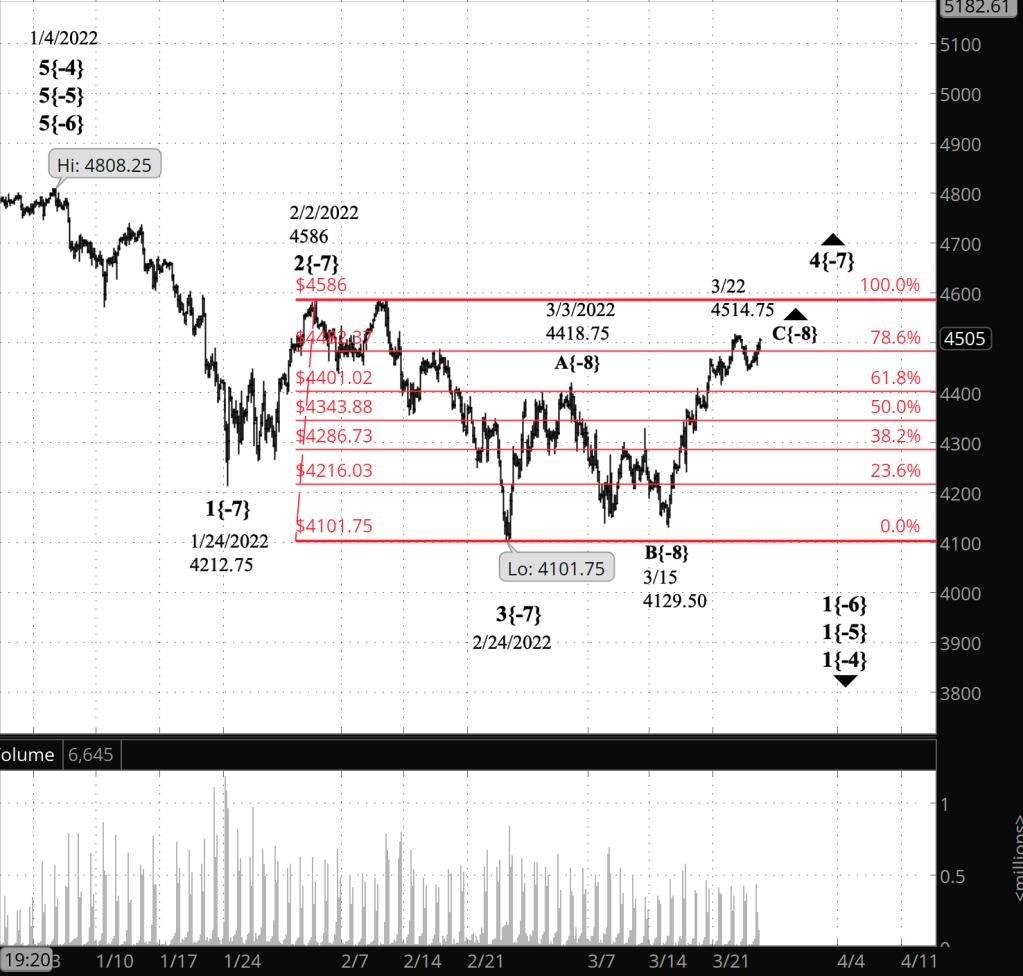
Charts. The upper chart is a closer-in view showing the January 4 peak and the subsequent decline of the S&P 500 futures. The lower chart is a longer view showing the price structure since December 2018 of the S&P 500 index. That structure is an expanding Diagonal Triangle, and I’ll discuss it in the Elliott wave analysis section below.
[S&P 500 E-mini futures at 3:30 p.m., 3-hour bars, with volume]
[S&P 500 index at 9:32 a.m., 2-day bars]
What does Elliott wave theory say? The upward correction, wave 4{-7}, has fulfilled all of the requirements of Elliott wave analysis. It has traced three subwaves — A, B and C at the {-8} degree — and wave C{-8} internally has five waves. The question now is whether wave 5{-9} within wave C{-8} within wave 4{-7} is yet complete.
When wave 4{-7} reaches its end, it will be followed by wave 5{-7}, which will most likely carry the price below the end of wave 3{-7} and the start of wave 4{-7} — 4101.75 — and perhaps significantly below that level. I’m hedging with “most likely” because sometimes 5th waves fail to move beyond the end of the preceding wave 3{-7}. Almost always, however, they do move beyond that end point.
This is all happening within wave 1{-6}, the first wave of a large downtrend that began on January 4.
As shown in the lower chart, wave {-6} is the smallest of five 1st waves, each of increasing degree, that began on the 4th of January. Their parent is wave 4{-1}, the next-to-the-last wave within wave 5{0}, the final wave in an expanding Diagonal Triangle that began on December 26, 2018 from 2346.58.
The price-channel boundaries of the Triangle grow further apart each day — that’s the “expanding” part” — and wave 4{-1} will eventually approach the lower boundary and perhaps overshoot it by a little. The lower boundary is presently in the low 1900s, and it will be noticeably lower by the time wave 4{-1} reaches that level.
Wave 4{-1} will be followed by rising wave 5{-1}, which again will eventually carry the price to the region upper boundary, perhaps overshooting it by a little, or perhaps falling short. The upper boundary at present is approaching 5100, and it will be noticeably higher by the time the price completes its journey from the lower boundary.
Wave 5{-1}, when complete, will be the end of the Triangle, wave 5{0}. It will be followed by a downward correction that will be built from subwaves lasting for years, with the usual ups and downs that form the consistent patterns of the market.
We Are Here.
These are the waves currently in progress under my principal analysis. Each line on the list shows the wave number, with the subscript in curly brackets, the traditional degree name, the starting date, the starting price of the S&P 500 E-mini futures, and the direction of the wave.
Learning and other resources. Elliott wave analysis provides context, not prophecy. As the 20th century semanticist Alfred Korzybski put it in his book Science and Sanity (1933), “The map is not the territory … The only usefulness of a map depends on similarity of structure between the empirical world and the map.” And I would add, in the ever-changing markets, we can judge that similarity of structure only after the fact.
See the menu page Analytical Methods for a rundown on where to go for information on Elliott wave analysis.
By Tim Bovee, Portland, Oregon, March 25, 2022
Disclaimer
Tim Bovee, Private Trader tracks the analysis and trades of a private trader for his own accounts. Nothing in this blog constitutes a recommendation to buy or sell stocks, options or any other financial instrument. The only purpose of this blog is to provide education and entertainment.
No trader is ever 100 percent successful in his or her trades. Trading in the stock and option markets is risky and uncertain. Each trader must make trading decisions for his or her own account, and take responsibility for the consequences.
Half an hour before the closing bell. The S&P 500 has risen during the trading session but so far has remained below the upward correction’s March 22 high, 4514.75. No change in the analysis. Wave 4{-7} continues and is in its last wave internally, wave C{-8}. When complete, wave 4{-7} will be followed by a resumption of the downtrend, wave 5{-7}, that will carry the price below 4101.75, where the correction began on February 24. I’ve updated the chart.
10 a.m. New York time
DRI earnings play exit. I’ve exited my short bear call options spread on DRI at 25% of maximum potential profit and have updated the trade analysis with full results.
9:35 a.m. New York time
What’s happening now? The S&P 500 E-mini futures rose in overnight trading, remaining below the March 22 high, 4514.75.
What does it mean? The upward correction that began on February 24 is still underway and is in its final phase.
What are the alternatives? There are two.
Alternative #1: The correction might well have ended at the May 22 high. If so, then the subsequent decline and rise are the early stages of a resumption of the downtrend that began on January 4. The principal analysis and this alternative have an equal likelihood of being an accurate description of the S&P 500’s future course.
Alternative #2: It’s also possible that the correction is forming a compound structure, connecting two or three corrective patterns together. If so, then the decline since May 22 is the start of a connecting movement, and it will be followed by a second corrective pattern.
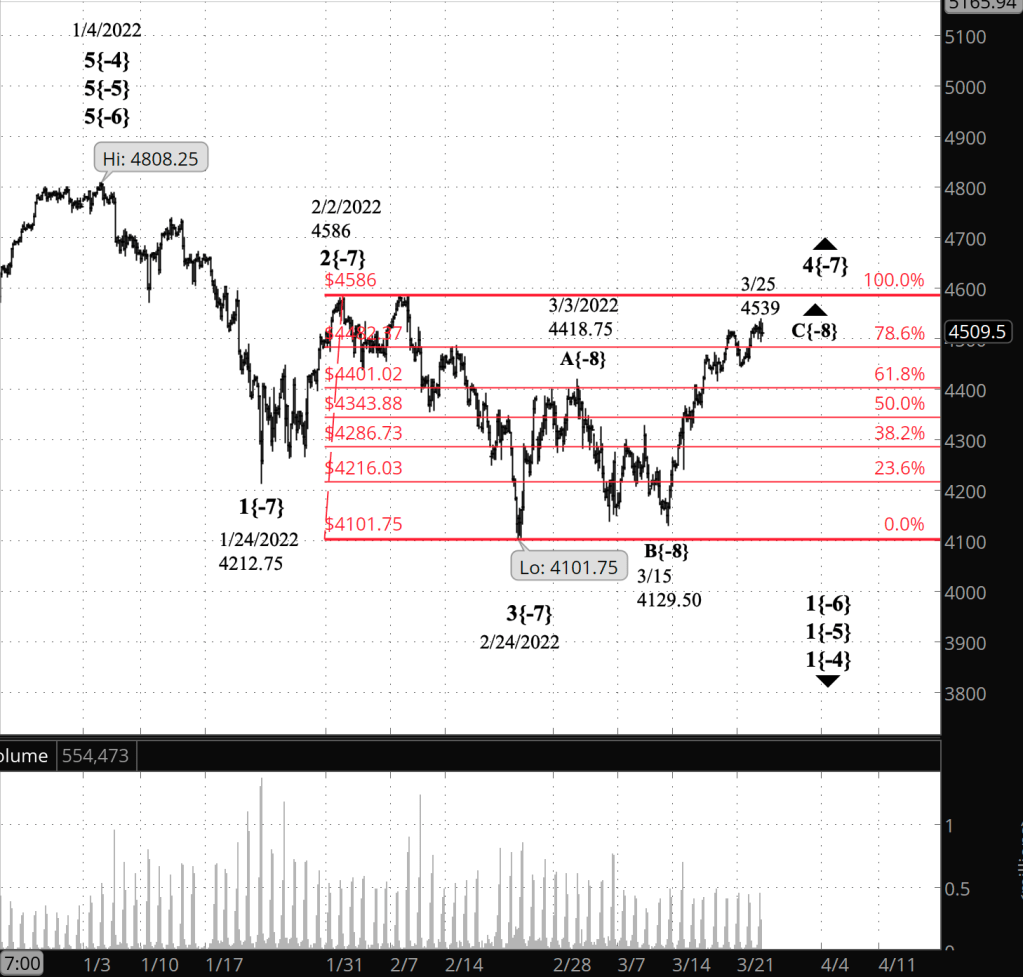
[S&P 500 E-mini futures at 3:30 p.m., 160-minute bars, with volume]
What does Elliott wave theory say? Under my principal analysis, wave C{-8} within wave 4{-7} is in its 5th and final wave internally. When it is complete, ending the upward correction, the downtrend will resume as wave 1{-8} within wave 5{-7}.
Under the first alternative, wave C{-8} and wave 4{-7} ended on May 22 at 4514.75, and wave 1{-8} within wave 5{-7} has begun.
Under the second alternative, the May 22 high completed the first corrective pattern within waver 4{-7}, and the subsequent decline is a connector, wave X{-8}. It will be followed by a second corrective pattern of three waves within wave 4{-7}. It’s also possible that a Triangle pattern could form, with five wavers internally.
There’s no way in the analysis to choose between the principal analysis — wave 4{-7} is underway — and the first alternative — wave 5{-7} is underway. In choosing the ongoing wave 4{-7} scenario as my principal analysis, I’m making a conservative decision. An ongoing wave 4{-7} requires no change in how I trade — a transitioning from bullish to bearish. On the other hand, a new beginning, wave 5{-7}, requires a switch to an aggressively bearish posture.
We Are Here.
These are the waves currently in progress under my principal analysis. Each line on the list shows the wave number, with the subscript in curly brackets, the traditional degree name, the starting date, the starting price of the S&P 500 E-mini futures, and the direction of the wave.
Learning and other resources. Elliott wave analysis provides context, not prophecy. As the 20th century semanticist Alfred Korzybski put it in his book Science and Sanity (1933), “The map is not the territory … The only usefulness of a map depends on similarity of structure between the empirical world and the map.” And I would add, in the ever-changing markets, we can judge that similarity of structure only after the fact.
See the menu page Analytical Methods for a rundown on where to go for information on Elliott wave analysis.
By Tim Bovee, Portland, Oregon, March 24, 2022
Disclaimer
Tim Bovee, Private Trader tracks the analysis and trades of a private trader for his own accounts. Nothing in this blog constitutes a recommendation to buy or sell stocks, options or any other financial instrument. The only purpose of this blog is to provide education and entertainment.
No trader is ever 100 percent successful in his or her trades. Trading in the stock and option markets is risky and uncertain. Each trader must make trading decisions for his or her own account, and take responsibility for the consequences.
Update 3/24/2022: I exited my bear call vertical options spread on DRI, 57 days before expiration, for a $0.70 debit per contract/share, a profit before fees of $25 per contract. Shares were trading at $130.30, $2.15 from the entry level.
The Implied Volatility Rank at exit was 47.5, down 13.2 points from the entry level.
I exited because the position reached 25% of maximum potential profit, my normal exit point for earnings plays.
Shares fell by 1.6% over one day for a -593% annual rate. The options position produced a 32.5% return for a +11,851% annual rate.
I have entered a short bear call options spread on DRI, using options that trade for the last time 58 days hence, on May 20. The premium is a $1.02 credit per contract share and the stock at the time of entry was priced at $132.45.
The Implied Volatility Ratio stood at 60.7%.
Premium:
$1.02
Expire OTM
DRI-bear call spread
Strike
Odds
Delta
Calls/Puts
Long
150.00
96.0%
18
Break-even
146.02
87.5%
22
Short
145.00
79.0%
26
The premium is 40.8% of the width of the position’s short/long spread. The profit zone covers a 10.2% move to the upside and an unlimited move to the upside.
The risk/reward ratio is 3.9:1, with maximum risk of $398 and maximum reward of $102 per contract.
How I chose the trade. The trade was placed to coincide with DRI’s earnings announcement, before the opening bell on the day after entry. The short strikes were set to coincide with the expected move of $10.25 either way, based on options pricing, which gives a range of $122.70 to $142.70. The options series used for estimated the movement was 22 days prior to expiration, which with adjustment for the time period gave an unusable range estimate (low price higher than the high price). So I removed the adjustment and set up the trade based on the unadjusted range. The strike price for DRI are $5 apart, further limiting my ability to match the price range estimate.
By Tim Bovee, Portland, Oregon, March 23, 2022
Disclaimer
Tim Bovee, Private Trader tracks the analysis and trades of a private trader for his own accounts. Nothing in this blog constitutes a recommendation to buy or sell stocks, options or any other financial instrument. The only purpose of this blog is to provide education and entertainment.
No trader is ever 100 percent successful in his or her trades. Trading in the stock and option markets is risky and uncertain. Each trader must make trading decisions for his or her own account, and take responsibility for the consequences.



You must be logged in to post a comment.