SP500 Analysis

3:30 p.m. New York time

Half an hour before the closing bell. The S&P 500 declined during the session, reaching 4642 at the low point of the futures. I’m counting the overnight peak, 4743.25, as being the end of wave 3 of Bitsy degree, and the subsequent decline as a 4th wave correction. This early in a trend it’s hard to say what degree the waves are. The patterns are clear, but not where they fit into the bigger picture. The overnight peak could just as well be a degree or two lower that I’ve marked it. Nonetheless, no change in the analysis. I’ve updated the chart.

2:30 p.m. New York time

My trades. I’ve entered two short iron condor positions timed to coincide with earnings announcements and have published analyses, of FDX and DRI.

10:15 a.m. New York time

Trade exit. I’ve exited my short iron condor earnings play on LEN for a 12.5% profit before fees and have updated the analysis with results.

9:40 a.m. New York time

What’s happening now? The S&P 500 E-mini futures reached a new all-time high, 4743.25, in overnight trading, eclipsing the prior peak, 4740.50, attained on November 22.

What does it mean? The downward correction that began on November 22 ended on December 14, and the final leg of the uptrend that began on October 6, from 4273.75, is now underway.

What’s the alternative? I have none at this point. The chart has a great deal of clarity.
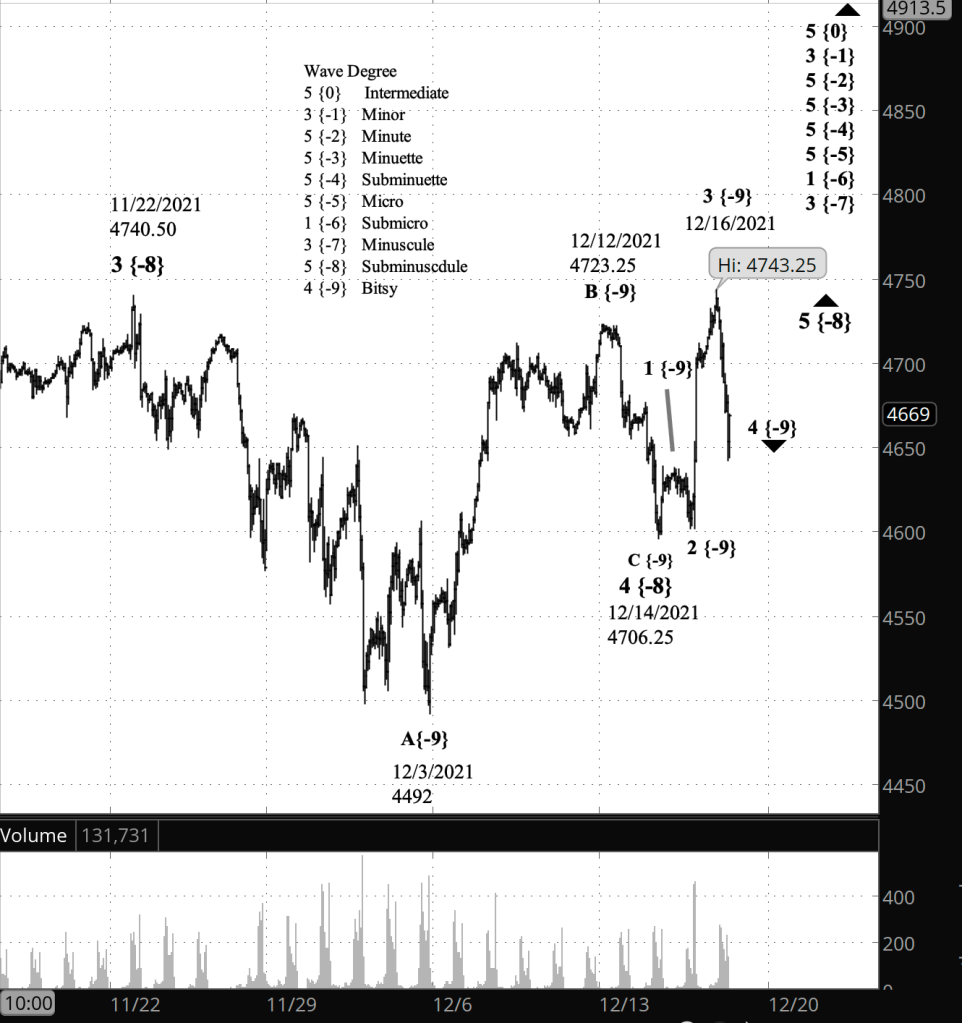
[S&P 500 E-mini futures at 3:30 p.m., hourly bars, with volume]

What does Elliott wave theory say? The new peak means that wave 4 of Subminuscule degree — subscript {-8} — ended on December 14 with a seriously shortened C wave, internally, and that Subminuscule wave 5 began on that date, and this morning before the opening bell eclipsed the end point of wave 3 of Subminuscule degree on November 22. Fifth waves have no limits, beyond those imposed by the need for them to be proportional to the rest of the larger wave of which they are a part. So this 5th could go high, or end quickly. There’s nothing in Elliott at this point to guide our expectations.

The uptrending higher degrees remain unchanged: Minuscule 3 {-7} all the way up to Intermediate 5 {0} seven levels higher.

Interestingly, the S&P 500 index has not hit a new peak, and so, not for the first time, we have a divergence between the futures, which trade overnight, and the index, which doesn’t track change between the closing and opening bells.

My trades. I’ll be looking at two symbols as potential earnings plays today. FDX publishes earnings today after the closing bell, and DRI announces on Friday before the opening bell.

Learning and other resources. Elliott wave analysis provides context, not prophecy. As the 20th century semanticist Alfred Korzybski put it this way in his book Science and Sanity (1933), “The map is not the territory … The only usefulness of a map depends on similarity of structure between the empirical world and the map.” And I would add, in the ever-changing markets, we can judge that similarity of structure only after the fact.

See the menu page Analytical Methods for a rundown on where to go for information on Elliott wave analysis.

By Tim Bovee, Portland, Oregon, December 16, 2021

Disclaimer

Tim Bovee, Private Trader tracks the analysis and trades of a private trader for his own accounts. Nothing in this blog constitutes a recommendation to buy or sell stocks, options or any other financial instrument. The only purpose of this blog is to provide education and entertainment.

No trader is ever 100 percent successful in his or her trades. Trading in the stock and option markets is risky and uncertain. Each trader must make trading decisions for his or her own account, and take responsibility for the consequences.

License
Creative Commons License

All content on Tim Bovee, Private Trader by Timothy K. Bovee is licensed under a Creative Commons Attribution-ShareAlike 4.0 International License.

Based on a work at www.timbovee.com.
LEN Trade

Lennar Corp. (LEN)

Update 12/16/2021: I exited my iron condor earnings play on LEN the day after earnings were announced, for a $3.60 debit per contract/share, a profit before fees of $45 per contract. Shares were trading at $107.46, down $3.18 from the entry level.

The Implied Volatility Rank at exit was 50.0%, down 20.7 points from the entry level.

Under my preliminary rules for earnings plays, my goal is to exit with a profit, big or small. Trades based on earnings have narrower profit zones than I would normally construct; the profit comes from the decline in implied volatility that almost always accompanies an earnings announcement. So the usual rule of exiting at 50% of maximum potential profit with any profit 21 days before expiration don’t apply to earnings plays. Basically, it’s role the dice and, win or lose, move on.

Shares declined by 2.9% over one day for a -1049% annual rate. The options position produced a 12.5% return for a +4,563% annual rate.


I have entered a short iron condor on LEN, using options that trade for the last time 37 days hence, on January 21. The premium is a $4.05 credit per contract share and the stock at the time of entry was priced at $110.64

The Implied Volatility Ratio stands at 70.5%

Premium:$4.05Expire OTM
LEN-iron condorStrikeOddsDelta
Calls
Long125.0086.0%17
Break-even119.0576.0%28
Short115.0066.0%39
Puts
Short105.0063.0%32
Break-even101.5571.5%24.5
Long97.5080.0%17

The premium is 48% of the width of the positions short/long spreads. The profit zone covers a 7.6% move to the upside and a 9.0% move to the downside, for a total width of 16.6%.

The risk/reward ratio is 1.2:1, with maximum risk of $470 and maximum reward of $405 per contract.

How I chose the trade. I entered the trade the day of the earnings announcement after the closing bell. Options prices closest to expiration, discounted for days remaining, imply a move of $5.07 in either direction. Elliott wave analysis didn’t give a clear direction to the chart, and Zacks ranks the company as neutral with little expectation of an earnings surprise.

By Tim Bovee, Portland, Oregon, December 15, 2021

Disclaimer

Tim Bovee, Private Trader tracks the analysis and trades of a private trader for his own accounts. Nothing in this blog constitutes a recommendation to buy or sell stocks, options or any other financial instrument. The only purpose of this blog is to provide education and entertainment.

No trader is ever 100 percent successful in his or her trades. Trading in the stock and option markets is risky and uncertain. Each trader must make trading decisions for his or her own account, and take responsibility for the consequences.

License
Creative Commons License

All content on Tim Bovee, Private Trader by Timothy K. Bovee is licensed under a Creative Commons Attribution-ShareAlike 4.0 International License.

Based on a work at www.timbovee.com.
SP500 Analysis

3:30 p.m. New York time

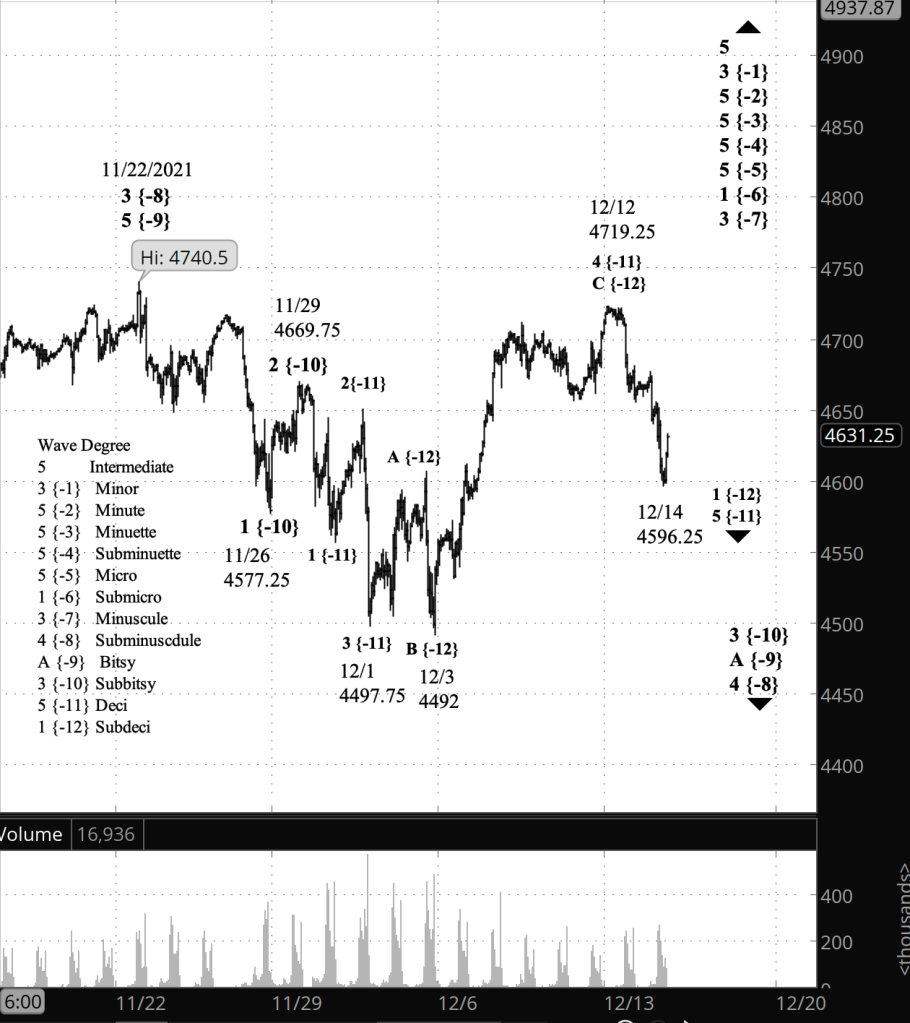
Half an hour before the closing bell. The counter-trend rise within a downward move that began on December 12 continues. Internally, the decline shows three clear waves. A downtrend in Ellliott wave analysis has five waves when complete. A corrective wave, including a wave connecting to corrective forms within a compound structure, has three waves total.

If the present 3rd wave internally reverses and resumes the downtrend to lower levels, then most likely we’ll be seeing a 5th wave within wave 1 of Subdeci degree {-12} within wave 1 of Deci degree {-11}. If the 3rd wave reverses without a significant decline to lower levels, then we’ll most likely be seeing a C wave within wave X of Subdeci degree in a compound correction, wave 4 of Deci degree.

No change in the analysis. I’ve updated the chart.

1:30 p.m. New York time

Earnings play. I’ve entered a short iron condor position on LEN, which announces earnings after the closing bell today, and have posted an analysis. I also analyzed JBL, which announces earnings tomorrow before the opening bell, but it produced a higher risk/reward ratio than I like, and so I passed on it.

9:35 a.m. New York time

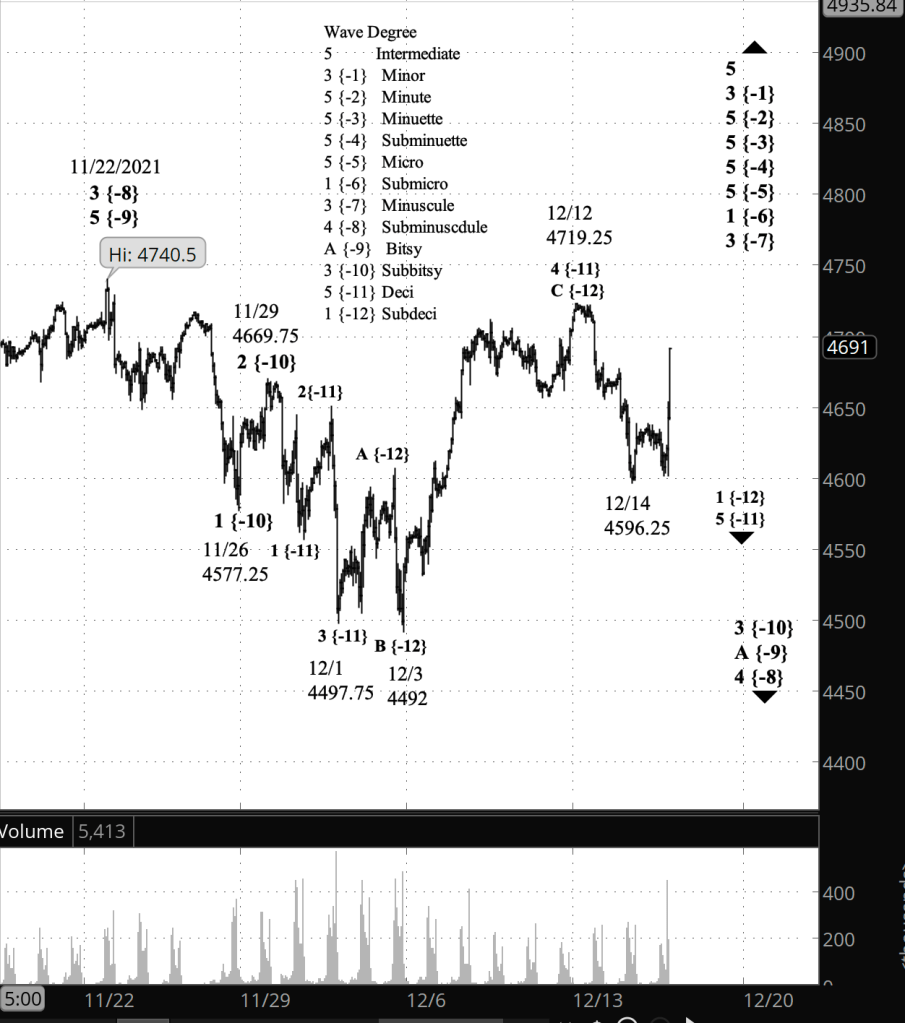
What’s happening now? The S&P 500 E-mini futures rose slightly from yesterday’s low of 4596.25, reaching a high so far of 4638.25 in overnight trading.

What does it mean? The reversal upward is a correction within a downtrend that began on December 12 from 4596.25 and that will carry the price into the 4490s and below.

What’s the alternative? The reversal is an upward correction within a shallow downward movement that will connect the now complete corrective pattern that began on December 1 with a second corrective pattern in a compound structure.

[S&P 500 E-mini futures at 3:30 p.m., hourly bars, with volume]

What does Elliott wave theory say? Under my principal analysis, the decline that began on December 12 is wave 1 of Subdeci degree — subscript {-12} — within wave 5 of Deci degree {-11} within wave 3 of Subbitsy degree {-10}. The whole structure is part of a larger correction, standing within wave A of Bitsy degree {-9} within wave 4 of Subminuscule degree {-8}, a downward correction that began on November 22.

The alternative analysis notes that corrections sometimes form complex structures composed of several corrective patterns. Such a compound correction is a possible pattern for wave 4 of Deci degree. If such proves to be the case, then Deci 4 did not end on December 12, coincident with the end of its internal wave C. Instead, wave C ended the first corrective pattern, and the present decline is an X wave that connects the completed pattern with another pattern yet to come, mostly likely taking the form of a Flat or a Zigzag.

My trades. Today I’ll be looking at two potential earnings plays: LEN, which announces today after the closing bell, and JBL, which announces Wednesday before the opening bell. For a rundown of the methods I’ll be using, including a preliminary rule set, see my post “How to Play Earnings“, which went up on December 10.

Learning and other resources. Elliott wave analysis provides context, not prophecy. As the 20th century semanticist Alfred Korzybski put it this way in his book Science and Sanity (1933), “The map is not the territory … The only usefulness of a map depends on similarity of structure between the empirical world and the map.” And I would add, in the ever-changing markets, we can judge that similarity of structure only after the fact.

See the menu page Analytical Methods for a rundown on where to go for information on Elliott wave analysis.

By Tim Bovee, Portland, Oregon, December 15, 2021

Disclaimer

Tim Bovee, Private Trader tracks the analysis and trades of a private trader for his own accounts. Nothing in this blog constitutes a recommendation to buy or sell stocks, options or any other financial instrument. The only purpose of this blog is to provide education and entertainment.

No trader is ever 100 percent successful in his or her trades. Trading in the stock and option markets is risky and uncertain. Each trader must make trading decisions for his or her own account, and take responsibility for the consequences.

License
Creative Commons License

All content on Tim Bovee, Private Trader by Timothy K. Bovee is licensed under a Creative Commons Attribution-ShareAlike 4.0 International License.

Based on a work at www.timbovee.com.
SP500 Analysis

3:30 p.m. New York time

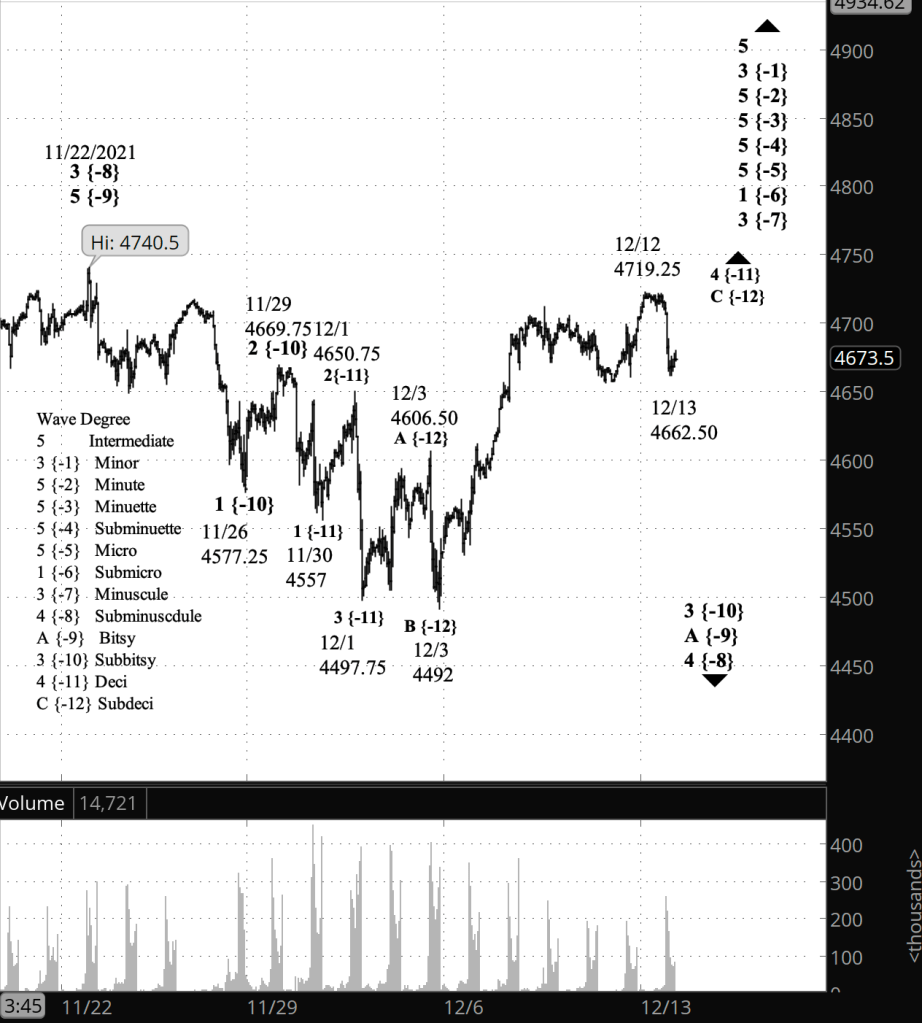
Half an hour before the closing bell. The S&P 500 has fallen during the trading session, reach the 4590s. No change in the analysis. I’ve updated the chart.

9:35 a.m. New York time

What’s happening now? The S&P 500 E-mini futures continued to fall in overnight trading and at the opening bell had reached 4223.75 on the futures.

What does it mean? The decline strengthens the case for the uptrending correction that began on December 1 having ended on December 12, and that a new downtrend has begun from that peak, 4719.25. It is likely to reach the 4490s at a minimum.

What’s the alternative? Corrections sometimes create complex structures, linking two corrective patterns together. If that’s the case here, then I expect the decline to end above the 4490s, signaling the start of another corrective pattern within the larger rise that began on December 1.

[S&P 500 E-mini futures at 3:30 p.m., hourly bars, with volume]

What does Elliott wave theory say? Under my principal analysis, uptrending wave 4 of Deci degree — subscript {-11} ended on December 12 and Deci wave 5 is now underway, internally tracing its 1st wave, of Subdeci degree {-12}. Wave 5 is tracing its downward course within the 3rd wave, of Subbitsy degree {-10}, within a larger downward correction, wave A of of Bitsy degree {-9}, the first wave within wave 4 of Subminuscule degree {-8}.

Under the alternative analysis, wave 4 of Deci degree is still underway, having completed a corrective pattern, and the present decline is wave X of Subdeci degree, which will, when complete, signal the start of another corrective pattern within wave 4.

Learning and other resources. Elliott wave analysis provides context, not prophecy. As the 20th century semanticist Alfred Korzybski put it in his book Science and Sanity (1933), “The map is not the territory … The only usefulness of a map depends on similarity of structure between the empirical world and the map.” And I would add, in the ever-changing markets, we can judge that similarity of structure only after the fact.

See the menu page Analytical Methods for a rundown on where to go for information on Elliott wave analysis.

By Tim Bovee, Portland, Oregon, December 14, 2021

Disclaimer

Tim Bovee, Private Trader tracks the analysis and trades of a private trader for his own accounts. Nothing in this blog constitutes a recommendation to buy or sell stocks, options or any other financial instrument. The only purpose of this blog is to provide education and entertainment.

No trader is ever 100 percent successful in his or her trades. Trading in the stock and option markets is risky and uncertain. Each trader must make trading decisions for his or her own account, and take responsibility for the consequences.

License
Creative Commons License

All content on Tim Bovee, Private Trader by Timothy K. Bovee is licensed under a Creative Commons Attribution-ShareAlike 4.0 International License.

Based on a work at www.timbovee.com.
SP500 Analysis

3:30 p.m. New York time

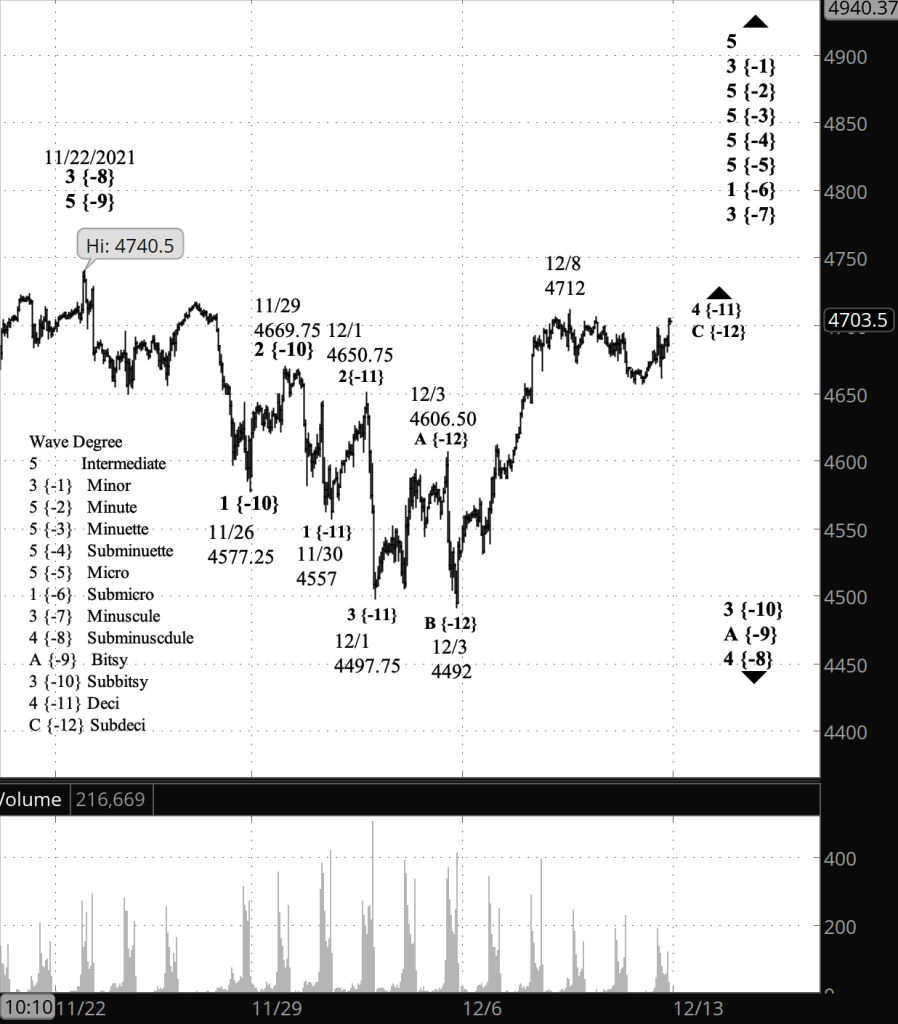
Half an hour before the closing bell. The S&P 500 has fallen during the day, reaching a low so far of 4662.50 on the futures, 4671.84 on the index. Although the index from this morning is unchanged, the 57-point decline strengthens the possibility that the Sunday’s high of 47198.25 on the futures marked the end of the 5th wave within wave C of Subdeci degree — subscript {-12} within wave 4 of Deci degree {-11} within downtrending wave 3 of Subbitsy degree {-10}, which began on November 29. If the decline continues tomorrow, I’ll rework the wave numbering to reflect the end of Deci 4 and the start of the subsequent 5th wave, which will carry the price down to the 4490s and perhaps lower. I’ve updated the chart.

9:35 a.m. New York time

What’s happening now? On Sunday night, the S&P 500 E-mini futures reached a new high, 4719.25, in the rise that has been underway since December 3.

What does it mean? The third wave of an upward correction that began on December 1 is still underway, although reaching its end. The correction is part of a larger downtrend.

What’s the alternative? If the price should exceed the all-time high of 4740.50 set on November 22, then the rise that began on October 6 may not have reached an end, and the decline of the past weeks can be seen as a downward correction within that rise.

[S&P 500 E-mini futures at 3:30 p.m., 55-minute bars, with volume]

What does Elliott wave theory say? My principal analysis remains unchanged from Friday. The price is moving through wave C of Subdeci degree within wave 4 of Deci degree within wave 3 of Subbitsy degree within wave A of Bitsy degree within wave 4 of Subminuscule degree. The subscripts are {-12} beginning with Subdeci up to {-8} for Subminuscule.

Internally, there’s an argument to be made that Sunday’s high within the correction could mark the end of the correction, as it is possible to count a five-wave rise, which is expected for this C wave. If this is the case, then the decline from the high is the start of wave 5 of Deci degree, which will reach down to the 4590s or lower.

The price is getting close to the November 22 high, 4740.50, that ended with 3 of Subminuscule degree. Under the norms identified within Elliott wave analysis, the price of this correction ought to remain below that level. If it exceeds it, then I’ll need to revisit the chart and revise my count of the waves.

Learning and other resources. Elliott wave analysis provides context, not prophecy. As the 20th century semanticist Alfred Korzybski put it in his book Science and Sanity (1933), “The map is not the territory … The only usefulness of a map depends on similarity of structure between the empirical world and the map.” And I would add, in the ever-changing markets, we can judge that similarity of structure only after the fact.

See the menu page Analytical Methods for a rundown on where to go for information on Elliott wave analysis.

By Tim Bovee, Portland, Oregon, December 12, 2021

Disclaimer

Tim Bovee, Private Trader tracks the analysis and trades of a private trader for his own accounts. Nothing in this blog constitutes a recommendation to buy or sell stocks, options or any other financial instrument. The only purpose of this blog is to provide education and entertainment.

No trader is ever 100 percent successful in his or her trades. Trading in the stock and option markets is risky and uncertain. Each trader must make trading decisions for his or her own account, and take responsibility for the consequences.

License
Creative Commons License

All content on Tim Bovee, Private Trader by Timothy K. Bovee is licensed under a Creative Commons Attribution-ShareAlike 4.0 International License.

Based on a work at www.timbovee.com.
How to Play Earnings

It’s hard to believe that Private Trader has been around for more than a decade. The first post, on November 4, 2009, was a watchlist of stocks, and the next day, I wrote up my trade in one of them, a bull put spread on CSCO.

I had dabbled in active management of trades since the mid-1980s, but in 2009 I started to get very serious about trading after my contract job managing projects disappeared at the start of the Great Recessions. There were no jobs, and trading was one way to help put rice in the rice cooker.

Long-term readers will recall that over those years, from time to time, I’d try out various ways of trading earnings announcements using options. It was an appealing idea. Most of the options strategies I use — spreads and iron condors entered 45 days out from expiration — stay on the books for nearly a month before I exit. Earnings plays, at their best, are two-day positions, in before the announcement and out at first opportunity afterward. It keeps my capital churning, and that’s ideally what makes profits.

No earnings play method that I’ve tried so far has really worked out to my satisfaction. So, one by one, I’d abandon them and mope along with my monthly spreads and iron condors, many of them profitable, but the pace of trading left me with a lot of idle time.

So my interest was piqued when Nick Battista, of the TastyTrade team, posted a graphic on Twitter showing the expected moves of three stocks after their earnings announcements that same day. Curious, I asked him what he had based the expected moves on, and he was generous enough to reply.

An aside. I’ve followed TastyTrade, an online network devoted to analyzing trading strategies and teaching people about options, since its inception in 2011, and even before that, I had traveled from Portland, Oregon to Chicago to attend a presentation and training session conducted by Tom Sosnoff, a veteran of the Chicago options exchange and head of the team that designed ThinkOrSwim, at one time the best trading platform for options (and it’s still very, very good).

I’ve learned more about trading options from Tom and TastyTrade than from all of my efforts before they hit the ‘net. They don’t know me from Adam (I did meet Sosnoff, briefly, long ago), but I consider them to be my mentors.

So, back to earnings plays. Nick in our Twitter exchange briefly described his use of options pricing to calculate the expected move.

After our brief exchange, I immediately rushed to the TastyTrade site to search out more details, and found them in an episode dating back to last February, a 10-minute airing of “Options Jive” in which Tom Sosnoff and Tony Battista talked about the details of calculating expected move.

The method works by taking the value of three positions and weighting them according to their distance from the at-the-money (ATM) mark.

  1. Using the options closest to expiration…
  2. take the price of an ATM short straddle and multiply it by 60% (0.6)…
  3. take the price of strangle one strike price away from ATM, and multiply it by 30% (0.3)…
  4. and take the price of a strange two strikes away from ATM, and multiply it by 10% (0.1).
  5. The expected move is the average of the weighted prices — add them together and divide by 3.
  6. Note that the expected move doesn’t anticipate the direction of the move — could be up, could be down.
  7. Trades are best placed at a time as close to the earnings announcement as is feasible.

Expiration dates most of the time won’t match the date of entry into an earnings play. Nick Battista’s practice is to discount the expected move by 5% times the number of days, minus one, remaining until expiration, and that’s a practice that I shall adopt.

Sosnoff in the “Options Jive” video says that the method works out 68% of the time. The reality of trading is that no estimate of outcomes is 100%, and being right 68% of the time, I’ve found, gives me the edge I need to stay profitable.

TastyTrade’s affiliated trading platform, TastyWorks, displays the expected move based on this method, absent the time discount, in the corner of each options grid.

So how should I use this? As regular readers know, I don’t trade without rules. I post them in the “Trading Rules” page linked to on the menu bar at the top of each page.

Here’s my first attempt at rules for how to trade expected earnings.

  1. Enter a position on the final trading day before the earnings announcement. (I need to determine how much price change there is prior to the day before.)
  2. Select highly liquid stocks with options having an implied volatility rank of 30% or higher.
  3. In selecting the options expiration date, it’s important to weigh the price received for the options vs. the speed of time decay, which helps the value. Also, monthly options have narrower bid/ask spreads than do the weeklies. (I don’t have a firm rule on how far out from expirations the options should be. For normal spreads, the optimal buying period is 45 days from expiration.)
  4. Optionally, pick a direction for the expected move. There are many ways to do this. I use Elliott wave analysis, and sometimes check out the Zacks Rank and Expected Surprise Prediction percentage.
  5. Directional strategies: For lower risk (and lower returns), short bull put spreads if a rise is expected, short bear call spreads if a fall is expected. For higher risk (and higher returns), short puts if a rise is expected, short calls if a fall is expected.
  6. If no direction is picked, use a non-directional strategy: For lower risk, iron condors. For higher risk, strangles.
  7. The short strikes for each strategy should be far enough out of the money to enclose the expected move.
  8. Exit at the earliest profitable opportunity.

And that’s it. A trade that’s over in two days or so, backed by a statistically sound rationale.

It’s earnings season, and I’ll be looking at LEN and JBL on Wednesday, and FDX and DRI on Thursday, and as I do with my slower options strategies, I shall post about the trades on PrivateTrader.

By Tim Bovee, Portland, Oregon, December 10, 2021

Disclaimer

Tim Bovee, Private Trader tracks the analysis and trades of a private trader for his own accounts. Nothing in this blog constitutes a recommendation to buy or sell stocks, options or any other financial instrument. The only purpose of this blog is to provide education and entertainment.

No trader is ever 100 percent successful in his or her trades. Trading in the stock and option markets is risky and uncertain. Each trader must make trading decisions for his or her own account, and take responsibility for the consequences.

License
Creative Commons License

All content on Tim Bovee, Private Trader by Timothy K. Bovee is licensed under a Creative Commons Attribution-ShareAlike 4.0 International License.

Based on a work at www.timbovee.com.
SP500 Analysis

4:40 p.m. New York time

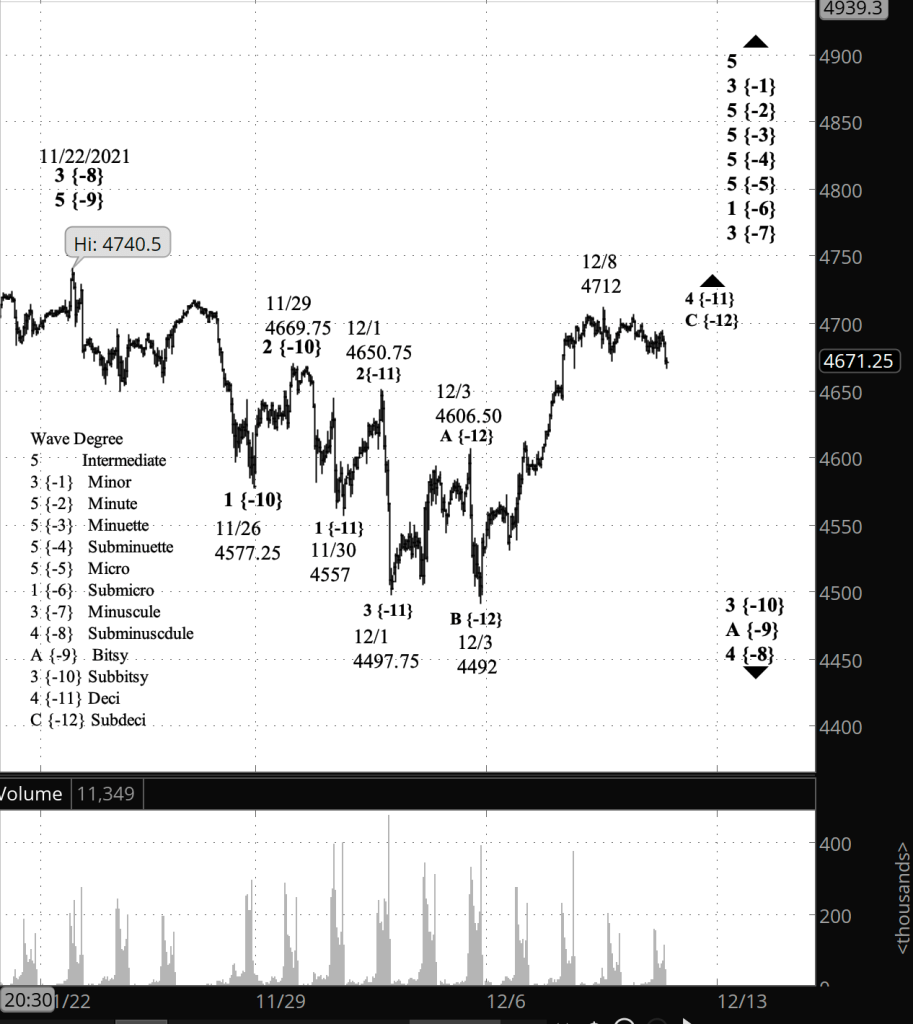
After the closing bell. The S&P 500 E-mini futures rose above the morning high, to 4705.25. The all-time high was set on November 22, at 4740.50. The index set a high today of 4713.57, below the all-time high of 4743.83 set on November 19. I’ve updated the upper chart. The analysis, as before, is unchanged.

3:30 p.m. New York time

Half an hour before the closing bell. The S&P 500 has remained below its morning high most of the day, trading in a narrow range. No change in the analysis. I’ve updated the upper chart.

9:35 a.m. New York time

What’s happening now? The S&P 500 E-mini futures rose in overnight trading, reaching 4699 at the opening bell, 13 points below the December 8 reversal point.

What does it mean? The upward correction that began on December 1 is still underway, although in its late phase, and has the potential to exceed the December 8 high, 4712. However, it will remain below the November 22 peak of 4740.50. Once the correction has ended, the downtrend will resume and the price will decline to below the correction’s starting point, 4497.75, perhaps significantly below.

What’s the alternative? It’s possible the correction will form a compound structure. Once it ends, the price will decline but will remain above the correction’s starting point, and then will rise in the first leg of a second corrective pattern.

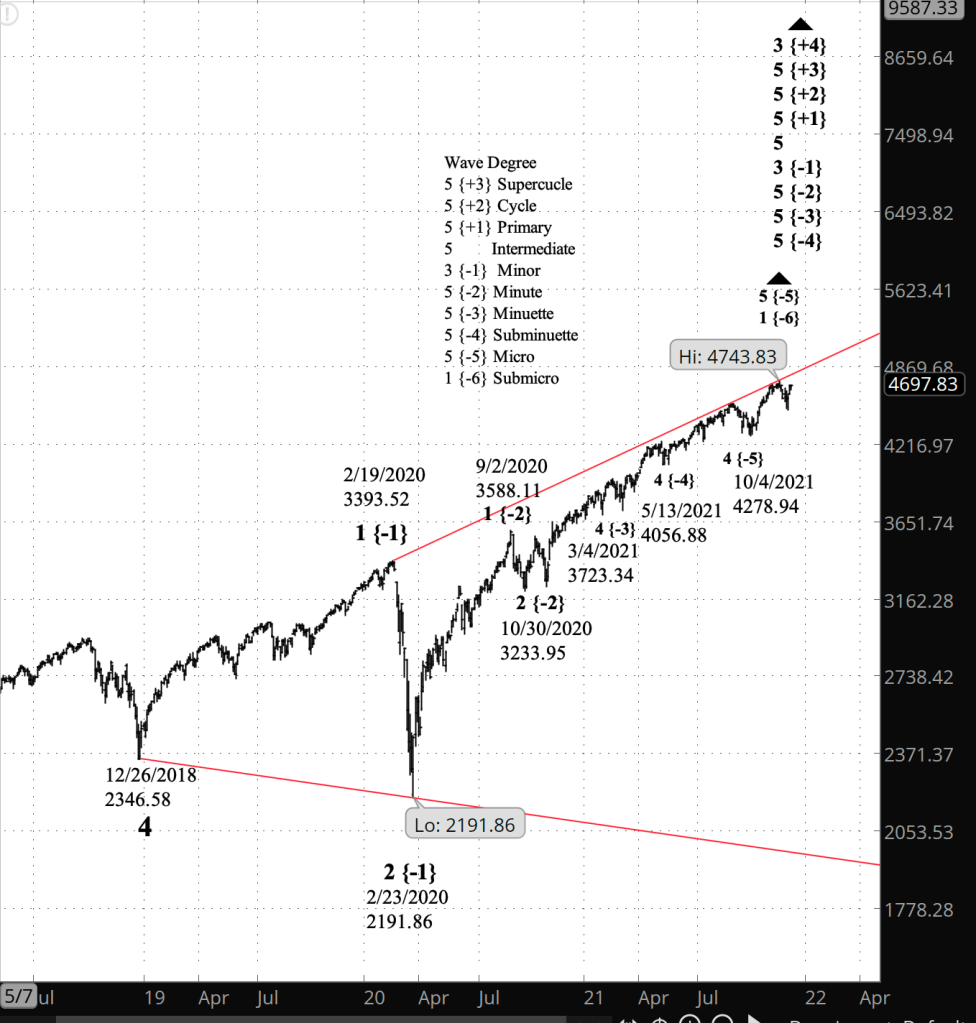
Big picture. The S&P 500 index price remains close to the upper boundary of an expanding Diagonal Triangle that began in December 2018, and the latest leg of the rise that began in February 2020, at the end of the early pandemic crash, is still underway.

Charts. The upper chart shows the near-term view, stretching back to mid-November. The lower chart shows the Diagonal Triangle in its entirety and stretches back to early May 2018.

[S&P 500 E-mini futures at 4:40 p.m., 50-minute bars, with volume]
[S&P 500 index at 9:32 a.m., 2-day bars]

What does Elliott wave theory say? Under my principal analysis, wave C of Subdeci degree — subscript {-12} — is beginning its last wave internally. The end of wave C will also mark the end of wave 4 of Deci degree {-11} and the beginning of a 5th wave that will carry the price below the starting point of the 4th wave, 4497.75. The completion of Deci wave 5 will also be the end of its parent, wave A of Bitsy degree {-9}, the first leg of a larger, downward correction, wave 4 of Submicro degree {-8}, which began on November 22.

Under my alternative analysis, Deci wave 4 will form a compound structure, with wave C of Subdeci degree being followed by a downtrending X wave that will remain above the 4th-wave starting point, and then by a second compound pattern, typically either a Flat or a Zigzag.

Over the long-term, within the expanding Diagonal Triangle that began in December 2018, wave 3 of Minor degree {-1] within wave 5 of Intermediate degree (no subscript) is still underway. Minor 3 began on February 23, 2020, after the crash that marked the beginning of the pandemic, from 2191.86. Internally, its child wave, the 5th of Minute degree, has been underway since October 30, 2020. Once Minor 3 is complete, the subsequent 4th wave should carry price down to the lower boundary of the triangle, presently around 1980 and declining further each day.

Learning and other resources. Elliott wave analysis provides context, not prophecy. As the 20th century semanticist Alfred Korzybski put it in his book Science and Sanity (1933), “The map is not the territory … The only usefulness of a map depends on similarity of structure between the empirical world and the map.” And I would add, in the ever-changing markets, we can judge that similarity of structure only after the fact.

See the menu page Analytical Methods for a rundown on where to go for information on Elliott wave analysis.

By Tim Bovee, Portland, Oregon, December 10, 2021

Disclaimer

Tim Bovee, Private Trader tracks the analysis and trades of a private trader for his own accounts. Nothing in this blog constitutes a recommendation to buy or sell stocks, options or any other financial instrument. The only purpose of this blog is to provide education and entertainment.

No trader is ever 100 percent successful in his or her trades. Trading in the stock and option markets is risky and uncertain. Each trader must make trading decisions for his or her own account, and take responsibility for the consequences.

License
Creative Commons License

All content on Tim Bovee, Private Trader by Timothy K. Bovee is licensed under a Creative Commons Attribution-ShareAlike 4.0 International License.

Based on a work at www.timbovee.com.
SP500 Analysis

3:30 p.m. New York time

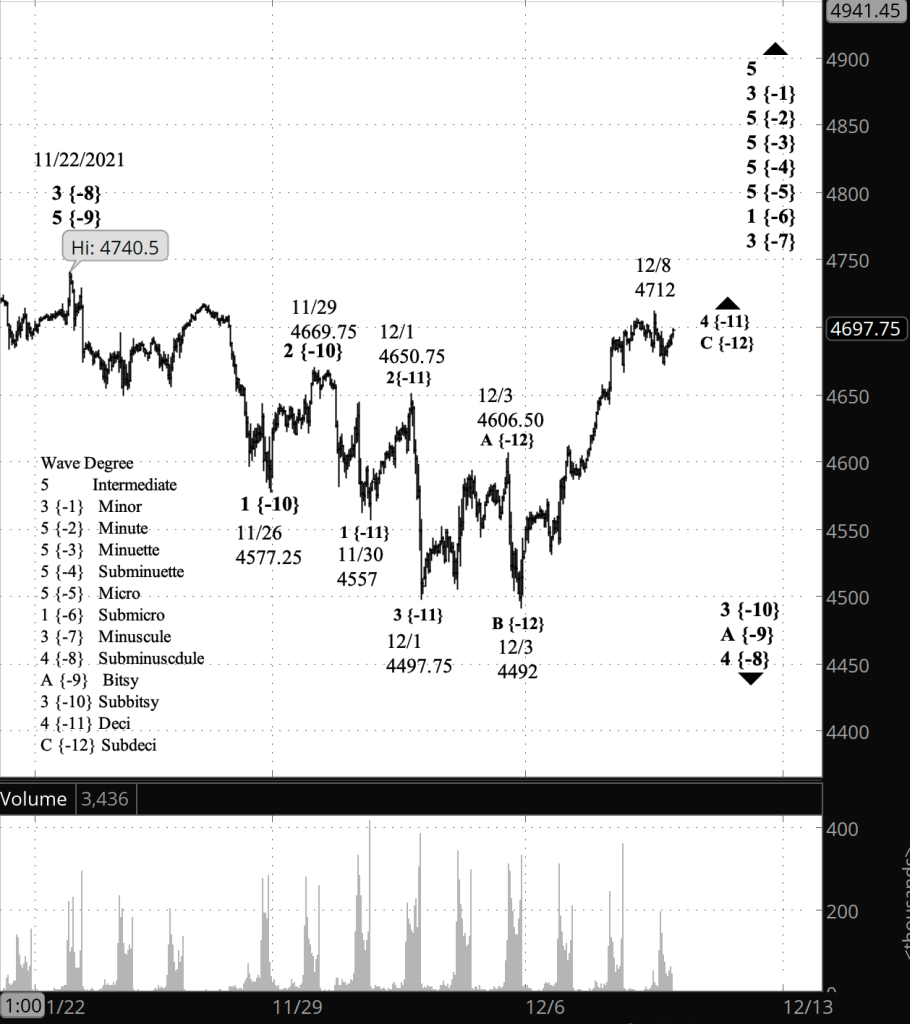
Half an hour before the closing bell. The S&P 500 moved below its prior low of the overnight session, to 4666.50 so far. The lower the the price goes, the high likelihood that the high of December 8, 4712, marked the end of the upward corrective pattern that began on December 1. No change in the analysis. I’ve updated the chart.

9:35 a.m. New York time

What’s happening now? The S&P 500 E-mini futures declined in overnight trading, reaching a low of 34.5 points below yesterday’s high.

What does it mean? The upward movement that began on December 3 — the final leg of the correction that began two days earlier — is still underway. I expect it to make a final push to the upside that will remain below the November 22 high of 4740.50. That final push will be followed by a decline that reaches below the start of the correction, 4497.75, continuing the downtrend that began on November 22.

What’s the alternative? Two points carry alternative analyses. First, the high of December 8 could possibly be the end of the correction. Secondly, the corrective pattern, when complete, could be followed by a downward movement that will remain above 4497.75, and then a second corrective pattern in a compound structure.

[S&P 500 E-mini futures at 3:30 p.m., 45-minute bars, with volume]

What does Elliott wave theory say? Under my principal analysis, the price presently in wave C of Subdeci degree — subscript {-12} — within wave 4 of Deci degree {-11}, which is an upward correction within declining wave 3 of of Subbitsy degree {-10} within wave A of Bitsy degree {-9} within wave 4 of Subminuscule degree {-8}, which began on October 6.

Under the first alternative analysis, wave C of Subdeci degree and its parent 4th wave ended with the December 8 peak, and wave 5 of Deci degree is in the early stages of its decline.

Under the second alternative analysis, wave C of Subdeci degree is still under — the same as in the principal analysis. It will be followed by an X wave to the downside and then a second corrective pattern, usually another Flat or perhaps a Zigzag.

Learning and other resources. Elliott wave analysis provides context, not prophecy. As the 20th century semanticist Alfred Korzybski put it in his book Science and Sanity (1933), “The map is not the territory … The only usefulness of a map depends on similarity of structure between the empirical world and the map.” And I would add, in the ever-changing markets, we can judge that similarity of structure only after the fact.

See the menu page Analytical Methods for a rundown on where to go for information on Elliott wave analysis.

By Tim Bovee, Portland, Oregon, December 9, 2021

Disclaimer

Tim Bovee, Private Trader tracks the analysis and trades of a private trader for his own accounts. Nothing in this blog constitutes a recommendation to buy or sell stocks, options or any other financial instrument. The only purpose of this blog is to provide education and entertainment.

No trader is ever 100 percent successful in his or her trades. Trading in the stock and option markets is risky and uncertain. Each trader must make trading decisions for his or her own account, and take responsibility for the consequences.

License
Creative Commons License

All content on Tim Bovee, Private Trader by Timothy K. Bovee is licensed under a Creative Commons Attribution-ShareAlike 4.0 International License.

Based on a work at www.timbovee.com.

SPY Trade

SPDR S&P 500 ETF Trust (SPY)

Lot 2

Update 12/20/2021: I exited my short bear call spread position on SPY 32 days before expiration, for a $0.57 debit per contract/share, a profit before fees of $75 per contract. Shares were trading at $453.80, down $14.75 from the entry level.

The Implied Volatility Rank at exit was 53.9%, up 18.9 points from the entry level.

Under my rules, I planned to exit this position when it had reached 50% or better of maximum potential profit. The exit came at 53.8% of max.

Shares declined by 3.1% over 12 days for a -96% annual rate. The options position produced a 131.6% return for a +4,002% annual rate.


I have entered a short bear call spread on SPY, using options that trade for the last time 44 days hence, on January 21. The premium is a $1.32 credit per contract share and the stock at the time of entry was priced at $468.45

The Implied Volatility Ratio stands at 35%.

Premium:$1.32Expire OTM
SPY-bull spreadStrikeOddsDelta
Puts
Long478.0069.0%35
Break-even476.3266.0%37.5
Short475.0063.0%40

The premium is 88% of the width of the positions short/long spread. The profit zone covers a 1.7% move to the upside.

The risk/reward ratio is 1.3:1, with maximum risk of $168 and maximum reward of $132 per contract.

How I chose the trade. The exchange-traded fund underlying the trade, SPY, very closely tracks the S&P 500 futures and index, which I track in my daily posts. By that analysis, $473.54 on SPY is a peak, attained on November 22, that, according to my Elliott wave analysis, won’t be crossed by the present wave C rise that began on December 3. So based on that analysis, I allowed myself very little space on the upside, since I see nearly all of the potential as being to the downside.

By Tim Bovee, Portland, Oregon, December 8, 2021

Disclaimer

Tim Bovee, Private Trader tracks the analysis and trades of a private trader for his own accounts. Nothing in this blog constitutes a recommendation to buy or sell stocks, options or any other financial instrument. The only purpose of this blog is to provide education and entertainment.

No trader is ever 100 percent successful in his or her trades. Trading in the stock and option markets is risky and uncertain. Each trader must make trading decisions for his or her own account, and take responsibility for the consequences.

License
Creative Commons License

All content on Tim Bovee, Private Trader by Timothy K. Bovee is licensed under a Creative Commons Attribution-ShareAlike 4.0 International License.

Based on a work at www.timbovee.com.

SP500 Analysis

3:30 p.m. New York time

Half an hour before the closing bells. The S&P 500 traded has traded in a narrow range during the session, remaining below the overnight high of 4712 on the futures. My analysis is unchanged. I’ve updated the chart.

2:30 p.m. New York time

My trades. I’ve entered a short bear call options spread on SPY and posted an analysis.

9:35 a.m. New York time

What’s happening now? The S&P 500 E-mini futures continued to rise in overnight trading, reaching 4712 before the opening bell.

What does it mean? The third leg of a correction that began December 1 is still underway. It will be followed by a decline that likely will reach below 4497.75, perhaps significantly so.

What’s the alternative? The end of the corrective pattern will be followed by a decline that remains above 4497.75, and then by a second uptrending corrective pattern.

[S&P 500 E-mini futures at 3:30 p.m., 40-minute bars, with volume]

What does Elliott wave theory say? The present rise is uptrending wave C of Subdeci degree — subscript {-12} — within uptrending wave 4 of Deci degree {-11}.

Under my principal analysis, the end of wave C will also mark the end of its parent 4th wave and the beginning of downtrending wave 5 of Deci degree, which typically will reach beyond the start of wave 4, which began on December 1 from 4497.75. A 5th wave sometimes comes up short — “truncated” is the term of art.

Under my alternative analysis, wave C of Subdeci degree will be followed by a declining X wave and then a new corrective pattern. The X wave will remain above the December 1 low.

Learning and other resources. Elliott wave analysis provides context, not prophecy. As the 20th century semanticist Alfred Korzybski put it in his book Science and Sanity (1933), “The map is not the territory … The only usefulness of a map depends on similarity of structure between the empirical world and the map.” And I would add, in the ever-changing markets, we can judge that similarity of structure only after the fact.

See the menu page Analytical Methods for a rundown on where to go for information on Elliott wave analysis.

By Tim Bovee, Portland, Oregon, December 8, 2021

Disclaimer

Tim Bovee, Private Trader tracks the analysis and trades of a private trader for his own accounts. Nothing in this blog constitutes a recommendation to buy or sell stocks, options or any other financial instrument. The only purpose of this blog is to provide education and entertainment.

No trader is ever 100 percent successful in his or her trades. Trading in the stock and option markets is risky and uncertain. Each trader must make trading decisions for his or her own account, and take responsibility for the consequences.

License
Creative Commons License

All content on Tim Bovee, Private Trader by Timothy K. Bovee is licensed under a Creative Commons Attribution-ShareAlike 4.0 International License.

Based on a work at www.timbovee.com.