PAYX Trade

Paychex Inc. (PAYX)

Update 1/10/2021: I exited my short iron condor position on PAYX 11 days before expiration, for a $1.03 debit per contract/share, a profit before fees of $92 per contract. Shares were trading at $126.63, up $0.19 from the entry level.

The Implied Volatility Rank at exit was 34.9%, down 11.5 points from the entry level.

I exited because the position exceeded 25% of maximum potential profit, my normal exit point for earnings plays. In the case of PAYX, there was a price gap down at the opening bell that allowed me to exit at 47.2% of maximum potential profit.

Shares rose by 0.2% over 20 days for a 2.7% annual rate. The options position produced an 89.2% return for a 1,630% annual rate.


I have entered a short iron condor spread on PAYX, using options that trade for the last time 31 days hence, on January 21. The premium is a $1.95 credit per contract share and the stock at the time of entry was priced at $126.43.

The Implied Volatility Ratio stands at 46.4%

Premium:$1.95Expire OTM
PAYX-iron condorStrikeOddsDelta
Calls
Long135.0084.0%19
Break-even131.9576.0%27.5
Short130.0068.0%36
Puts
Short120.0072.0%25
Break-even116.9578.0%19.5
Long115.0084.0%14

The premium is 39% of the width of the positions short/long spreads. The profit zone covers a 4.4% move to the upside and an 8.1% move to the downside.

The risk/reward ratio is 1.6:1, with maximum risk of $305 and maximum reward of $195 per contract.

How I chose the trade. The trade was placed to coincide with PAYX’s earnings announcement, before the opening bell on the day after entry. The short strikes were set to coincided with the expected move of $2.93 either way, based on options pricing, which gives a price range of $123.49 to $129.35.

By Tim Bovee, Portland, Oregon, December 21, 2021

Disclaimer

Tim Bovee, Private Trader tracks the analysis and trades of a private trader for his own accounts. Nothing in this blog constitutes a recommendation to buy or sell stocks, options or any other financial instrument. The only purpose of this blog is to provide education and entertainment.

No trader is ever 100 percent successful in his or her trades. Trading in the stock and option markets is risky and uncertain. Each trader must make trading decisions for his or her own account, and take responsibility for the consequences.

License
Creative Commons License

All content on Tim Bovee, Private Trader by Timothy K. Bovee is licensed under a Creative Commons Attribution-ShareAlike 4.0 International License.

Based on a work at www.timbovee.com.
SP500 Analysis

3:30 p.m. New York time

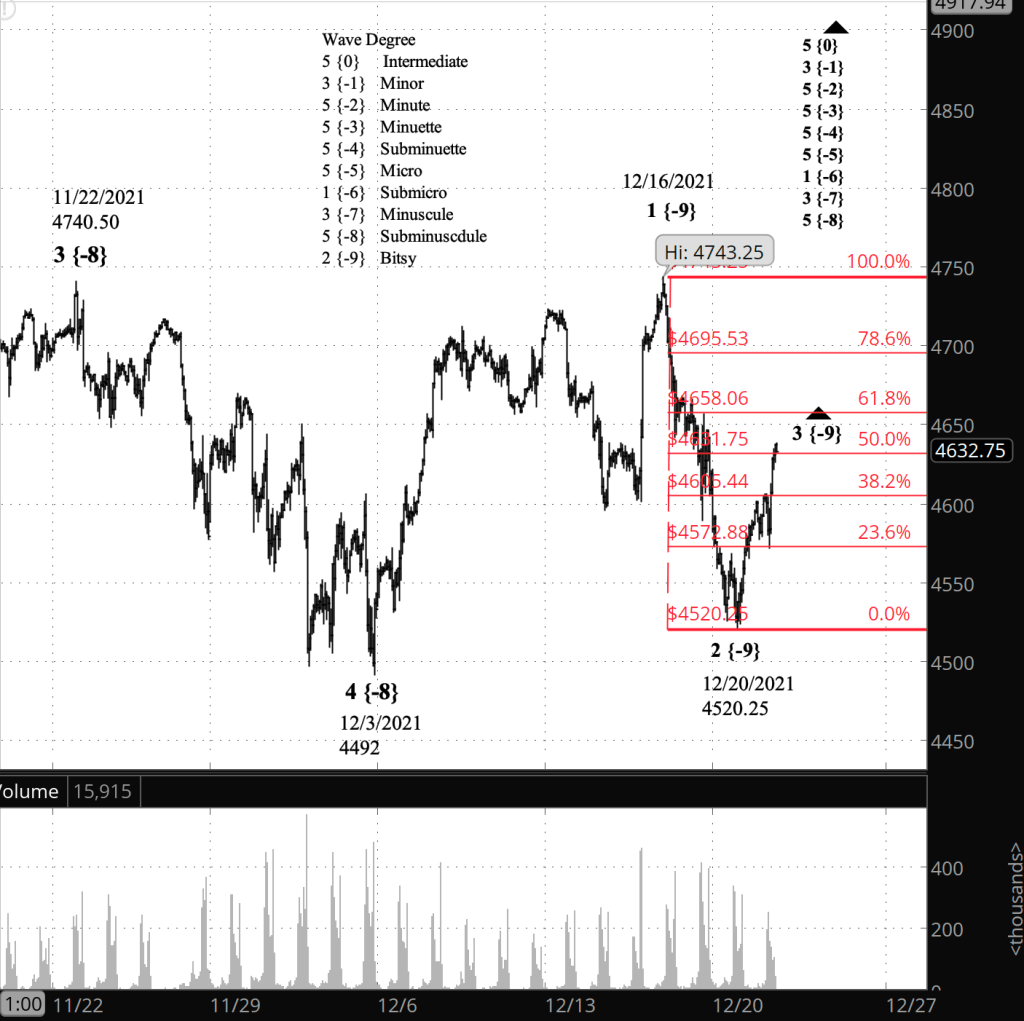
Half an hour before the closing bell. The S&P 500 rose during the trading session, reaching the 50% retracement level as the closing bell approached. Uptrending wave 5 of Bitsy degree {-9} continues.

2:25 p.m. New York time

New earnings play. I’ve entered an earnings play on PAYX and have posted an analysis of the trade.

9:35 a.m. New York time

What’s happening now? The S&P 500 E-mini futures rose overnight, so far retracing 38.2% of the decline that began on August 16 from a peak of 4743.25.

What does it mean? The correction that began on August 16 ended yesterday at 4520.25, and a rise that will ultimately reach new heights, beyond 4743.25, has begun.

What’s the alternative? Yesterday’s low can be read as being the end of the first leg of the correction, with the subsequent rise ending below 4743.25. That middle leg would be followed be a decline, perhaps approaching 4500.

[S&P 500 E-mini futures at 3:30 p.m., hourly bars, with volume]

What does Elliott wave theory say? Under my principal analysis, the decline from August 16 was wave 2 of Bitsy degree — subscript {-9} and has three waves internally, the number needed for completion. The rise from last night is wave 3 of Bitsy degree and will exhibit the power for which 3rd waves are famous. It will rise beyond the end of the preceding wave 1 of Bitsy degree, 4743.25, and typically quite a bit above that level.

The alternative analysis would read Bitsy wave 2 as so far having completed the 1st of its three waves, wave A, with the subsequent rise, wave B, coming up short of the beginning of Bitsy wave 1 before falling again in a C wave.

The retracement overnight paused at 38.2%, a Fibonacci level. (The Fibonacci ladder is on the chart in red.)

This is all happening within wave 5 of Subminuscule degree {-8}, whose completion will also mark the end of its parent, wave 3 of Minuscule degree. The subsequent 4th wave will be a downward correction larger than the correction we’ve just completed.

Trading plans. I’ll be taking a look at PAYX today as a potential earnings play.

Learning and other resources. Elliott wave analysis provides context, not prophecy. As the 20th century semanticist Alfred Korzybski put it this way in his book Science and Sanity (1933), “The map is not the territory … The only usefulness of a map depends on similarity of structure between the empirical world and the map.” And I would add, in the ever-changing markets, we can judge that similarity of structure only after the fact.

See the menu page Analytical Methods for a rundown on where to go for information on Elliott wave analysis.

By Tim Bovee, Portland, Oregon, December 21, 2021

Disclaimer

Tim Bovee, Private Trader tracks the analysis and trades of a private trader for his own accounts. Nothing in this blog constitutes a recommendation to buy or sell stocks, options or any other financial instrument. The only purpose of this blog is to provide education and entertainment.

No trader is ever 100 percent successful in his or her trades. Trading in the stock and option markets is risky and uncertain. Each trader must make trading decisions for his or her own account, and take responsibility for the consequences.

License
Creative Commons License

All content on Tim Bovee, Private Trader by Timothy K. Bovee is licensed under a Creative Commons Attribution-ShareAlike 4.0 International License.

Based on a work at www.timbovee.com.
GIS Trade

General Mills Inc. (GIS)

Update 12/23/2021: I exited my short iron condor position on GIS 29 days before expiration, for a $1.03 debit per contract/share, a profit before fees of $64 per contract. Shares were trading at $65.99, down $1.83 from the entry level.

The Implied Volatility Rank at exit was 23.9, down 48.1 points from the entry level.

I exited because the position reached 25% of maximum potential profit, my normal exit point for earnings plays.

Shares declined by 2.7% over three days for a 328% annual rate. The options position produced a 31.1% return for a 3,780% annual rate.


I have entered a short iron condor spread on GIS, using options that trade for the last time 32 days hence, on January 21. The premium is a $1.35 credit per contract share and the stock at the time of entry was priced at $67.81.

The Implied Volatility Ratio stands at 72.0%

Premium:$1.35Expire OTM
GIS-iron condorStrikeOddsDelta
Calls
Long75.0095.0%7
Break-even71.3583.5%19.5
Short70.0072.0%32
Puts
Short65.0069.0%28
Break-even61.3579.5%18
Long60.0090.0%8

The premium is 27% of the width of the position’s short/long spread. The profit zone covers a 5.2% move to the upside and a 10.5% move to the downside.

The risk/reward ratio is 2.7:1, with maximum risk of $265 and maximum reward of $135 per contract.

How I chose the trade. The trade was placed to coincide with GIS’s earnings announcement, beforer the opening bell on the day after entry. The short strikes were set to coincided with the expected move of $2.83 either way, based on options pricing, which gives a price range of $66.25 to $69.37

By Tim Bovee, Portland, Oregon, December 20, 2021

Disclaimer

Tim Bovee, Private Trader tracks the analysis and trades of a private trader for his own accounts. Nothing in this blog constitutes a recommendation to buy or sell stocks, options or any other financial instrument. The only purpose of this blog is to provide education and entertainment.

No trader is ever 100 percent successful in his or her trades. Trading in the stock and option markets is risky and uncertain. Each trader must make trading decisions for his or her own account, and take responsibility for the consequences.

License
Creative Commons License

All content on Tim Bovee, Private Trader by Timothy K. Bovee is licensed under a Creative Commons Attribution-ShareAlike 4.0 International License.

Based on a work at www.timbovee.com.
NKE Trade

Nike Inc. (NKE)

Update 1/3/2022: I exited my short iron condor position on NKE 18 days before expiration, for a $1.95 debit per contract/share, a profit before fees of $80 per contract. Shares were trading at $164.66, up $8.11 from the entry level.

The Implied Volatility Rank at exit was 21.9%, down 77 points from the entry level.

I exited because the position became profitable within 21 days of expiration, on the theory that if an unprofitable position becomes profitable that close to the end of the options’ lifespan, then best to grab the money and run.

Shares rose by 5.2% over 14 days for a 135% annual rate. The options position produced a 20.5% return for a 535% annual rate.


I have entered a short iron condor spread on NKE, using options that trade for the last time 32 days hence, on January 21. The premium is a $2.35 credit per contract share and the stock at the time of entry was priced at $156.55.

The Implied Volatility Ratio stands at 98.9%

Premium:$2.35Expire OTM
NKE-iron condorStrikeOddsDelta
Calls
Long170.0080.0%25
Break-even167.3575.5%29.5
Short165.0071.0%34
Puts
Short145.0069.0%27
Break-even142.3573.0%23.5
Long140.0077.0%20

The premium is 47% of the width of the positions short/long spread. The profit zone covers a 6.9% move to the upside and a 10.0% move to the downside.

The risk/reward ratio is 1.1:1, with maximum risk of $265 and maximum reward of $235 per contract.

How I chose the trade. The trade was placed to coincide with NKE’s earnings announcement, after the opening bell on the day of entry. The short strikes were set to coincided with the expected move of $9.36 either way, based on options pricing, which gives a price range of 146.48 to 165.20.

By Tim Bovee, Portland, Oregon, December 20, 2021

Disclaimer

Tim Bovee, Private Trader tracks the analysis and trades of a private trader for his own accounts. Nothing in this blog constitutes a recommendation to buy or sell stocks, options or any other financial instrument. The only purpose of this blog is to provide education and entertainment.

No trader is ever 100 percent successful in his or her trades. Trading in the stock and option markets is risky and uncertain. Each trader must make trading decisions for his or her own account, and take responsibility for the consequences.

License
Creative Commons License

All content on Tim Bovee, Private Trader by Timothy K. Bovee is licensed under a Creative Commons Attribution-ShareAlike 4.0 International License.

Based on a work at www.timbovee.com.
MU Trade

Micron Technology Inc. (MU)

Update 1/21/2022: The remaining bull put spread on MU expires today. I had hoped it would expire without value, but on the last day it moved from $0.00 to $0.05 per contract share, and so I exited to avoid assignment.

For today’s bull put spread transaction, I received a $1.14 credit per contract share and paid a $5 debit to exit. The transaction produced a $109 return per contract over 32 days, or a 2,180.0% profit, for a 24,866% annual rate.

Combining the separate spreads that composed the iron condor, here’s the analysis.

I exited my short iron condor position on MU, in two transactions, on the day of trading before expiration, for a $3.65 debit per contract/share, a loss before fees of $266 per contract. Shares were trading at $83.29, up $1.69 from the entry level.

The Implied Volatility Rank at exit was 65.6%, down 27.5 points from the entry level.

Shares rose by 2.1% over 32 days for a 23.6% annual rate. The options position produced a 36.4% loss for a -416% annual rate.


Update 12/30/2021: MU goes ex-dividend tomorrow, putting my in-the-money short call at risk of exercise. I exited the calls — a bear call spread — and retained the puts — a bull put spread — in the expectation that that they will grow more profitable as expiration approaches. After exiting the puts I’ll combine the two spreads’ results to show the outcome for the original short iron condor. For the calls that I exited, I received a $1.18 credit per contract share, and paid a $3.60 debit when I exited. The transactions produced a $456 loss per contract, a loss of 63.3%. Shares at exit were trading at $137.53, up $55.93 from their entry price. The IV Rank at the close was 35.5%, down 58.6 points from the entry level.


I have entered a short iron condor spread on MU, using options that trade for the last time 32 days hence, on January 21. The premium is a $2.32 credit per contract share and the stock at the time of entry was priced at $81.60.

The Implied Volatility Ratio stands at 93.1%

Premium:$2.32Expire OTM
MU-iron condorStrikeOddsDelta
Calls
Long92.0081.0%24
Break-even89.3275.5%30
Short87.0070.0%36
Puts
Short75.0066.0%29
Break-even72.3272.5%23
Long70.0079.0%17

The premium is 46.4% of the width of the position’s short/long spread. The profit zone covers a 9.5% move to the upside and a 12.8% move to the downside.

The risk/reward ratio is 1.2:1, with maximum risk of $268 and maximum reward of $232 per contract.

How I chose the trade. The trade was placed to coincide with MU’s earnings announcement, before the opening bell on the day after entry. The short strikes were set to coincided with the expected move of $5.84 either way, based on options pricing, which gives a price range of 75.29 to 86.97.

By Tim Bovee, Portland, Oregon, December 20, 2021

Disclaimer

Tim Bovee, Private Trader tracks the analysis and trades of a private trader for his own accounts. Nothing in this blog constitutes a recommendation to buy or sell stocks, options or any other financial instrument. The only purpose of this blog is to provide education and entertainment.

No trader is ever 100 percent successful in his or her trades. Trading in the stock and option markets is risky and uncertain. Each trader must make trading decisions for his or her own account, and take responsibility for the consequences.

License
Creative Commons License

All content on Tim Bovee, Private Trader by Timothy K. Bovee is licensed under a Creative Commons Attribution-ShareAlike 4.0 International License.

Based on a work at www.timbovee.com.
SP500 Analysis

3:30 p.m. New York time

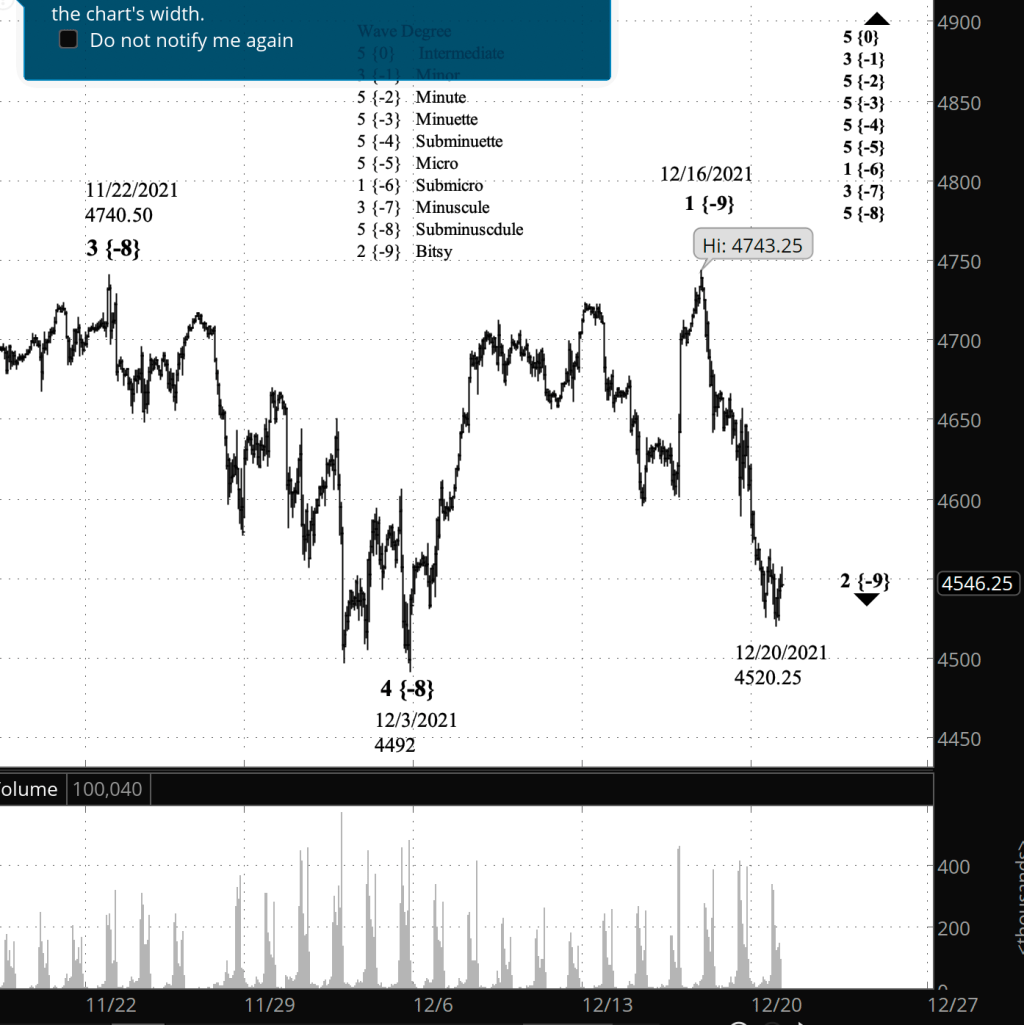
Half an hour before the closing bell. The S&P 500 continued its downward course throughout the day, with no significant upward moves. The low point attained so far is 4520.25 on the futures, 4531.10 on the index.

If the price reaches below 4492 on the futures, the starting point of uptrending wave 1 of Bitsy degree, which preceded the present wave 2 decline, then the principal analysis will need to be redone, since under the rules of Elliott wave analysis, if a “2nd wave” moves beyond the start of the preceding 1st wave, then it isn’t a 2nd wave.

No change in the analysis, and I’ve updated the chart.

2:35 p.m. New York time

Another earnings play. I’ve entered a short iron condor earnings play on GIS and have posted an analysis.

2:20 p.m. New York time

Earnings plays. I’ve entered two earnings plays today, short iron condors on two stocks, and have posted analyses for both MU and NKE. A third earnings play, on GIS, has not yet been filled.

10:35 a.m. New York time

My trades. I exited my short bear call spread position on SPY for a 131.5% profit and have updated the analysis with results.

9:35 a.m. New York time

What’s happening now? The S&P 500 E-mini futures declined after trading resumed on Sunday, to 4526.25, and then, shortly before midnight, reversed in a so-far small rise.

What does it mean? The first leg of the downward correction that began on December 16 continues and will be followed by a rise to new heights, beyond the 4743.25 attained on that date.

What’s the alternative? The overnight low could have marked the end of correction, but the internal structure suggests otherwise. Also, the high of December 16 could mark the end of the rise that began on December 3, and the subsequent decline in that case would be the beginning of a new downtrend.

Divergence. The present count is based on the all-time high set on December 16 by the futures. However, for the S&P 500 index, which fluctuates only during normal U.S. market hours, the highest high remains that set on November 22, at 4743.83. The highest high for SPY, the exchange-traded fund that tracks the index, was also set on November 22, at 473.54.

In the past such divergences have eventually ended, with the index and the ETF catching up with the futures, which trade 24/7 Sunday evening through Friday afternoon. I’ve seen analysts claim that the three products can be analyzed as separate entities, but I don’t buy that. They’re tracking the same collection of stocks, and any divergence is simply an artifact of the trading schedule. In my analysis, I consider the constantly traded futures to be the best reflection of the public mood’s impact on the S&P 500.

[S&P 500 E-mini futures at 3:34 p.m., hourly bars, with volume]

What does Elliott wave theory say? Under my principal analysis, I’ve labeled the decline from the December 16 high as wave 2 of Bitsy degree {-9} within rising wave 5 of Subminuscule degree {-8}. But Bitsy 2 could well be a degree lower.

Under the first alternative, Bitsy 2 ended with the Sunday night low. Under the second alternative, the December 16 high marked the end of wave 5 of Subminuscule degree, and the subsequent decline is wave 1 of a new downtrend that will carry the price significantly lower.

Earnings plays. I’ll be looking at three earnings plays today: MU, NKE and GIS.

Learning and other resources. Elliott wave analysis provides context, not prophecy. As the 20th century semanticist Alfred Korzybski put it this way in his book Science and Sanity (1933), “The map is not the territory … The only usefulness of a map depends on similarity of structure between the empirical world and the map.” And I would add, in the ever-changing markets, we can judge that similarity of structure only after the fact.

See the menu page Analytical Methods for a rundown on where to go for information on Elliott wave analysis.

By Tim Bovee, Portland, Oregon, December 20, 2021

Disclaimer

Tim Bovee, Private Trader tracks the analysis and trades of a private trader for his own accounts. Nothing in this blog constitutes a recommendation to buy or sell stocks, options or any other financial instrument. The only purpose of this blog is to provide education and entertainment.

No trader is ever 100 percent successful in his or her trades. Trading in the stock and option markets is risky and uncertain. Each trader must make trading decisions for his or her own account, and take responsibility for the consequences.

License
Creative Commons License

All content on Tim Bovee, Private Trader by Timothy K. Bovee is licensed under a Creative Commons Attribution-ShareAlike 4.0 International License.

Based on a work at www.timbovee.com.

SP500 Analysis

3:30 p.m. New York time

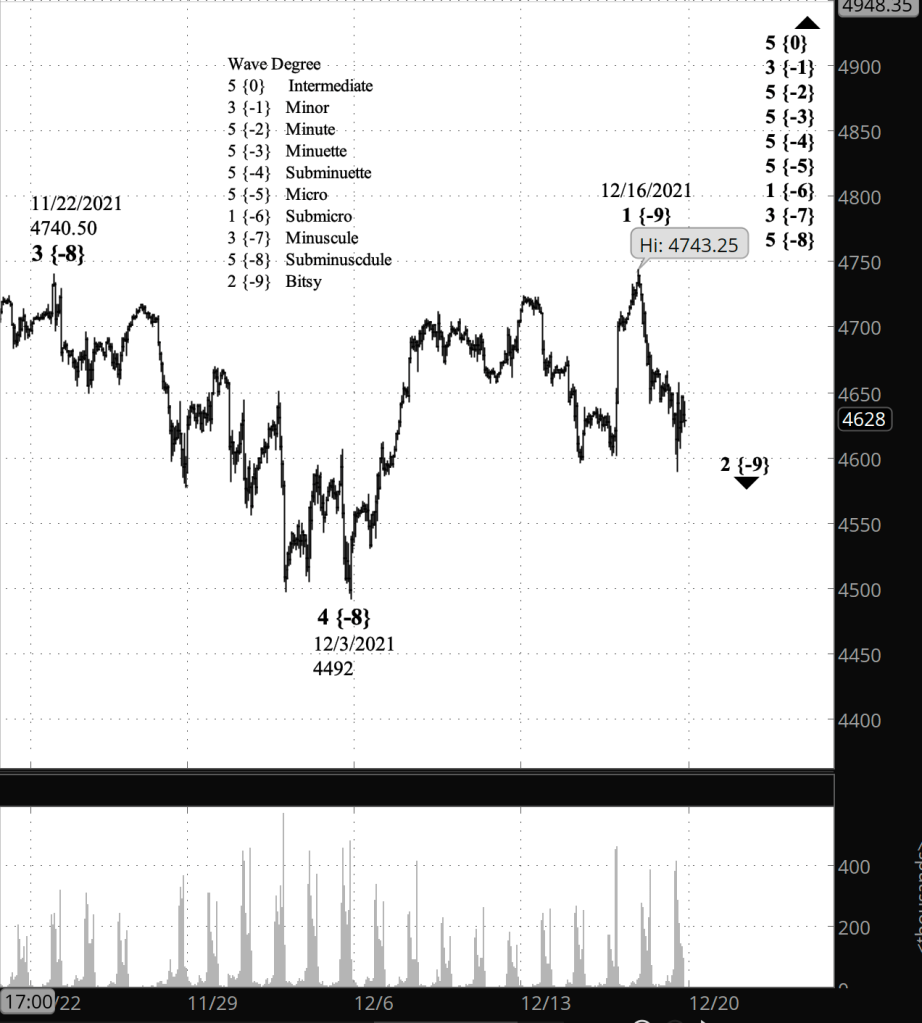
Half an hour before the closing bell. The S&P 500 futures continued to decline during the session, so far reaching a low of 4590. No change in the analysis. I’ve updated the upper chart.

12:45 p.m. New York time

Earnings play exit. I’ve exited my short iron condor position on FDX for a 19.4% return and have updated the analysis with full results.

9:50 a.m. New York time

My trades. The two short iron condor earnings plays I entered into yesterday, FDX and DRI, have overshot boundaries. FDX is showing a loss at present, and DRI a 9% profit. I shall wait a bit before exiting, in the hopes that the prices will return closer to their pre-announcement levels.

9:35 a.m. New York time

What’s happening now? The S&P 500 E-mini futures fell in overnight trading, reaching 4620.50 at the opening bell.

What does it mean? The decline marks a correction of the rise that began on December 3.

What’s the alternative? None so far today.

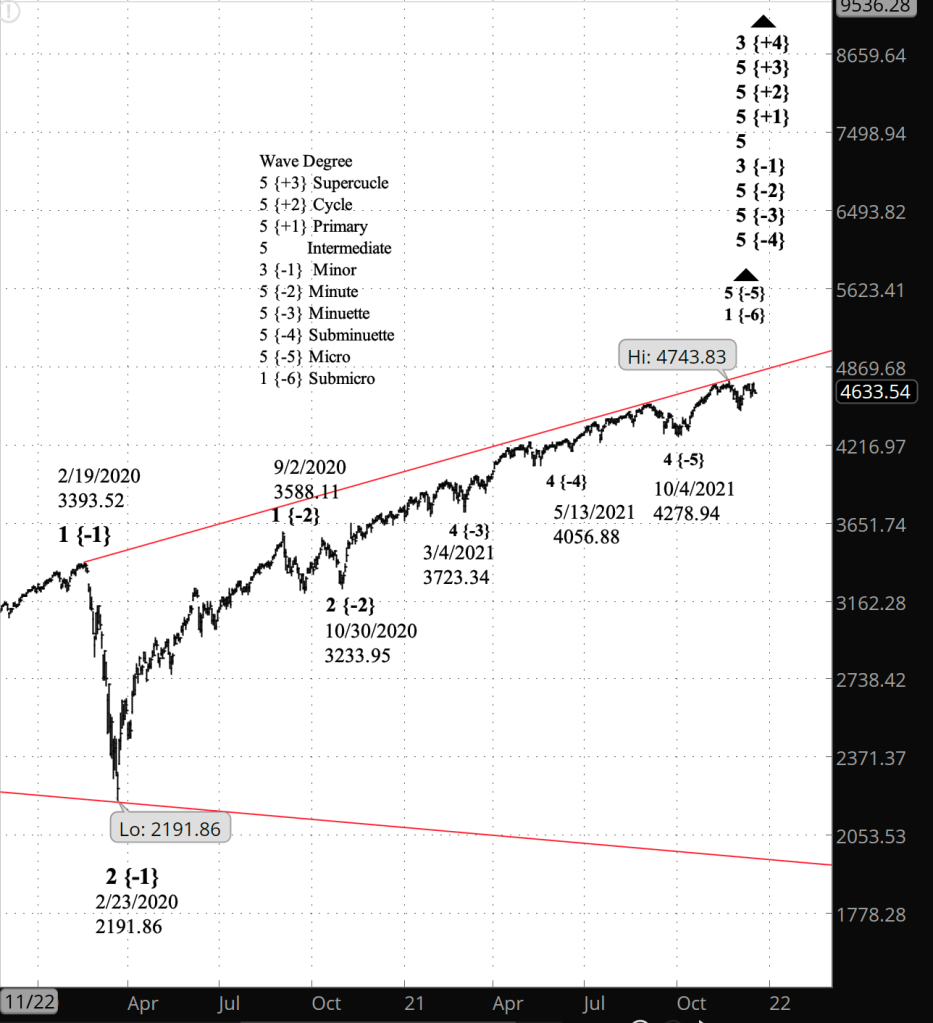
Charts. The upper chart is a close-up view beginning in late November. The lower chart is a long view, beginning in November 2019; it shows the early pandemic crash, and the redlines are the boundaries of an expanding Diagonal Triangle that began in December 2018.

[S&P 500 E-mini futures at 3:30 p.m., hourly bars, with volume]
[S&P 500 index at 9:35 a.m., daily bars]

What does Elliott wave theory say? I reworked the count to correct some inelegancies in wave length, in particular the decline overnight, which feels much more like a 2nd wave than a 4th.

Under my principal analysis, wave 2 of Bitsy degree — subscript {-9} — is underway and appears to be close to completing its first internal wave, A of Subbitsy degree {-10}. The structure is part of wave 5 of Subminuscule degree {-8}, which began on December 3.

Moving up the chain, the parent of Subminuscule 5 is wave 3 of Minscule degree {-7}, and the completion of Subminuscule 5 will mark the beginning of a 4th-wave correction at the Minuscule degree.

No change in the big picture. Wave of 1 of Submicro degree {-6} is still underway. Its parent, wave 5 of Micro degree {-5}, is the first in a line of 5th degrees stretching up to wave 5 of Minute degree {-2} within wave 3 of Minor degree {-1}.

Learning and other resources. Elliott wave analysis provides context, not prophecy. As the 20th century semanticist Alfred Korzybski put it this way in his book Science and Sanity (1933), “The map is not the territory … The only usefulness of a map depends on similarity of structure between the empirical world and the map.” And I would add, in the ever-changing markets, we can judge that similarity of structure only after the fact.

See the menu page Analytical Methods for a rundown on where to go for information on Elliott wave analysis.

By Tim Bovee, Portland, Oregon, December 17, 2021

Disclaimer

Tim Bovee, Private Trader tracks the analysis and trades of a private trader for his own accounts. Nothing in this blog constitutes a recommendation to buy or sell stocks, options or any other financial instrument. The only purpose of this blog is to provide education and entertainment.

No trader is ever 100 percent successful in his or her trades. Trading in the stock and option markets is risky and uncertain. Each trader must make trading decisions for his or her own account, and take responsibility for the consequences.

License
Creative Commons License

All content on Tim Bovee, Private Trader by Timothy K. Bovee is licensed under a Creative Commons Attribution-ShareAlike 4.0 International License.

Based on a work at www.timbovee.com.

FDX Trade

FDX Corp. (FDX)

Update 12/17/2021: I exited my short iron condor spread position on FDX 35 days before expiration and one day after the company published earnings, for a $3.35 debit per contract/share, a profit before fees of $65 per contract. Shares were trading at $251.18, up $10.35 from the entry level.

The Implied Volatility Rank at exit was 43.3%, down 44.8 points from the entry level.

After earnings were published after the closing bell on December 16, the share price rose to $259.50, dropped, and then rose further to $260.50, both above the expected move upside target of $256.75. The price declined somewhat during the day prior to my exit, improving the profit of the position.

Shares rose by 4.3% over one day for a 1,569% annual rate. The options position produced a 19.4% return for a 7,082% annual rate.


I have entered a short iron condor spread on FDX, using options that trade for the last time 36 days hence, on January 21. The premium is a $4.00 credit per contract share and the stock at the time of entry was priced at $240.83.

The Implied Volatility Ratio stands at 88.1%

Premium:$4.00Expire OTM
FDX-iron condorStrikeOddsDelta
Calls
Long270.0083.0%21
Break-even264.0079.0%25.5
Short260.0075.0%30
Puts
Short220.0073.0%23
Break-even214.0077.0%19
Long210.0081.0%15

The premium is 40% of the width of the positions short/long spread. The profit zone covers a 9.6% move to the upside and a 12.5% move to the downside, for total coverage of 22.2%.

The risk/reward ratio is 1.5:1, with maximum risk of $600 and maximum reward of $400 per contract.

How I chose the the trade. The position is timed to coincide with FDX’s publication of earnings after the closing bell and covers the expected move after that announcement, as inferred from the pricing of options expiring on December 17. The expected move would keep the price between $226.35 and $256.75.

By Tim Bovee, Portland, Oregon, December 16, 2021

Disclaimer

Tim Bovee, Private Trader tracks the analysis and trades of a private trader for his own accounts. Nothing in this blog constitutes a recommendation to buy or sell stocks, options or any other financial instrument. The only purpose of this blog is to provide education and entertainment.

No trader is ever 100 percent successful in his or her trades. Trading in the stock and option markets is risky and uncertain. Each trader must make trading decisions for his or her own account, and take responsibility for the consequences.

License
Creative Commons License

All content on Tim Bovee, Private Trader by Timothy K. Bovee is licensed under a Creative Commons Attribution-ShareAlike 4.0 International License.

Based on a work at www.timbovee.com.

DRI Trade

Darden Restaurants Inc. (DRI)

Update 12/23/2021: I exited my short iron condor position on DRI 29 days before expiration, for a $2.05 debit per contract/share, a profit before fees of $68 per contract. Shares were trading at $147.08, down $1.15 from the entry level.

The Implied Volatility Rank at exit was 35.9%, down 31.9 points from the entry level.

I exited because the position reached 25% of maximum potential profit, my normal exit point for earnings plays.

Shares declined by 0.8% over seven days for a +41% annual rate. The options position produced a 33.2% return for a +1,730% annual rate.


I have entered a short iron condor spread on DRI, using options that trade for the last time 36 days hence, on January 21. The premium is a $2.73 credit per contract share and the stock at the time of entry was priced at $148.23.

The Implied Volatility Ratio stands at 67.8%

Premium:$2.73Expire OTM
DRI-iron condorStrikeOddsDelta
Calls
Long160.0078.0%26
Break-even157.7358.5%31.5
Short155.0039.0%37
Puts
Short140.0063.0%32
Break-even137.7367.5%28
Long135.0072.0%24

The premium is 54.6% of the width of the position’s short/long spread. The profit zone covers a 6.4% move to the upside and a 7.6% move to the downside, for total coverage of 14%.

The risk/reward ratio is 0.8:1, with maximum risk of $227 and maximum reward of $273 per contract.

How I chose the trade. DRI publishes earnings after the opening bell on Friday, December 17. This position covers the expected move post-earnings as implied by the pricing for options expiring December 17. The expected move would keep the price between $140.52 and $155.90.

By Tim Bovee, Portland, Oregon, December 16, 2021

Disclaimer

Tim Bovee, Private Trader tracks the analysis and trades of a private trader for his own accounts. Nothing in this blog constitutes a recommendation to buy or sell stocks, options or any other financial instrument. The only purpose of this blog is to provide education and entertainment.

No trader is ever 100 percent successful in his or her trades. Trading in the stock and option markets is risky and uncertain. Each trader must make trading decisions for his or her own account, and take responsibility for the consequences.

License
Creative Commons License

All content on Tim Bovee, Private Trader by Timothy K. Bovee is licensed under a Creative Commons Attribution-ShareAlike 4.0 International License.

Based on a work at www.timbovee.com.

SP500 Analysis

3:30 p.m. New York time

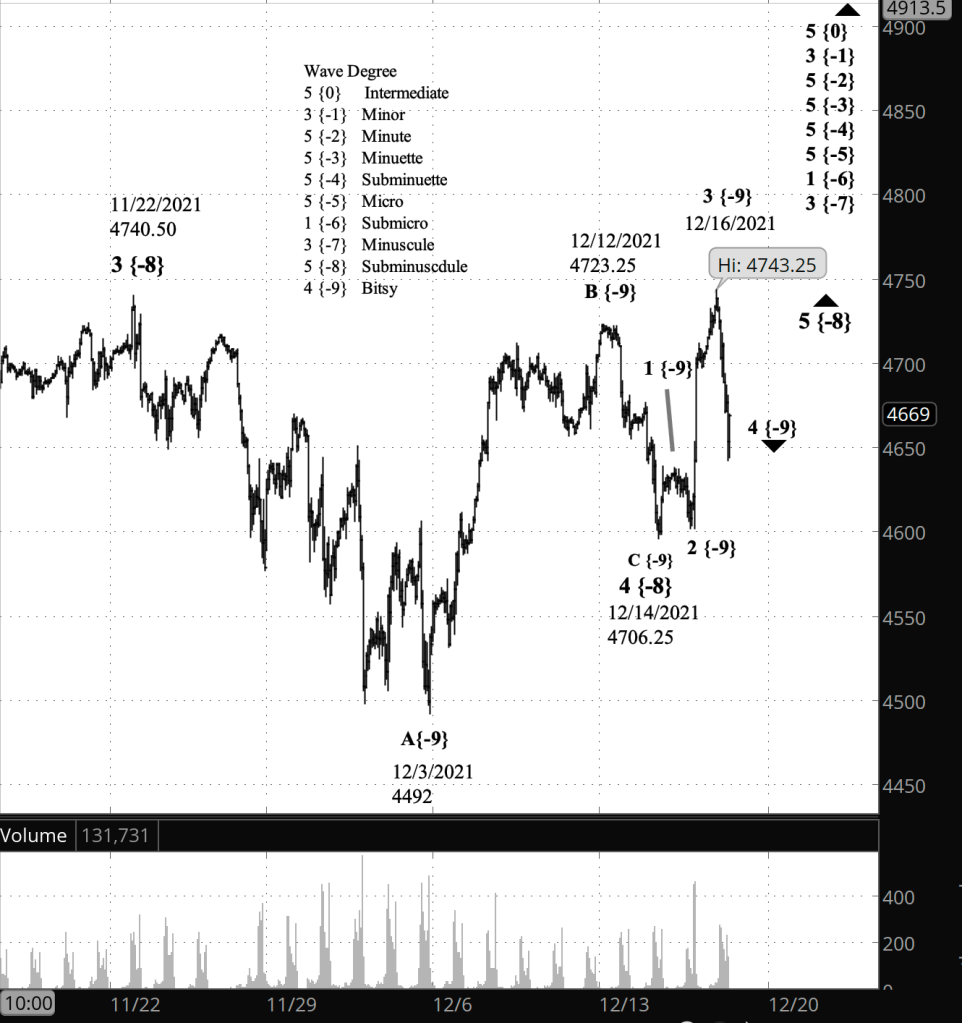
Half an hour before the closing bell. The S&P 500 declined during the session, reaching 4642 at the low point of the futures. I’m counting the overnight peak, 4743.25, as being the end of wave 3 of Bitsy degree, and the subsequent decline as a 4th wave correction. This early in a trend it’s hard to say what degree the waves are. The patterns are clear, but not where they fit into the bigger picture. The overnight peak could just as well be a degree or two lower that I’ve marked it. Nonetheless, no change in the analysis. I’ve updated the chart.

2:30 p.m. New York time

My trades. I’ve entered two short iron condor positions timed to coincide with earnings announcements and have published analyses, of FDX and DRI.

10:15 a.m. New York time

Trade exit. I’ve exited my short iron condor earnings play on LEN for a 12.5% profit before fees and have updated the analysis with results.

9:40 a.m. New York time

What’s happening now? The S&P 500 E-mini futures reached a new all-time high, 4743.25, in overnight trading, eclipsing the prior peak, 4740.50, attained on November 22.

What does it mean? The downward correction that began on November 22 ended on December 14, and the final leg of the uptrend that began on October 6, from 4273.75, is now underway.

What’s the alternative? I have none at this point. The chart has a great deal of clarity.

[S&P 500 E-mini futures at 3:30 p.m., hourly bars, with volume]

What does Elliott wave theory say? The new peak means that wave 4 of Subminuscule degree — subscript {-8} — ended on December 14 with a seriously shortened C wave, internally, and that Subminuscule wave 5 began on that date, and this morning before the opening bell eclipsed the end point of wave 3 of Subminuscule degree on November 22. Fifth waves have no limits, beyond those imposed by the need for them to be proportional to the rest of the larger wave of which they are a part. So this 5th could go high, or end quickly. There’s nothing in Elliott at this point to guide our expectations.

The uptrending higher degrees remain unchanged: Minuscule 3 {-7} all the way up to Intermediate 5 {0} seven levels higher.

Interestingly, the S&P 500 index has not hit a new peak, and so, not for the first time, we have a divergence between the futures, which trade overnight, and the index, which doesn’t track change between the closing and opening bells.

My trades. I’ll be looking at two symbols as potential earnings plays today. FDX publishes earnings today after the closing bell, and DRI announces on Friday before the opening bell.

Learning and other resources. Elliott wave analysis provides context, not prophecy. As the 20th century semanticist Alfred Korzybski put it this way in his book Science and Sanity (1933), “The map is not the territory … The only usefulness of a map depends on similarity of structure between the empirical world and the map.” And I would add, in the ever-changing markets, we can judge that similarity of structure only after the fact.

See the menu page Analytical Methods for a rundown on where to go for information on Elliott wave analysis.

By Tim Bovee, Portland, Oregon, December 16, 2021

Disclaimer

Tim Bovee, Private Trader tracks the analysis and trades of a private trader for his own accounts. Nothing in this blog constitutes a recommendation to buy or sell stocks, options or any other financial instrument. The only purpose of this blog is to provide education and entertainment.

No trader is ever 100 percent successful in his or her trades. Trading in the stock and option markets is risky and uncertain. Each trader must make trading decisions for his or her own account, and take responsibility for the consequences.

License
Creative Commons License

All content on Tim Bovee, Private Trader by Timothy K. Bovee is licensed under a Creative Commons Attribution-ShareAlike 4.0 International License.

Based on a work at www.timbovee.com.