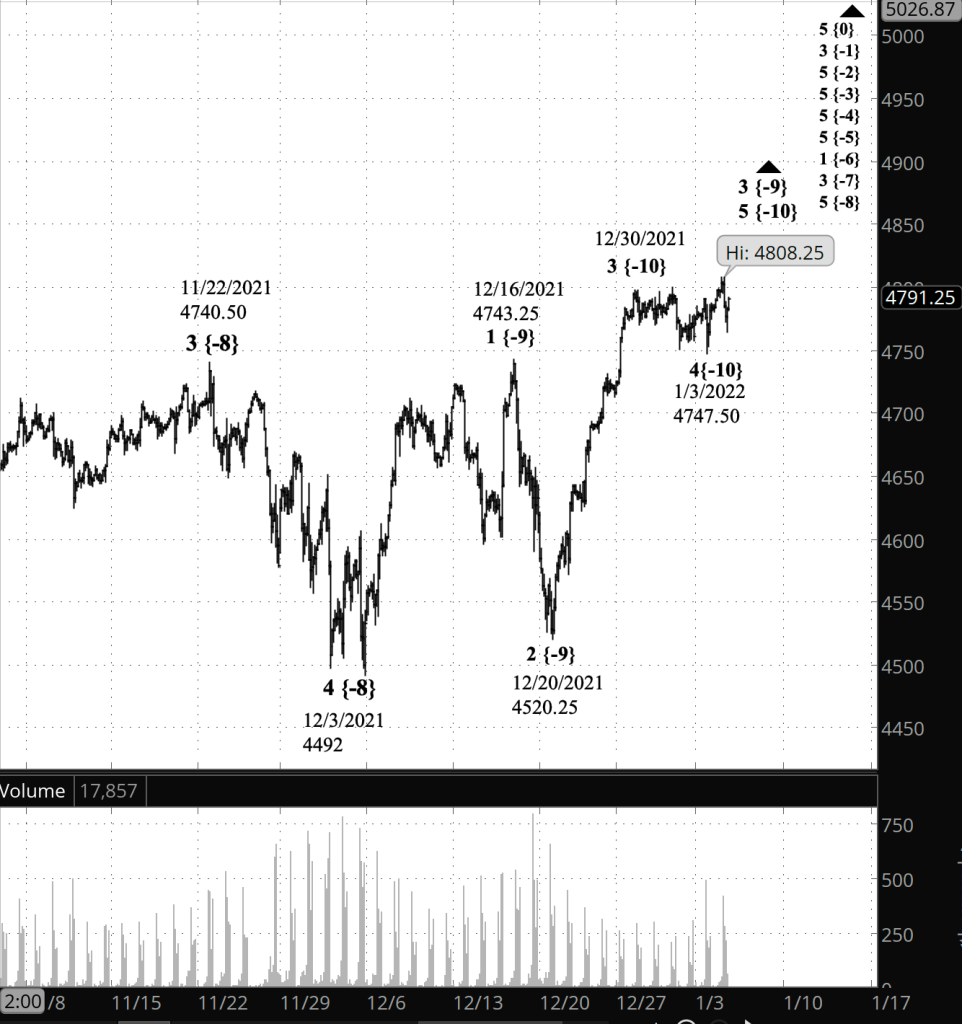
Half an hour before the closing bell. The S&P 500 futures fell more than 40 points during the day and then reversed, remaining below the peak set this morning, 4808.25. No change in the analysis. I’ve updated the chart.
10:55 a.m. New York time
Options trades? Not today. I attempted to build vertical options spreads for the five prospects listed below. None of them worked out to my satisfaction: Too much risk for too little reward. So I’m rejecting them all and will reserve my funds for earnings plays. The 4th quarter of 2021 earnings announcements will begin in earnest the week beginning January 16, with two early prospects lined up for Wednesday.
10 a.m. New York time
Trades today. I’ve bought shares of ABG, which has been rated “strong buy” according to Zacks‘ reading of analyst opinion. This is the optimal day to enter options positions expiring February 18, and I’ll be looking at five prospects: FXI, NIO, EWZ, XBI and FXE.
9:35 a.m. New York time
What’s happening now? The S&P 500 E-mini futures rose to a new peak, 4807.50, in overnight trading.
What does it mean? The low-level correction that had been underway since December 30 ended on Monday, and a push to the upside has begun. It is the last leg of the rise that began on December 20.
What’s the alternative? None in sight at the moment. Which isn’t to say that ambiguities won’t develop.
[S&P 500 E-mini futures at 3:30 p.m., 2-hour bars, with volume]
What does Elliott wave theory say? The rise that began on January 3 is wave 5 {-10} within wave 3 {-9}, which in turn is a subwave of the rise that began on December 3 from 4492: Wave 5 {-8}. When 3 {-9} is complete, it will be followed by a 4th wave correction, and then an even greater push to new heights, wave 5 {-9}.The completion of 5 {-9} will mark the end of wave 5 {-8} and, one degree higher, of wave 3 {-7}.
Learning and other resources. Elliott wave analysis provides context, not prophecy. As the 20th century semanticist Alfred Korzybski put it this way in his book Science and Sanity (1933), “The map is not the territory … The only usefulness of a map depends on similarity of structure between the empirical world and the map.” And I would add, in the ever-changing markets, we can judge that similarity of structure only after the fact.
See the menu page Analytical Methods for a rundown on where to go for information on Elliott wave analysis.
By Tim Bovee, Portland, Oregon, January 4, 2022
Disclaimer
Tim Bovee, Private Trader tracks the analysis and trades of a private trader for his own accounts. Nothing in this blog constitutes a recommendation to buy or sell stocks, options or any other financial instrument. The only purpose of this blog is to provide education and entertainment.
No trader is ever 100 percent successful in his or her trades. Trading in the stock and option markets is risky and uncertain. Each trader must make trading decisions for his or her own account, and take responsibility for the consequences.
Changes, beginning today: A new title for this daily post, reflecting the broader range of material it covers. And in the Elliott wave analysis section, no more degree names. I’ll rely solely on the wave number and subscript in curly brackets. For details, click here.
3:30 p.m. New York time
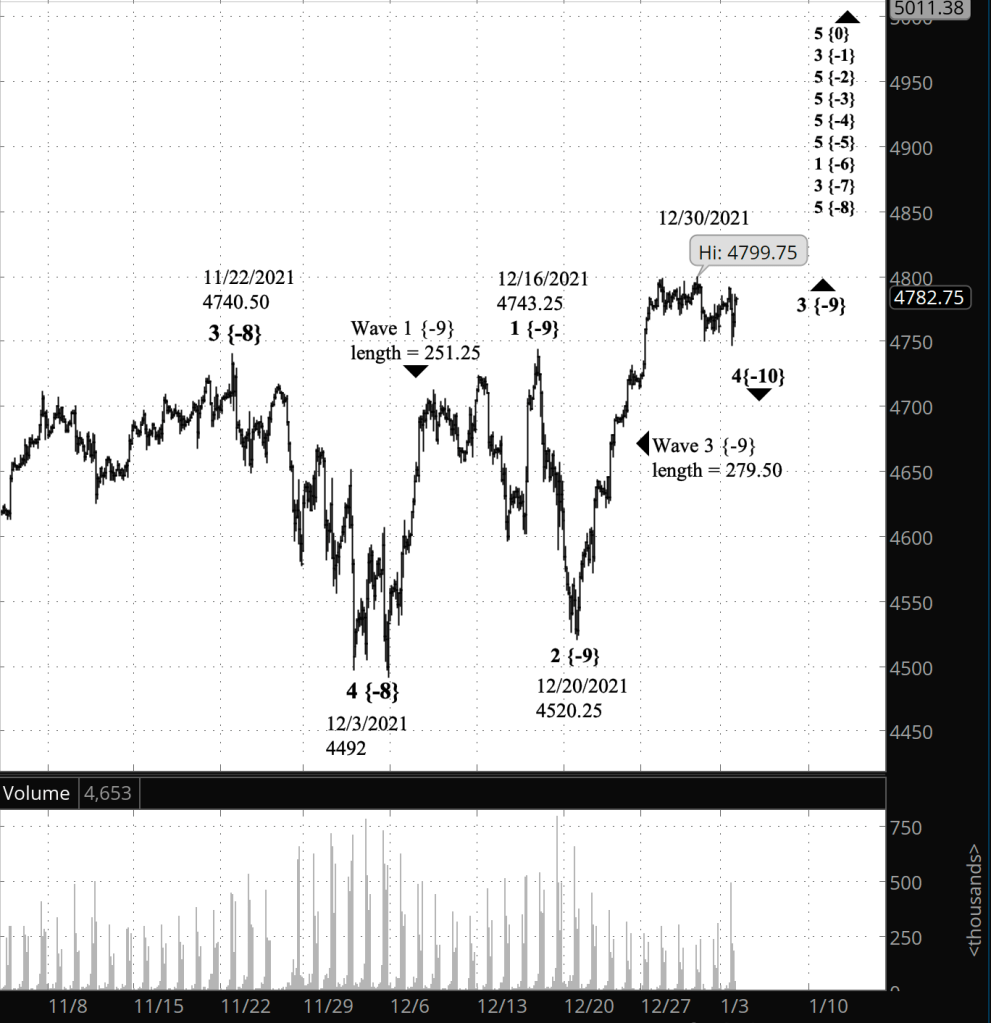
Half an hour before the closing bell. The S&P 500 continued its low-level downward correction within a series of ever larger uptrending movements. Wave 4 {-10} within wave 3 {-9} within wave 5 {-8} continues. No change in the analysis. I’ve updated the chart.
10:25 a.m. New York time
Options earnings play exited. My short iron condor options position on NKE, an earnings play, turned profitable after 14 days, and exited for a 20.5% gain. I’ve updated the analysis with results.
9:45 a.m. New York time
Trades today. No earnings plays on the books for today. JEF was a possibility for options, but the time and even the date were uncertain, so I’m passing. I plan no earnings plays using shares. Non-earnings trades: I’ll be opening a position on LPX. It was just promoted to “strong buy” by Zacks, based on analyst opinions. It’s considered to be a value play, as upward momentum and is in an industry that ranks in the top 8% of industries when it comes to analyst “buy” opinions.
9:35 a.m. New York time
What’s happening now? The S&P 500 E-mini futures continued to rise when trading resumed Sunday evening and the price remains slightly below the December 30 peak of 4799.25.
What does it mean? By my principal count, the rise that began December 20 from 4520.25 is still underway and will push beyond the peak to new heights.
What’s the alternative? The December 30 peak can be seen as the end of the rise from December 20, ushering in a correction to the downside.
[S&P 500 E-mini futures at 3:30 p.m., 2-hour bars, with volume]
What does Elliott wave theory say? My principal analysis sees the December 20 peak as a subwave of wave 3 {-9} within wave 5 {-8}, which began December 3 from 4492.
The rules discovered by R.N. Elliott require that the 3rd wave in a trend not be shorter than both the 1st and 5th waves. And usually, wave 3 is longer than wave 1. And such is the case with wave 3 {-9}, which is 279.50 points long from the starting point to the December 20 peak. wave 1 {-9} is 251.25 points long, beginning to end.
So why not mark the December 30 peak as the end of wave 3 {-9} and be done with it? That’s the alternative analysis, and my reasoning for rejecting it as the principal goes like this: The sideways movement in the days leading up to the peak look very much like a 4th wave, in this case one degree lower: wave 4 {-10} within wave 3 {-9}. The peak isn’t very far above the sideways trend and certainly an be seen as part of a correction. The pattern-recognition software between my ears tells me that such a short rise is a sorry excuse for a 5th wave, and so the better count is that wave 4 {-10} possibly ended with the decline off of the December 30 peak, and the subsequent rise is the first small step of wave 5 {-10}.
When 5 {-10} reaches completion, it will also mark the end of its parent, wave 3 {-9}, which will be followed by a 4th wave correction, wave 4 {-9} within uptrending wave 5 {-8}.
Learning and other resources. Elliott wave analysis provides context, not prophecy. As the 20th century semanticist Alfred Korzybski put it this way in his book Science and Sanity (1933), “The map is not the territory … The only usefulness of a map depends on similarity of structure between the empirical world and the map.” And I would add, in the ever-changing markets, we can judge that similarity of structure only after the fact.
See the menu page Analytical Methods for a rundown on where to go for information on Elliott wave analysis.
By Tim Bovee, Portland, Oregon, January 3, 2022
Disclaimer
Tim Bovee, Private Trader tracks the analysis and trades of a private trader for his own accounts. Nothing in this blog constitutes a recommendation to buy or sell stocks, options or any other financial instrument. The only purpose of this blog is to provide education and entertainment.
No trader is ever 100 percent successful in his or her trades. Trading in the stock and option markets is risky and uncertain. Each trader must make trading decisions for his or her own account, and take responsibility for the consequences.
Half an hour before the closing bell. Unless something dramatic happens in the next half hour, the stock markets are ending 2021, not with a bang, but whimper. Analysis unchanged. I’ve updated the chart.
“This is the way the world ends. This is the way the world ends. This is the way the world ends. Not witha bang but a whimper.” –T.S. Elliott, “The Hollow Men” (poem) (1925)
9:35 a.m. New York time
Private Trader: Changes ahead. Beginning Monday, the first day of the new year, I’ll be making a couple of changes to Private Trader. One will be the title of this daily post, from “SP500 Analysis” to “Trader’s Notebook”, reflecting the broader range of material I’ll be covering. A second change will be that I shall no longer use the traditional degree names when writing about my Elliott wave analysis of the markets, but will use the wave number and a subscript in curly brackets, same as I do on the charts. So rather than writing “wave 5 of Subminuscule degree {-8}”, I’ll simplify it to “wave 5 {-8}”. On Monday I posted a discussion of the changes.
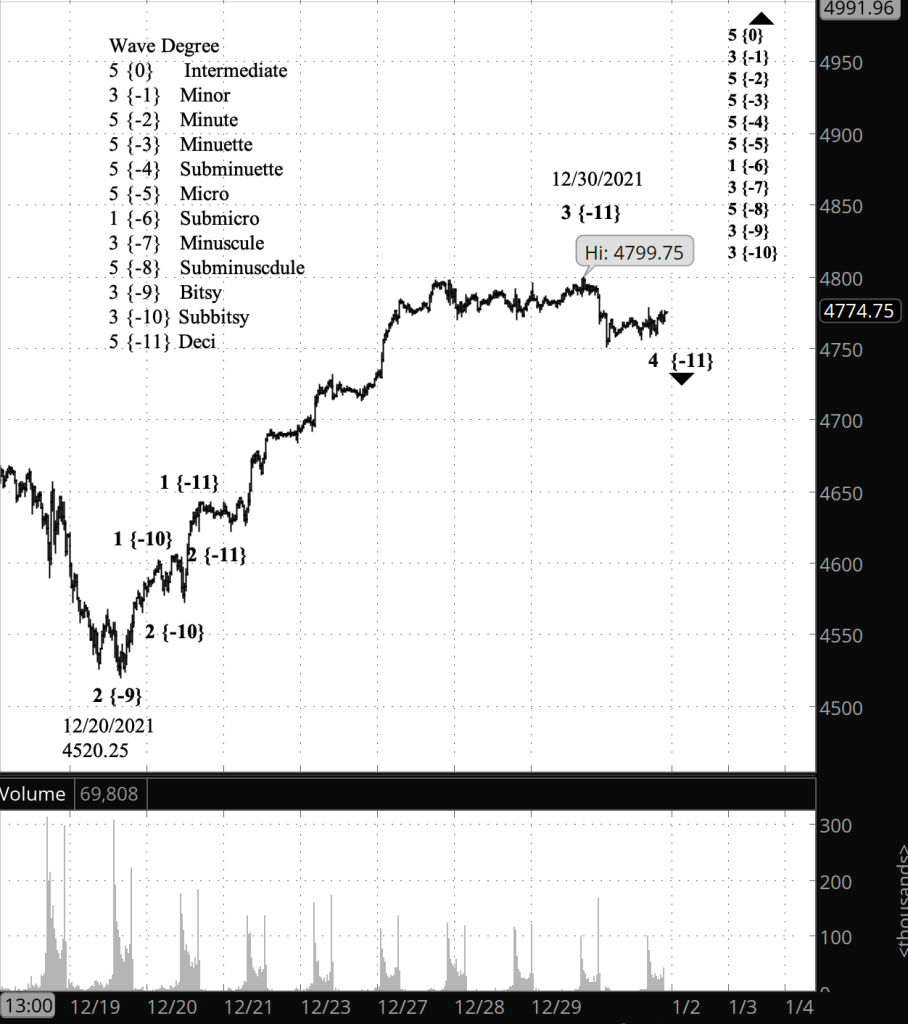
What’s happening now? The S&P 500 E-mini futures dropped by more than 40 points shortly before the closing bell on Thursday, and then began a sideways movement similar to that of the three days prior, albeit at a lower level.
What does it mean? The decline casts doubt on my labeling of yesterday’s peak as meaning that the correction was over. Under my principal analysis today, the uptrend preceding the correction ended at yesterday’s peak; the correction began from that point and is still underway.
What’s the alternative? No clear alternative at this point. Although the chart, with its holiday season flatness, lacks clarity.
[S&P 500 E-mini futures at 3:30 p.m., 30-minute bars, with volume]
What does Elliott wave theory say? Under my principal analysis, wave 4 of Deci degree — subscript {-11} — is continuing its course, which has largely been sideways. It is a downward correction within a series of ever larger uptrending movements: Wave 3 of Subbitsy degree {-10} within wave 3 of Bitsy degree {-9} within wave 5 of Subminuscule degree {-8}.
On the chart I moved the end of wave 3 of Deci degree to the December 30 peak of 4799.75, and the decline that followed is wave 4 of Deci degree.
Learning and other resources. Elliott wave analysis provides context, not prophecy. As the 20th century semanticist Alfred Korzybski put it this way in his book Science and Sanity (1933), “The map is not the territory … The only usefulness of a map depends on similarity of structure between the empirical world and the map.” And I would add, in the ever-changing markets, we can judge that similarity of structure only after the fact.
See the menu page Analytical Methods for a rundown on where to go for information on Elliott wave analysis.
By Tim Bovee, Portland, Oregon, December 31, 2021
Disclaimer
Tim Bovee, Private Trader tracks the analysis and trades of a private trader for his own accounts. Nothing in this blog constitutes a recommendation to buy or sell stocks, options or any other financial instrument. The only purpose of this blog is to provide education and entertainment.
No trader is ever 100 percent successful in his or her trades. Trading in the stock and option markets is risky and uncertain. Each trader must make trading decisions for his or her own account, and take responsibility for the consequences.
New Year’s Eve. The bond market in the U.S. will close early on Friday, at 2 p.m. New York time. The stock markets, however, will keep regular hours.
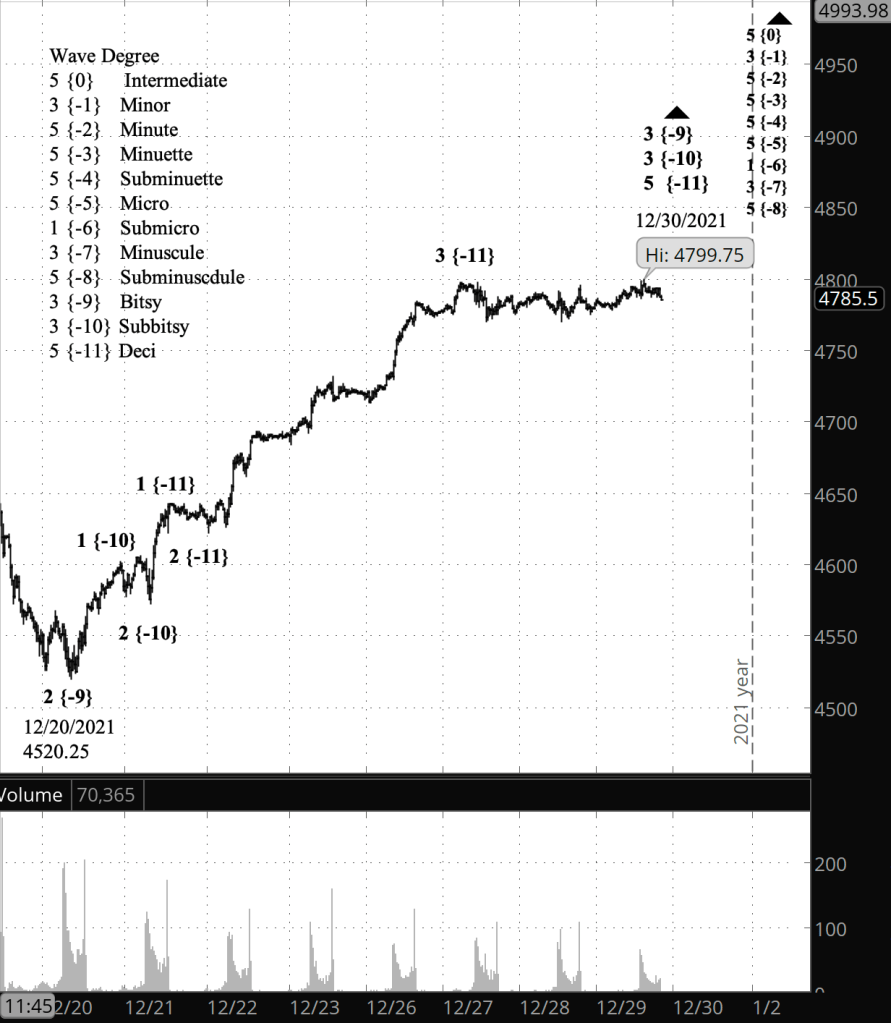
Half an hour before the closing bell. The S&P 500 index joined the futures and the SPY exchange-traded fund in reaching a higher high, 4808.93, in today’s trading. And futures added a bit to their opening-bell high, making the new peak 4799.75. However, once the S&P 500 family touched those higher highs, everyone yawned, laid down, figuratively, and took a long nap. The price went nowhere as it traded within a narrow range. No change in the analysis. I’ve updated the chart as wave 5 of Deci degree — subscript {-11} — slowly continues.
11:35 a.m. New York time
MU iron condor partial exit.I’ve exited the calls in my short iron condor on MU. The short calls were in the money and were at risk of exercise when the stock goes ex-dividend on December 31. Were that to happen, i would not only have hundreds of short shares of MU in my account, but I would have to pay the dividend on them. I’ve written up the results in the analysis, and will put it all together with another update after exiting the puts, which are now an out of the money short bull put spread.
9:40 a.m. New York time
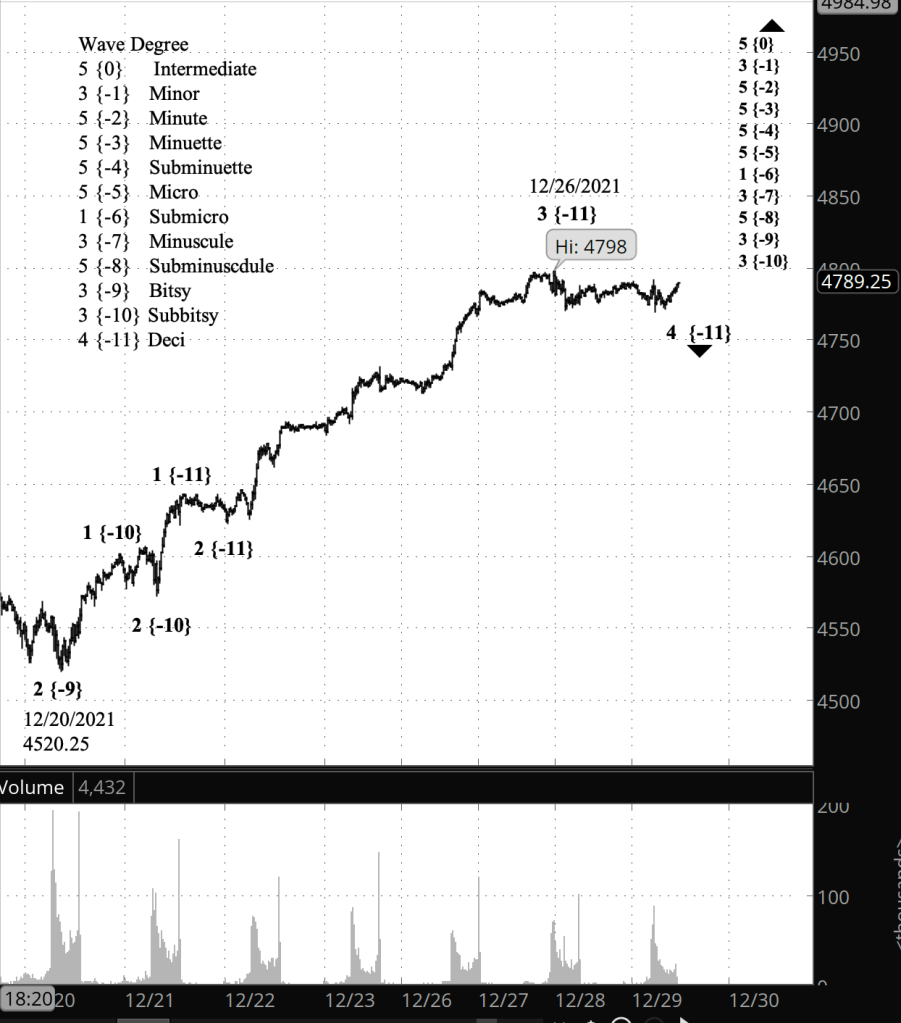
What’s happening now? The S&P 500 E-mini futures continued a sideways movement in overnight trading, remaining below the December 26 peak of 4798. However, within a minute after the opening bell, the price rose to a new high, 4799.
What does it mean? The decline below the peak was a downward correction. The new high set this morning suggests that the correction is over, and a new leg up will continue to carry the price to new heights.
What’s the alternative? The futures trade in 25-cent increments, so it’s possible that the new high is a rounding error, and the correction is still underway. The index did not reach a new high this morning, remaining below the December 28 high of 4807.02 and thereby lending some weight to the alternative analysis. However, the exchange-traded fund SPY, which tracks the S&P 500, did reach a new high this morning, 478.96.
[S&P 500 E-mini futures at 3:30 p.m., 25-minute bars, with volume]
What does Elliott wave theory say? The correction was wave 4 of Deci degree {-11} within uptrending wave 3 of Subbitsy degree {-9}, which began December 20. The end of Deci wave 4 marks the start of Deci wave 5. Fifth waves typically move beyond the end of the preceding 3rd wave — 4798 on December 27 — and often significantly beyond that level, although there is no requirement under the rules of Elliott wave analysis that wave 5 even move beyond the end of wave 3. A 5th wave ending below the end of wave 3 has been truncated in the terminology of Elliott wave analysis.
Learning and other resources. Elliott wave analysis provides context, not prophecy. As the 20th century semanticist Alfred Korzybski put it this way in his book Science and Sanity (1933), “The map is not the territory … The only usefulness of a map depends on similarity of structure between the empirical world and the map.” And I would add, in the ever-changing markets, we can judge that similarity of structure only after the fact.
See the menu page Analytical Methods for a rundown on where to go for information on Elliott wave analysis.
By Tim Bovee, Portland, Oregon, December 30, 2021
Disclaimer
Tim Bovee, Private Trader tracks the analysis and trades of a private trader for his own accounts. Nothing in this blog constitutes a recommendation to buy or sell stocks, options or any other financial instrument. The only purpose of this blog is to provide education and entertainment.
No trader is ever 100 percent successful in his or her trades. Trading in the stock and option markets is risky and uncertain. Each trader must make trading decisions for his or her own account, and take responsibility for the consequences.
Half an hour before the closing bell. The S&P 500, as the trading day neared its end, continued to trade sideways in a narrow zone. No change in the analysis. I’ve updated the chart.
9:35 a.m. New York time
What’s happening now? The S&P 500 E-mini futures traded sideways overnight, remaining within a 16-point range.
What does it mean? The sideways movement is part of a low-level correction within an uptrend that began December 20. It will be followed by a rise to a rise that will carry the price above 4798, the starting point of the correction.
What’s the alternative? The unknown at this point is what form the correction will take. If it’s a simple correction, it will be over quickly. If it’s a compound correction, consisting of several simple corrections in a row, then it will take more time to reach completion. But it’s a low-level correction so whatever the form, it won’t last a long time.
[S&P 500 E-mini futures at 3:30 p.m., 20-minute bars, with volume]
What does Elliott wave theory say? The correction is wave 4 of Deci degree — subscript {-11} within wave 3 of Subbitsy degree {-10} within wave 3 of Bitsy degree {-9}, which began on December 20. All of this is happening within rising wave 5 of Subminuscule degree{-8}, which began on December 3 from 4492.
Wider view: The present correction is a very small bump in the road with the 3rd waves of three larger degrees, and those within a still larger 3rd wave within a 1st wave, and all of that within a series of ever-larger 5th waves stretching up four degrees, to wave 3 of Minor degree {-1} within wave 5 of Intermediate degree {0}.
Moreover, Intermediate wave 5 is a subwave within 5th waves stretching up three more degrees, to wave 5 of Grand Supercycle degree {+3}, which began in 1932.
Long story short: There’s a lot of upside in the S&P 500. Possibly. Fifth waves carry no expectation regarding how much distance they’ll cover, but Intermediate wave 5 has lasted nearly four years and has covered nearly 2,500 points in its rise. That gives some idea of what large-degree 5th waves are capable of. However, the fact that there are so many 5th waves up and down the fractal structure at this point provides a note of caution: When 5th waves reach their ends, they are followed often by devastating declines.
So the motto of this era in the markets, I think, is this: “Let the good times roll, but be mindful that the good times don’t last forever.”
Learning and other resources. Elliott wave analysis provides context, not prophecy. As the 20th century semanticist Alfred Korzybski put it this way in his book Science and Sanity (1933), “The map is not the territory … The only usefulness of a map depends on similarity of structure between the empirical world and the map.” And I would add, in the ever-changing markets, we can judge that similarity of structure only after the fact.
See the menu page Analytical Methods for a rundown on where to go for information on Elliott wave analysis.
By Tim Bovee, Portland, Oregon, December 29, 2021
Disclaimer
Tim Bovee, Private Trader tracks the analysis and trades of a private trader for his own accounts. Nothing in this blog constitutes a recommendation to buy or sell stocks, options or any other financial instrument. The only purpose of this blog is to provide education and entertainment.
No trader is ever 100 percent successful in his or her trades. Trading in the stock and option markets is risky and uncertain. Each trader must make trading decisions for his or her own account, and take responsibility for the consequences.
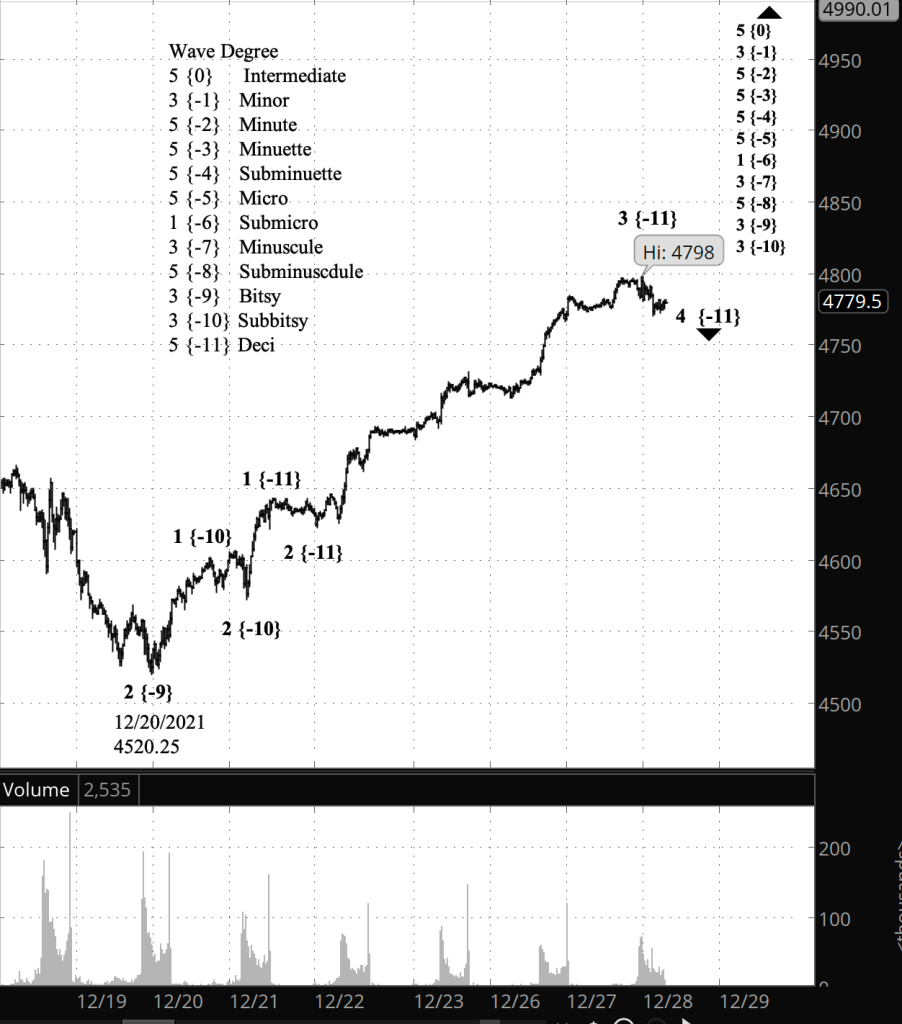
Half an hour before the closing bell. The S&P 500 peaked this morning and then began a slow decline. I’ve adjusted my principal analysis to show wave 3 of Deci degree {-11} ending at that peak, 4798 on the futures and 4807.02 on the index. The present wave is a 4th wave correction of Deci degree within uptrending wave 3 of Subbitsy degree. Otherwise, this morning’s analysis stands. I’ve updated the chart.
9:35 a.m. New York time
What’s happening now? The S&P 500 E-mini futures continued to rise in overnight trading, reaching 4797.25.
What does it mean? My principal analysis concludes that the rise from December 20 is in its final leg internally. When that last leg ends, the S&P 500 will enter a downward correction before resuming its upward course.
What’s the alternative? The final leg of a trend has no limit to how far it can travel, beyond a certain tendency to be of more or less of the same magnitude as other portions of the structure. So, yes, a correction lies ahead after the last leg reaches completion. And, no, it won’t necessarily be in the next few days, although it could be. As is often the case with stock market charts, ambiguity rules the day.
[S&P 500 E-mini futures at 3:30 p.m., 20-minute bars, with volume]
What does Elliott wave theory say? The rise from December 20 is wave 3 of Bitsy degree — subscript {-9} — and within it wave 3 of Subbitsy degree {-10} is underway. Further down the fractal structure, wave 5 of Deci degree {-11} began yesterday. When Deci wave 5 is complete, its parent wave 3 of Subbitsy degree will also be complete, ushering in a 4th wave correction. Subbitsy wave 4 will be followed by a 5th wave, which has no limits on how far it can go, but also no requirement that it travel any great distance.
The end of Subbitsy 5 will also be the end of Bitsy wave 3, which will mark the start of a 4th wave correction. Bitsy 4 will be followed by a 5th wave whose end will complete the rise from December 20, and also mark the completion the parent, wave 5 of Subminuscule degree {-8}.
When Subminuscule 5 reaches its end, it will also mark the end of its parent, wave 3 of Minuscule degree {-7} and the beginning of a noticeably large correction.
The analysis applies to both my principal and alternative analyses. The only unknown is the timing of the coming 4th wave corrections.
Calendar notes. No earnings plays in sight this week. The next trading opportunities will be on Wednesday, January 5. The next earnings kicks off the week of January 18, when AA publishes its earnings. For options trades not associated with events, the optimal entry window for options expiring February 22 is on Tuesday, January 4, and I’ll be looking for trades on that date.
Learning and other resources. Elliott wave analysis provides context, not prophecy. As the 20th century semanticist Alfred Korzybski put it this way in his book Science and Sanity (1933), “The map is not the territory … The only usefulness of a map depends on similarity of structure between the empirical world and the map.” And I would add, in the ever-changing markets, we can judge that similarity of structure only after the fact.
See the menu page Analytical Methods for a rundown on where to go for information on Elliott wave analysis.
By Tim Bovee, Portland, Oregon, December 28, 2021
Disclaimer
Tim Bovee, Private Trader tracks the analysis and trades of a private trader for his own accounts. Nothing in this blog constitutes a recommendation to buy or sell stocks, options or any other financial instrument. The only purpose of this blog is to provide education and entertainment.
No trader is ever 100 percent successful in his or her trades. Trading in the stock and option markets is risky and uncertain. Each trader must make trading decisions for his or her own account, and take responsibility for the consequences.
I’ll be making a couple of changes to my daily post on PrivateTrader, beginning on the first Monday of the new year, January 3, 2022.
First, the title of the daily post. As it started out after the early pandemic crash in February 2020, Elliott wave analysis of the S&P 500 futures was about all that I was doing. That has changed with the passage of time, and I’m now using that post for other purposes as well, such as to let people know when i’ve posted an analysis of an options trade.
In recognition of that fact, I’m changing the name of the daily post from “SP500 Analysis” to “Trader’s Notebook”. The S&P analysis will still be there, posted on market days shortly after the market open and updated throughout the day as events warrant.
Second, I’m eliminating the degree names from my analyses. On the charts I don’t use names but subscripts that show the relation between the various wave degrees. Subscript {-8} is a degree larger than {-10}, and {-7} is larger than both of them. The subscript numbers are above and below Intermediate degree, which has the subscript {0}. In the write-ups discussing the Elliott wave analysis, I presently use the degree names and have taken to adding in the subscripts as well.
The degree names are traditional. They date from the early work on Elliott wave analysis by R.N. Elliott, who first described his theory in 1938, in “The Wave Principle”. He created the the degree names of Subminuette degree — my subscript {-4} — all the way up to Grand Supercyle {+4}. Robert Prechter in his 1978 book Elliott Wave Principle, co-authored with Alfred Frost, expanded the nomenclature up to Grand Millennium Degree {+7} and down to Minuscule degree {-7}, and later to Subminuscule degree {-8}. In my work analyzing even smaller movements, I added Bitsy degree {-9} and Subbitsy degree {-10}.
But no more. The degree names add nothing to the understanding of the relative wave positions within the fractal structure of the market movements. Up to now, where I would have written “wave 3 of Bitsy degree {-9}”, going forward I shall write “wave 3 {-9}”. For those wanting to correlate my subscripts with the historical wave labels, I have a list on the Analytical Methods page proving that correlation. I link to the page at the bottom of the daily post.
And so, onward to 2022.
See the menu page Analytical Methods for a rundown on where to go for information on Elliott wave analysis.
By Tim Bovee, Portland, Oregon, December 27, 2021
Disclaimer
Tim Bovee, Private Trader tracks the analysis and trades of a private trader for his own accounts. Nothing in this blog constitutes a recommendation to buy or sell stocks, options or any other financial instrument. The only purpose of this blog is to provide education and entertainment.
No trader is ever 100 percent successful in his or her trades. Trading in the stock and option markets is risky and uncertain. Each trader must make trading decisions for his or her own account, and take responsibility for the consequences.
Half an hour before the closing bell. The S&P 500 rose during the trading session, reaching a peak of 4776 on the futures and 4784.72 on the index. Wave 3 of Bitsy degree continues its rise. The exchange-traded fund SPY, which tracks the index, also reached a new peak today.
The achievement of new highest highs by all three instruments resolves a discrepancy that has been on the charts since December 16. Both the futures and SPY track the index, but the correlation is never perfect and from time to time that truth becomes glaringly obvious.
The futures hit a new peak of December 16. But the index and SPY did not; their highest peaks were achieved on November 22 and remained the highest thereafter. Today’s upward push brought all three instruments to new peaks, resolving the discrepancy.
I’ve updated the futures chart below. No change in the analysis.
2:55 p.m. New York time
Private Trader Changes. I’ve posted a rundown of a couple of changes I shall be making to this daily post beginning the first Monday of the New Year, January 3.
9:55 a.m. New York time
New peak. The S&P 500 futures moved above the 4743.25, the all-time peak set on December 16, confirming that the 3rd wave uptrend of Bitsy degree {-9} is underway. The new all-time high, which is unlikely to survive for long, is 4746.75. The principal analysis is correct; the alternative, scrapped. I’ve updated the chart.
9:35 a.m. New York time
What’s happening now? The S&P 500 E-mini futures rose when trading resumed after the long holiday weekend, reaching a level 2 points below the all-time peak of 4743.25 set on December 16.
What does it mean? The rise that began December 20 from 4520.25 is the middle leg of a larger uptrend that began December 3 from 4492. I expect the rise to break above the prior high, 4743.25, to a new peak, perhaps even today.
What’s the alternative? If the price reverses downward without breaking above the December 16 peak, then the downward correction that began December 16 is still underway and is in its middle leg. The downward movement will be followed by another rise that will remain below 4743.25.
[S&P 500 E-mini futures at 3:30 p.m., 50-minute bars, with volume]
What does Elliott wave theory say? Under my principal analysis, the present rise is wave 3 of Bitsy degree — subscript {-9} — within uptrending wave 5 of Subminuscule degree {-8}. The December 16 all-time high marked the end of wave 1 of Bitsy degree. Second waves ALWAYS move beyond the start of the preceding 1st wave, so it’s only a matter of time, perhaps only hours, before it happens. It if fails to move beyond the end of wave 1, then it isn’t a 3rd wave and the alternative analysis is correct.
Under my alternative analysis, the decline that ended on December 20 was wave A of Subbitsy degree {-10} and the present rise that now underway is Subbitsy wave B, both subwaves of a correction, wave 2 of Bitsy degree. Most corrections are composed of three subwaves, so the falling wave that followed Subbitsy B will when complete mark the end of wave 2 of Bitsy degree. Second waves NEVER move beyond the end of the preceding wave 1. If it does move beyond that point, then it isn’t a 2nd wave and the principal analysis is correct.
Learning and other resources. Elliott wave analysis provides context, not prophecy. As the 20th century semanticist Alfred Korzybski put it this way in his book Science and Sanity (1933), “The map is not the territory … The only usefulness of a map depends on similarity of structure between the empirical world and the map.” And I would add, in the ever-changing markets, we can judge that similarity of structure only after the fact.
See the menu page Analytical Methods for a rundown on where to go for information on Elliott wave analysis.
By Tim Bovee, Portland, Oregon, December 27, 2021
Disclaimer
Tim Bovee, Private Trader tracks the analysis and trades of a private trader for his own accounts. Nothing in this blog constitutes a recommendation to buy or sell stocks, options or any other financial instrument. The only purpose of this blog is to provide education and entertainment.
No trader is ever 100 percent successful in his or her trades. Trading in the stock and option markets is risky and uncertain. Each trader must make trading decisions for his or her own account, and take responsibility for the consequences.
Chart update problem resolved. I’ve updated the lower chart, showing a close-up view, showing the S&P 500 E-mini futures half an hour before the closing bell.
3:30 p.m. New York time
Half an hour before the closing bell. As the closing bell approached, the S&P 500 continued to rise during the day, reaching 4727.75 on the futures, 4737.12 on the index. No change in the analysis. The WordPress system for some reason won’t allow me to update the close-up chart, down above Elliott wave analysis section. Imagine a line that goes up about two-thirds of the way from the 78.6% retracement line and the 100% retracement line, and you’ll have the 3:30 p.m. in your mind.
11:45 a.m. New York time
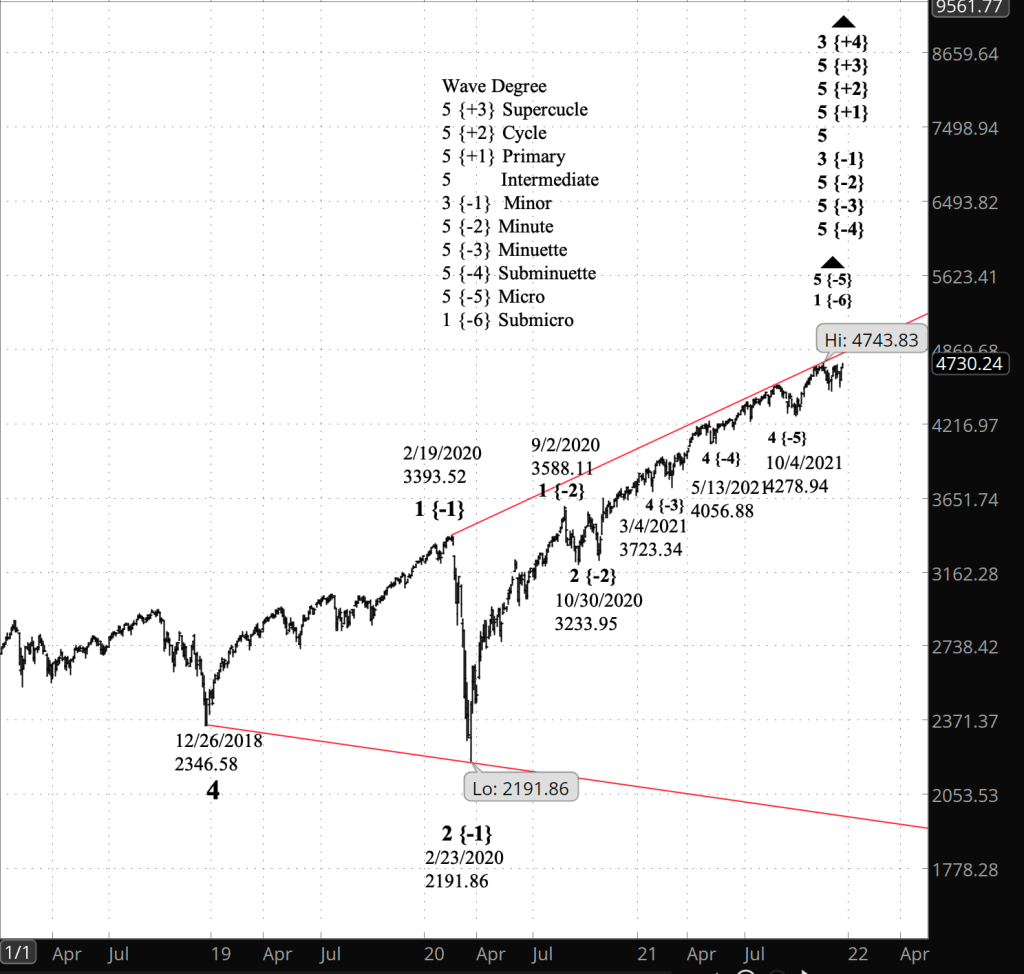
Long-term chart. Today is the last trading day of the week; the markets will observe Christmas on Friday, the day before the holiday itself. So as is my end-of-the-week practice, here’s a look at the long term. The chart shows the S&P 500 index stretching back to the summer of 2018, with the large structure that, by my analysis, has dominated the markets since that year, an expanding Diagonal Triangle, which began on December 26, 2018, from 2346.58.
[S&P 500 index at 11:41 a.m., 2-day bars]
Expanding triangles have a characteristic: The trend-line boundaries keep moving further away from each other. And so the end of the 2nd wave of the triangle was lower than the start of the 1st wave, something not normally allowed in a five-wave main trend.
In Elliott wave terms: The triangle is wave 5 of Intermediate degree — subscript {0}. Within it, the index is presently tracing wave 3 of Minor degree {-1}. Minor wave 3 began on February 23, 2020 — the end of the early pandemic crash — from 2191.86.
Within Minor 3, the index is positioned in a series of 5th waves down to Micro degree {-5}, which began on October 4 from 4278.94.
By that analysis there is still significant upside ahead. Minor wave 3 still hasn’t traced its 3rd wave internally, at Submicro degree {-6}, and it is 3rd waves that cover the most ground in the direction a trend.
The end of Minor wave 3 will signal the beginning of wave 4 of Minor degree, a downward movement that will in theory reach the lower boundary of the Diagonal Triangle, which is presently in the mid-1900s and moving lower each day. It will feel like an end-of-the-world major crash.
The good news: That 4th wave will be followed by Minor wave 5, which will carry the price back up to the upper boundary, which is moving higher day, creating the bull market for the record books. The end of Minor wave 5 will also end increasingly larger 5th waves, of the Primary {+1}, Cycle {+2} and Supercyle {+3} degrees. The 5th wave of Supercycle degree began in 1932, from the low point following the Great Crash of 1929.
And following that Supercycle rise? Well, the bull is always followed by the bear. In Elliott wave terms, the end of a 5th wave is followed by either a correction, within a larger degree, consisting of three waves, with variations, or a new downtrend, consisting of five waves.
One of the wisdom writings of Jewish scripture, composed somewhere between 450 and 200 BCE by an unknown author who says he is reporting the words of the king’s son, Kohelet, provides a perfect description of how the markets work, whether the viewpoint be big picture or close up: “The thing that hath been, it is that which shall be; and that which is done is that which shall be done: and there is no new thing under the sun.” Or as the humanistic Cylons of the reimagined Battlestar Galactica put it, repeatedly, in the 2004-2009 series: “All of this has happened before, and will happen again.”
That insight lies at the core of Elliott wave analysis.
11 a.m. New York time
Earnings plays rules. I’ve posted my rules for earnings plays in the “Trading Rules” section of the menu bar. After tinkering with it, where came down was this: There are rules for entry that are unique to earnings plays, but once the position has been entered, my rules are the same as they are short options spread, with the exception that I’m aiming for 25% of maximum potential profit, rather than 50%. The goal is to improve the turnover of funds for earnings plays.
10:50 a.m. New York time
Earning plays exited. Two of my earnings plays reached 25% of maximum potential profit, and as is my rule, I exited. I’ve updated the analyses of the two short iron condor positions — DRI and GIS — with results.
9:35 a.m. New York time
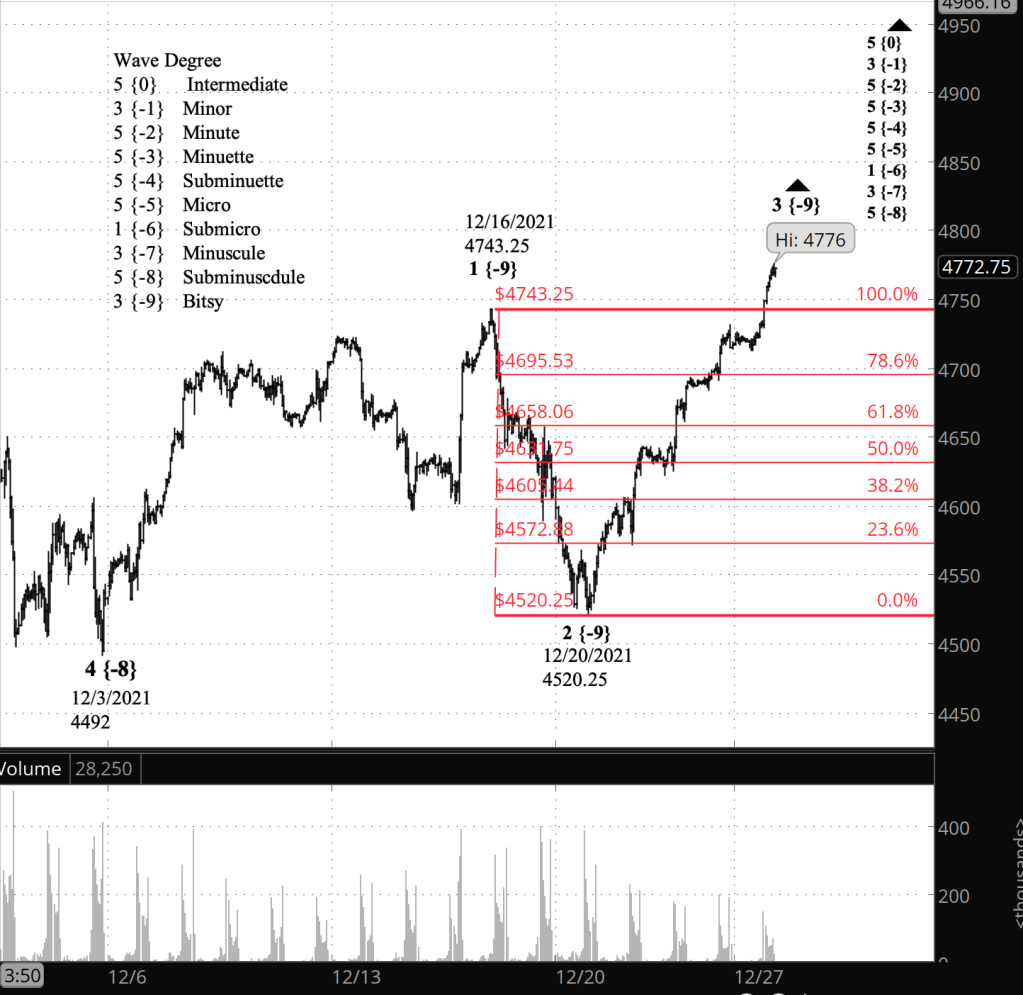
What’s happening now? The S&P 500 E-mini futures rose in overnight trading, reaching 4706.75 minutes after the opening bell, a bit above a Fibonacci 78.6% upward retracement of the decline from December 16 to December 20.
What does it mean? The uptrend that began on December 20 and will eventually break above the December 16 high, 4743.25, perhaps significantly above that level.
What’s the alternative? If the price reverses and falls back into the 4500s without moving above the December 16 high, then the present rise was the second leg of of a downward correction.
[S&P 500 E-mini futures at 3:30 p.m., 45-minute bars, with volume]
What does Elliott wave theory say? Under my principal analysis, the rise from 4520.25 on December 20 is wave 3 of Bitsy degree — subscript {-9} — within rising wave 5 of Subminuscule degree {-8}.
Learning and other resources. Elliott wave analysis provides context, not prophecy. As the 20th century semanticist Alfred Korzybski put it this way in his book Science and Sanity (1933), “The map is not the territory … The only usefulness of a map depends on similarity of structure between the empirical world and the map.” And I would add, in the ever-changing markets, we can judge that similarity of structure only after the fact.
See the menu page Analytical Methods for a rundown on where to go for information on Elliott wave analysis.
By Tim Bovee, Portland, Oregon, December 23, 2021
Disclaimer
Tim Bovee, Private Trader tracks the analysis and trades of a private trader for his own accounts. Nothing in this blog constitutes a recommendation to buy or sell stocks, options or any other financial instrument. The only purpose of this blog is to provide education and entertainment.
No trader is ever 100 percent successful in his or her trades. Trading in the stock and option markets is risky and uncertain. Each trader must make trading decisions for his or her own account, and take responsibility for the consequences.
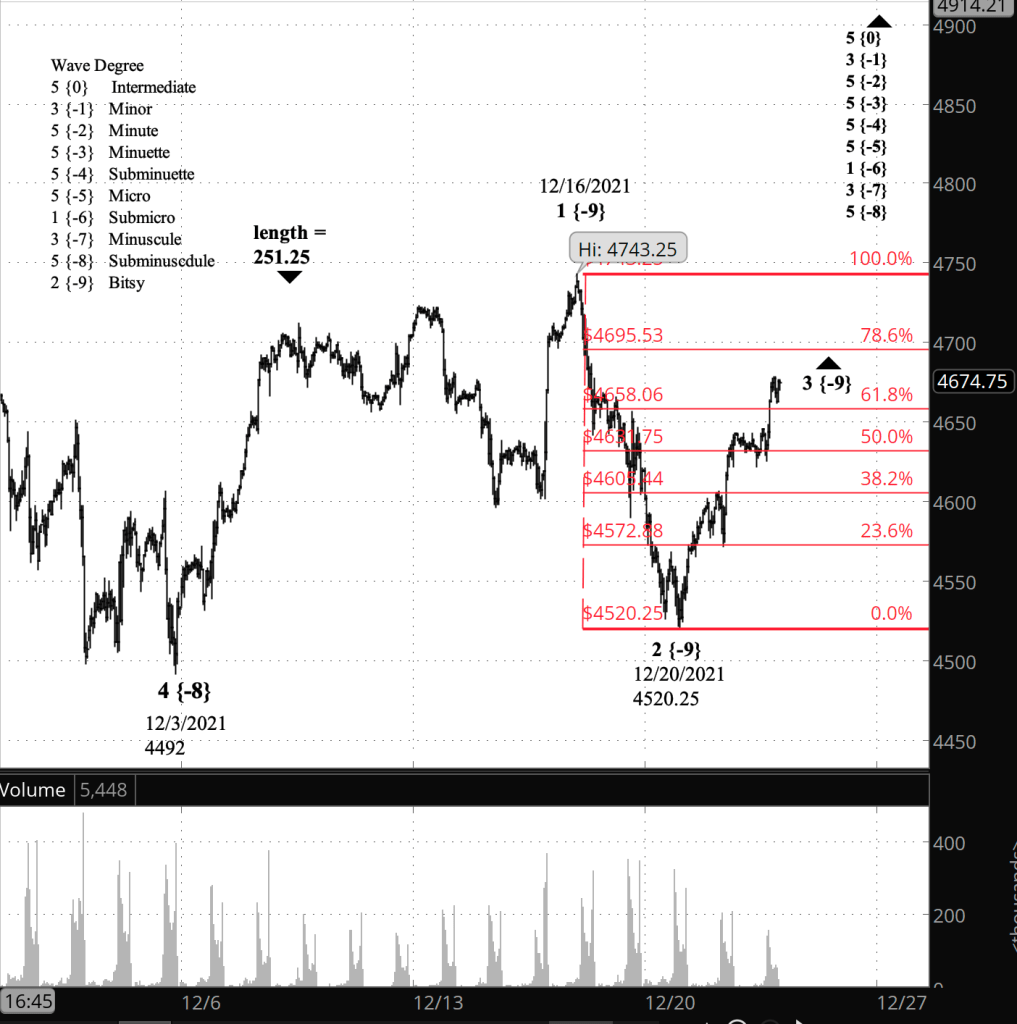
Half an hour before the closing bell. The S&P 500, before the opening bell, pushed past a Fibonacci 61.8% retracement of the 2nd wave downward correction that began on December 16. Thereafter, the 3rd wave rise dawdled throughout the session, staying within a range about $7 wide on the futures. No change in the analysis. I’ve updated the chart.
9:35 a.m. New York time
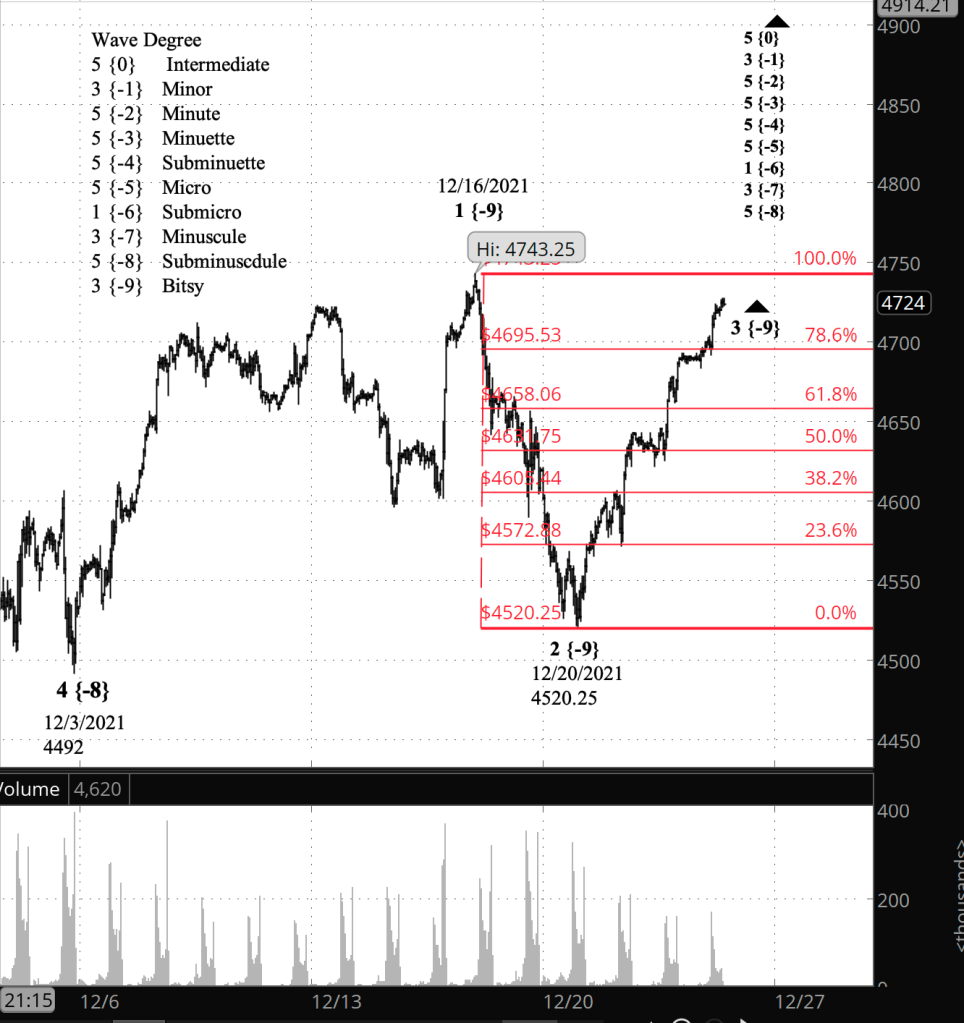
What’s happening now? The S&P 500 E-mini futures in overnight trading paused at a 50% retracement of the downward correction from December 16 to December 20.
What does it mean? The rise from December 20 is a resumption of the uptrend and will eventually rise above the December 12 high, 4743.25, perhaps significantly above that level.
What’s the alternative? If the price reverses back to the downside without reaching a new peak, then the correction is still underway. Under this scenario, the low of December 20 marked the end of the first leg of the correction, not of the entire correction.
[S&P 500 E-mini futures at 3:30 p.m., 45-minute bars, with volume]
What does Elliott wave theory say? Under my principal analysis, the rise from December 20 is wave 3 of Bitsy degree — subscript {-9} — within uptrending wave 5 of Subminuscule degree {-8}. A 3rd wave typically is the longest of the three waves, out of five, that move in the direction of a trend, and under the rules of Elliott wave analysis, it cannot be the shortest of the three, non-corrective waves.
Wave 1 of Bitsy degree came in with a length of 251.25. The present wave 3 shortly before the opening bell had reached a length of 125.75. So to avoid being shorter than wave 1, the 3rd wave will need to reach, at a minimum, a price of 4771.50.
Of course, Bitsy wave 3 will be followed by a 4th wave and then a 5th. If that 5th wave turns out to be the shortest of the three movements in the direction of the trend, then the Ellliott rules allow wave 3 to be shorter than wave 1.
The end of the parent wave 5 of Subminuscule degree will also mark the end of wave 3 of Minuscule degree {-7}, which will be followed by a 4th wave correction, most likely tracing a Flat pattern.
Learning and other resources. Elliott wave analysis provides context, not prophecy. As the 20th century semanticist Alfred Korzybski put it this way in his book Science and Sanity (1933), “The map is not the territory … The only usefulness of a map depends on similarity of structure between the empirical world and the map.” And I would add, in the ever-changing markets, we can judge that similarity of structure only after the fact.
See the menu page Analytical Methods for a rundown on where to go for information on Elliott wave analysis.
By Tim Bovee, Portland, Oregon, December 22, 2021
Disclaimer
Tim Bovee, Private Trader tracks the analysis and trades of a private trader for his own accounts. Nothing in this blog constitutes a recommendation to buy or sell stocks, options or any other financial instrument. The only purpose of this blog is to provide education and entertainment.
No trader is ever 100 percent successful in his or her trades. Trading in the stock and option markets is risky and uncertain. Each trader must make trading decisions for his or her own account, and take responsibility for the consequences.



You must be logged in to post a comment.