Trader’s Notebook

3:30 p.m. New York time

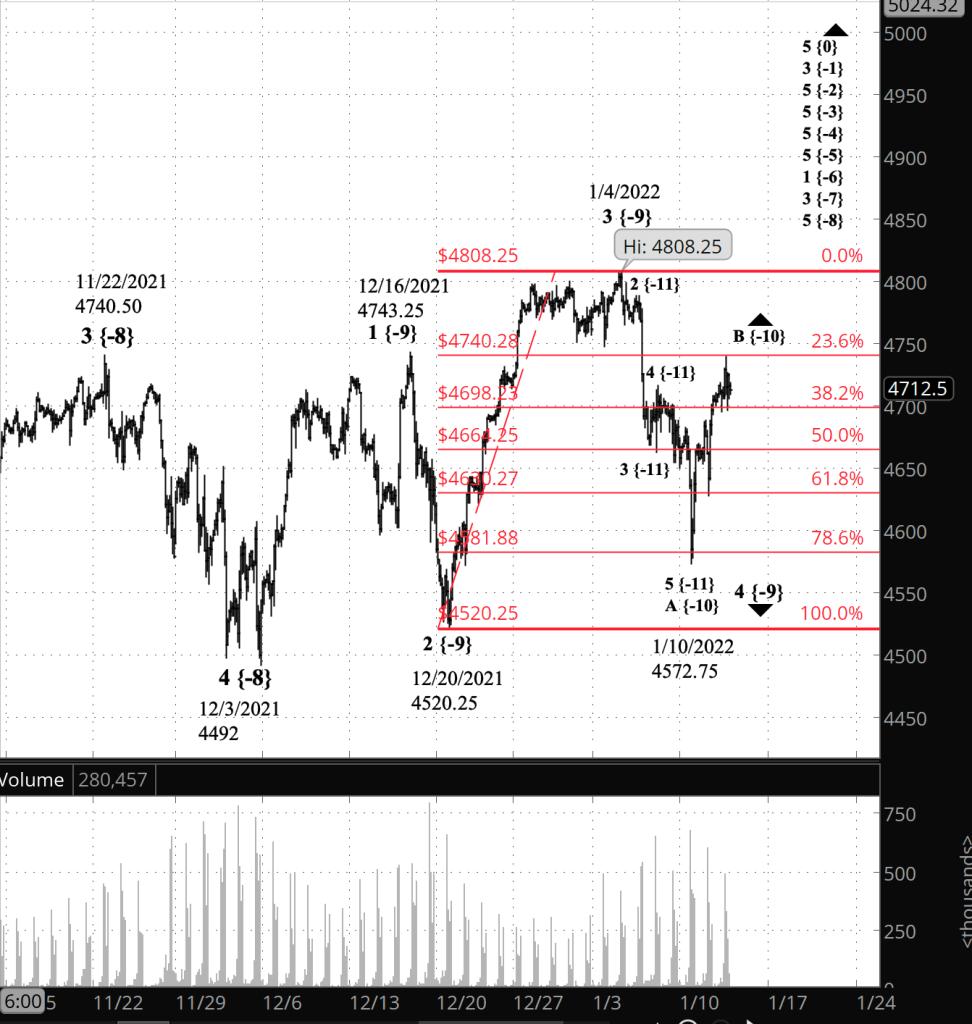
Half an hour before the closing bell. The S&P 500 rose to the 23.6% Fibonacci retracement level and then pulled back slightly. The movement was the third wave within wave B{-10} and fulfilled all requirements for completion of the B wave. The price could go higher, but under my principal analysis, can’t go above 4808.25, the January 4 peak. No change in the analysis from this morning, beyond the correction noted below. I’ve updated the chart.

2:47 p.m. New York time

Correction. I’ve updated the chart to correct the labelling of the rise that began January 10 and have corrected the designation in the first paragraph of the Elliott wave theory text below the chart.

10:15 a.m. New York time

Earnings play. I’ve opened a short iron condor position on DAL prior to the airlines’ earnings announcement on Thursday before the opening bell. The stock is ranked as “Hold” by Zacks, so I went with an iron condor. Zacks’ Earnings Surprise Predictor is 64% for a positive surprise, which is quite high. The implied volatility rank is lower than I like, but I was able to construct a trade that provided sufficient premium to meet my requirements. I’ve posted an analysis of the trade.

No earnings plays using stocks in sight today.

9:35 a.m. New York time

What’s happening now? The S&P 500 E-mini futures continued to rise in overnight trading, again approaching the 23.6% Fibonacci retracement level.

What does it mean? The second leg of a downward correction that began January 4 is still underway. A move above the January 4 high of 4808.25 would require that the analysis be revised.

What are the alternatives? The 2nd leg of a new downtrend that began January 4 is still underway. It presently has three segments internally. If another decline and rise are added, then this analysis would be invalidated.

Another alternative: The correction that began January 4 ended on January 10 at 4572.75, and the rise that followed is the first leg of a renewed uptrend. A move above 4808.25 would confirm this analysis. A move below 4572.75 would invalidate it. Also, to count decline from January 4 to 10 as having three legs internally — a necessity for this scenario — requires some creative viewing of the chart to make it work. I consider this to be the least likely scenario.
[S&P 500 E-mini futures at 3:30 p.m., 2-hour bars, with volume]

What does Elliott wave theory say? Under my principal analysis, the rise from January 10 is upward wave B{-10} [corrected from the initial post] within downward correction wave 4{-9}.

Under the first alternative analysis, the rise from January 10 is an upward correction, wave 2{-10}, within downtrending wave 1{-9}. The second wave must have three waves internally, unless it adds a second corrective pattern in a compound structure, which is not some common in second waves.

Under the second alternative, the low of January 10 ended downward wave C{-10} within downward correction wave 4{-9}, and the subsequent rise is uptrending wave 1{-10} within uptrending wave 5{-9}.

All of these scenarios, whichever map ends up conforming to the territory, are happening within uptrending wave 5{-8}, which began on December 3 from 4492.

Learning and other resources. Elliott wave analysis provides context, not prophecy. As the 20th century semanticist Alfred Korzybski put it this way in his book Science and Sanity (1933), “The map is not the territory … The only usefulness of a map depends on similarity of structure between the empirical world and the map.” And I would add, in the ever-changing markets, we can judge that similarity of structure only after the fact.

See the menu page Analytical Methods for a rundown on where to go for information on Elliott wave analysis.

By Tim Bovee, Portland, Oregon, January , 2022

Disclaimer

Tim Bovee, Private Trader tracks the analysis and trades of a private trader for his own accounts. Nothing in this blog constitutes a recommendation to buy or sell stocks, options or any other financial instrument. The only purpose of this blog is to provide education and entertainment.

No trader is ever 100 percent successful in his or her trades. Trading in the stock and option markets is risky and uncertain. Each trader must make trading decisions for his or her own account, and take responsibility for the consequences.

License
Creative Commons License

All content on Tim Bovee, Private Trader by Timothy K. Bovee is licensed under a Creative Commons Attribution-ShareAlike 4.0 International License.

Based on a work at www.timbovee.com.
Trader’s Notebook

3:30 p.m. New York time

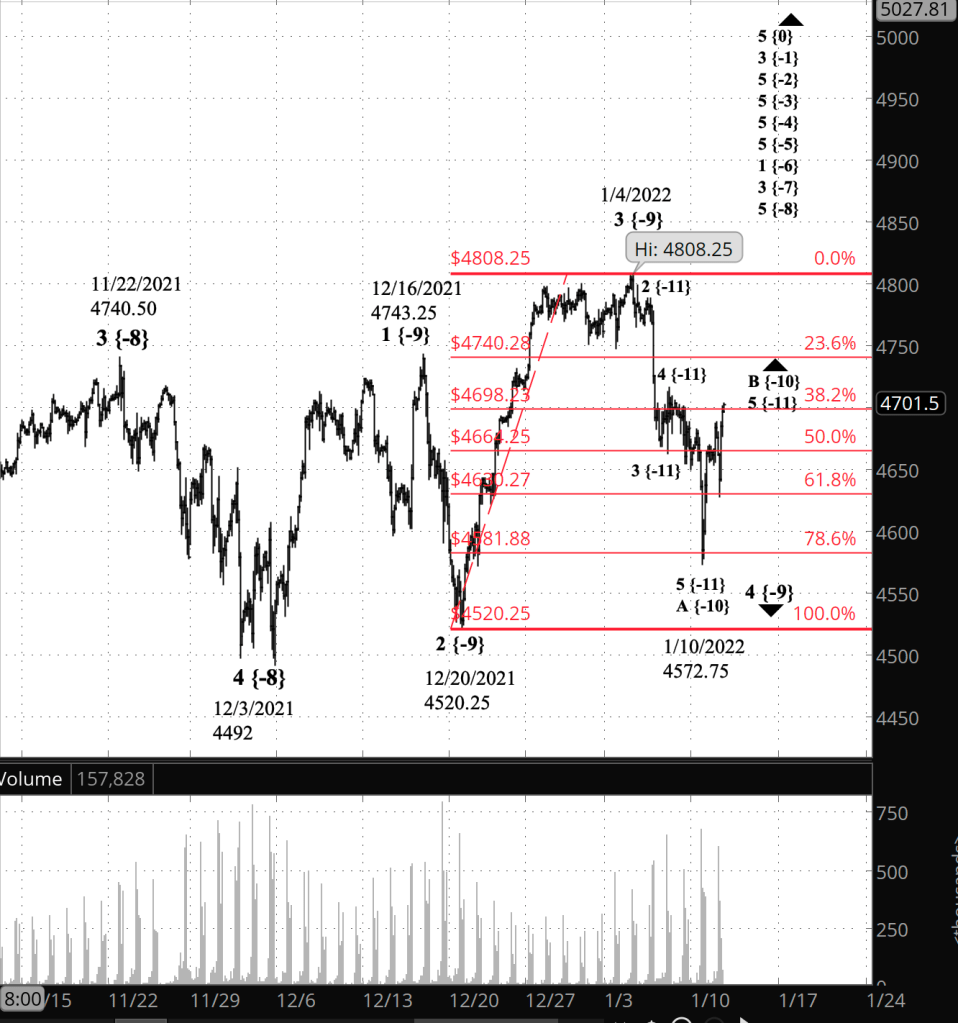
Half an hour before the closing bell. The S&P 500 has continued to work its way higher during the trading session, returning to the 38.2% Fibonacci retracement level. No change in the analysis. I’ve updated the chart.

3:15 p.m. New York time

Earnings play exited. I’ve exited my short iron condor position on CAG, six days after entering the position the day before the earnings announcement, for a return of 32.8%, or 1,998% annualized. I’ve updated the analysis with full results.

10:05 a.m. New York time

My trades. Actually, no trades today. JEF publishes earnings on Wednesday before the opening bell. I’ve done the options analysis, and JEF doesn’t provide sufficient return to support the position. The implied volatility rank is relatively low for this close to an earnings announcement, only 29.2%. I always prefer that my short options position be at 30% or above. Zacks expects no earnings surprise in either direction, so the position would be structured as a short iron condor. A construction covering the expected move based on options pricing: $1.11 in either direction, or $39.60 to $41.82, provides 28% coverage of the long-short intervals of the two legs of the iron condor. I prefer 33% or better. And the risk/reward ratio is 2.6:1, which is higher risk than I prefer with iron condors. Generally, my preference is for a ratio better than 1.5:1. A stock trade for JEF is also out of the picture; I trade stocks on earnings only when the Zacks Expected Surprise Prediction for earnings is greater than zero, and that’s not the case for JEF.

No other trades in sight today.

9:35 a.m. New York time

What’s happening now? The S&P 500 E-mini futures continued to rise in overnight trading, moving back above the 50% retracement of the rise from December 20 to January 4.

What does it mean? The rise is the second leg of a correction from the January 4 peak.

What’s the alternative? The rise is the second leg of a downtrend that began on January 4.

[S&P 500 E-mini futures at 3:30 p.m., 2-hour bars, with volume]

What does Elliott wave theory say? Under my principal analysis, the decline from January 4 — the end of wave 3{-9} to January 10 is wave A{-10}, the first wave of a three-wave downward correction. wave B{-10} will carry the price up but will remain bellow the January 4 high of 4808.25.

Under my alternative analysis, the January 4 to January 10 decline was wave 1{10} of an impulse wave, a new trend to the downside. The subsequent rise is wave 2{-10} The January 4 peak was the end of wave 5{-9} under this scenario.

Under both scenarios, the first wave can have five subwaves (as it has) and the second wave, three subwaves (as it almost certainly will). So the rise won’t clear up the present ambiguity about whether the S&P 500 is in a correction or a new downtrend.

See the Ellliott wave theory section of yesterday’s Trader’s Notebook for an extensive discussion of the possibilities.

Learning and other resources. Elliott wave analysis provides context, not prophecy. As the 20th century semanticist Alfred Korzybski put it this way in his book Science and Sanity (1933), “The map is not the territory … The only usefulness of a map depends on similarity of structure between the empirical world and the map.” And I would add, in the ever-changing markets, we can judge that similarity of structure only after the fact.

See the menu page Analytical Methods for a rundown on where to go for information on Elliott wave analysis.

By Tim Bovee, Portland, Oregon, January 11, 2022

Disclaimer

Tim Bovee, Private Trader tracks the analysis and trades of a private trader for his own accounts. Nothing in this blog constitutes a recommendation to buy or sell stocks, options or any other financial instrument. The only purpose of this blog is to provide education and entertainment.

No trader is ever 100 percent successful in his or her trades. Trading in the stock and option markets is risky and uncertain. Each trader must make trading decisions for his or her own account, and take responsibility for the consequences.

License
Creative Commons License

All content on Tim Bovee, Private Trader by Timothy K. Bovee is licensed under a Creative Commons Attribution-ShareAlike 4.0 International License.

Based on a work at www.timbovee.com.
ACI Trade

Albertsons Cos Inc. (ACI)

Update 2/19/2022: The remaining calls in my short iron condor position on ACI, reduced to a bear call vertical spread after i exited the puts in January, expired valueless on February 19 and imposed no debits on the position. The credit I received upon entry was all profit, less fees.

I gave results for the puts below when I exited them on January 24. In this update I shall first analysis the calls exit, and then put both together and analyze the original iron condor.

I exited my short bear call vertical spread on ACI when they expired out of the money for no debit per contract/share, a profit before fees of $95 per contract. Shares closed the day before expiration at $29.01, down $2.23 from the entry level.

The Implied Volatility Rank at exit was 19.4%, down 16.1 points from the entry level.

Shares declined by 7.1% over 40 days for a -65% annual rate. The options position produced a 100% return for a +913% annual rate.

I next turn to the entire iron condor, combining both the puts, which I exited early, and the calls, which expired without value.

I exited my short iron condor position on ACI in a piecemeal fashion, the final exit coming at expiration, for a $2.25 debit per contract/share, a loss before fees of $9.00 per contract. hares closed the day before expiration at $29.01, down $2.23 from the entry level.

The Implied Volatility Rank at exit was 19.4%, down 16.1 points from the entry level.

Shares declined by 7.1% over 40 days for a -65% annual rate. The options position produced a 4% loss for a -37% annual rate.


Update 1/24/2022: The short puts in my short iron condor position on ACI were out of the money the day before the company’s stock went ex-dividend, and rather than risk assignment, I exited the short and long puts 25 days before expiration, thereby splitting the iron condor into two vertical spreads.

Here I shall analyze the short bull put spread that I exited. The short bear call spread will, I hope, expire without value on February 18, and at that point I shall analyze both the bear call spread and the original iron condor.

I exited the short bull put spread for a $2.25 debit per contract/share, a loss before fees of $104 per contract. Shares were trading at $28.28, down $2.96 from the entry level.

The Implied Volatility Rank at exit was #, up/down # points from the entry level.

Shares declined by 9.5% over 14 days for a -247% annual rate. The options position produced a -46.2% loss for a 1,205% annual rate.


I have entered a short iron condor earnings play on ACI, using options that trade for the last time 39 days hence, on February 18. The premium is a $2.16 credit per contract share and the stock at the time of entry was priced at $31.24.

The Implied Volatility Rank stands at 35.5%

Premium:$2.16Expire OTM
ACI-iron condorStrikeOddsDelta
Calls
Long38.0090.0%14
Break-even35.1677.5%28
Short33.0065.0%42
Puts
Short30.0057.0%36
Break-even27.1672.5%22.5
Long25.0088.0%9

The premium is 43.2% of the width of the positions short/long spreads. The profit zone covers a 12.5% move to the upside and a 15.0% move to the downside.

The risk/reward ratio is 1.3:1, with maximum risk of $284 and maximum reward of $216 per contract.

How I chose the trade. The trade was placed to coincide with ACI’s earnings announcement, before the opening bell on the day after entry. The short strikes were set to coincided with the expected move of $2.49 either way, based on options pricing, which gives a price range of $30.21 to $32.70.

By Tim Bovee, Portland, Oregon, January 10, 2021

Disclaimer

Tim Bovee, Private Trader tracks the analysis and trades of a private trader for his own accounts. Nothing in this blog constitutes a recommendation to buy or sell stocks, options or any other financial instrument. The only purpose of this blog is to provide education and entertainment.

No trader is ever 100 percent successful in his or her trades. Trading in the stock and option markets is risky and uncertain. Each trader must make trading decisions for his or her own account, and take responsibility for the consequences.

License
Creative Commons License

All content on Tim Bovee, Private Trader by Timothy K. Bovee is licensed under a Creative Commons Attribution-ShareAlike 4.0 International License.

Based on a work at www.timbovee.com.
Trader’s Notebook

3:30 p.m. New York time

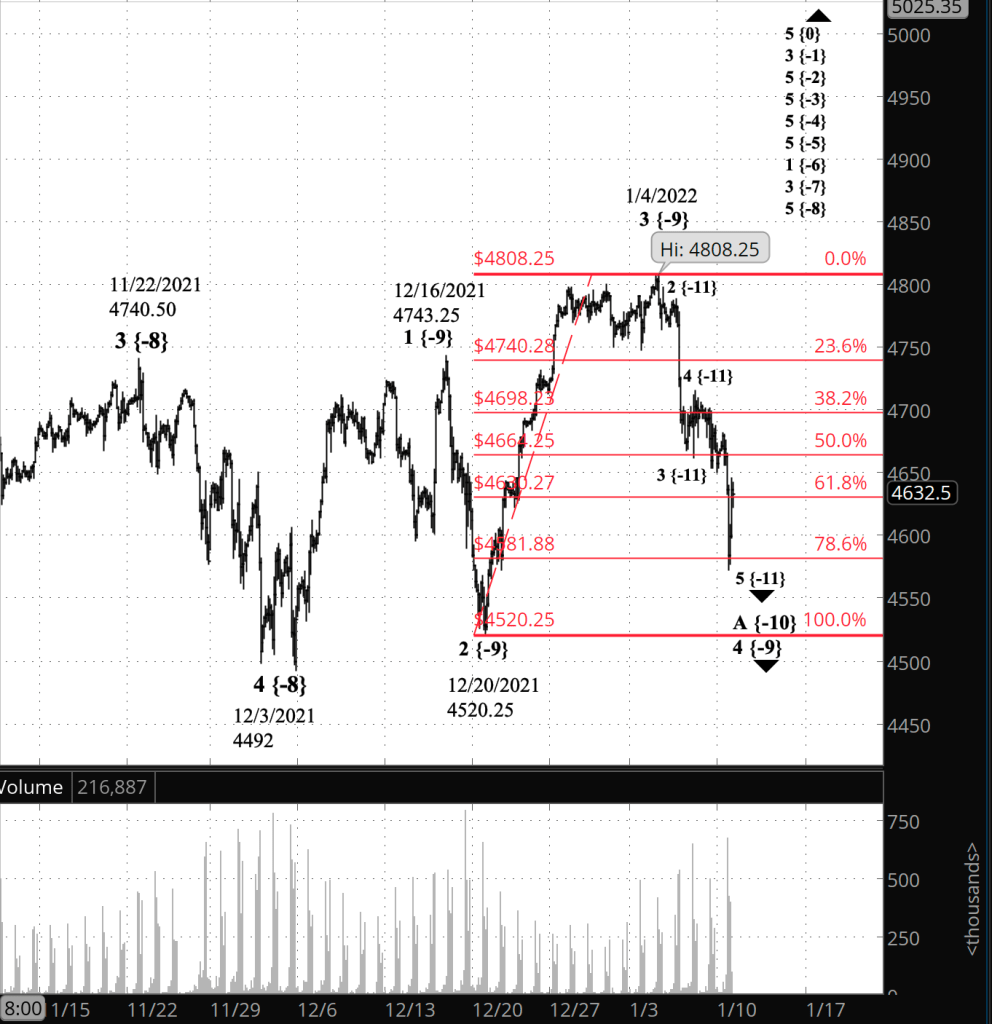
Half an hour before the closing bell. The S&P 500 futures dropped below the 78.6% Fibonacci retracement level and then reversed back to the 61.8% level. The rise back up looks like a 4th wave correction within downtrending wave 5{-11}. No change in the analysis. I’ve updated the chart.

11:30 a.m. New York time

Another trade. I erred in trading ACI as shares. It’s a perfectly good trade, but ACI also works as a potentially more profitable options position. So I’ve doubled down and entered a short iron condor position on ACI and posted an analysis of the trade.

10:45 a.m. New York time

My trades. I exited my short iron condor earnings play on PAYX after 20 days for an 89.2% return, or a 1,630% annual rate. I’ve updated the trade analysis with full results.

I also exited by long shares earnings play on TLRY for a 14.2% return over three days (including the weekend) for a 1,722% annual rate.

I’ve entered a new long shares position on ACI, which publishes earnings on Tuesday before the opening bell. Options pricing suggests a $1.27 move in either direction from the $31.98 entry price. Zacks’ Earnings Surprise Predictor gives a likelihood score of 6.25% and ranks ACI as “Buy”.

9:35 a.m. New York time

What’s happening now? The S&P 500 E-mini futures declined in overnight trading, coming close to the 61.8% retracement mark, a Fibonacci level.

What does it mean? The downward correction that began on January 4 from 4808.25 continues.

What’s the alternative? Or is it instead the first stages of a new downtrend? I sift through the evidence in the Elliott wave theory section below.

[S&P 500 E-mini futures at 3:30 p.m., 2-hour bars, with volume]

What does Elliott wave theory say? Internal wave counts are important in Elliott wave theory. Trending waves — “impulse waves” in the jargon — are always composed of five waves, and their internal wave counts are 5-3-5-3-5. Corrective waves come in threes, with several varieties of internal counts: Zigzags (5-3-5) and Flats (3-3-5). There are of course those pesky exceptions, such was Extensions and Triangles and compound corrections. Even so, internal wave counts allow us to understand where we are in the pattern and what lies ahead.

So where are the S&P 500 futures and index, and what lies ahead for them?

The starting point for where we are now is the January 4 high, which by my count was the end of an impulse wave, 3{-9}, which began on December 20. If my labeling it as a 3rd wave is correct — there are always ambiguities in Elliott, always — then the ensuing 4th wave decline is most likely a Zigzag or a Flat.

Fourth waves tend to be a different pattern than the preceding 2nd wave — “alternation” in the jargon. In this case, wave 2{-9} appears to have been a Zigzag, although it declined so quickly that it’s hard to get a good internal wave count. So in the normal course of things, wave 4{-9} would be a Flat.

But it’s not. It is now in its 5th wave internally, and that would fit a Zigzag (5-3-5) and not a Flat (3-3-5). Alternation is a tendency, not a firm rule, so a Zigzag wouldn’t be unheard of in this position. Nonetheless, it is a bit of a departure from the norm.

It could also be one of the exceptions to the three-wave rule for corrections, and that is a Triangle, which as five waves internally, with four of them being Zigzags. If the internal wave A is part of a Triangle, then it could very well have five wave internally, labelled A-B-C-D-E.

And the other pattern that fits is that a downtrending impulse wave began on January 4. Under this scenario, my 3{-9} count for the January 4 peak is incorrect — that peak isn’t the end of a 3rd wave. It is, instead, the end of a 5th wave: wave 5{-9}. Most waves in charts, I’ve found, have sufficient ambiguity to produce such a difficulty. And indeed, I found the internal count of the parent wave, 5{-8} to be a difficult one.

Time will tell us which count is correct.

If the present 5th wave of the decline from January 4, within wave A{-10} is followed by a three-wave rise, wave B{-10} and then a five-wave decline, wave C{-10}, followed in turn by a rise above the January 4 peak, then we’ll know that it was a Zigzag correction.

If we see five waves at the {-10} degree, with the price remaining below the January 4 peak, then the correction was most likely a Triangle — unless it was an expanding Triangle, in which case the price might well move above the January 4 high.

If the end of the present wave 5{11} within wave A{-10} within wave 4{-9} is followed by full three-wave upward correction that stays below the January 4 peak — most likely a Zigzag (5-3-5) — and if it is then followed by a five-wave impulse wave to below the December 20 low, then the January 4 peak was the end of wave 5{-9}, the present decline was wave 1{-9}, the ensuing upward movement, will be wave 2{-9} and the drop below the December 20 low will be wave 3{-9}, all of this with the declining impulse wave 1{-8}.

I’m tempted to conclude that it’s a complex time on the chart, but honestly, it’s always complex. The stock market patterns discovered by R.N. Elliott are an amazingly complex web of fractal patterns, nested the smaller within the larger like Russian matryoshka dolls. Wheels within wheels. But, I always try to remember, that complexity can be unravelled and its implications understood.

Learning and other resources. Elliott wave analysis provides context, not prophecy. As the 20th century semanticist Alfred Korzybski put it this way in his book Science and Sanity (1933), “The map is not the territory … The only usefulness of a map depends on similarity of structure between the empirical world and the map.” And I would add, in the ever-changing markets, we can judge that similarity of structure only after the fact.

See the menu page Analytical Methods for a rundown on where to go for information on Elliott wave analysis.

By Tim Bovee, Portland, Oregon, January 10, 2022

Disclaimer

Tim Bovee, Private Trader tracks the analysis and trades of a private trader for his own accounts. Nothing in this blog constitutes a recommendation to buy or sell stocks, options or any other financial instrument. The only purpose of this blog is to provide education and entertainment.

No trader is ever 100 percent successful in his or her trades. Trading in the stock and option markets is risky and uncertain. Each trader must make trading decisions for his or her own account, and take responsibility for the consequences.

License
Creative Commons License

All content on Tim Bovee, Private Trader by Timothy K. Bovee is licensed under a Creative Commons Attribution-ShareAlike 4.0 International License.

Based on a work at www.timbovee.com.
Trader’s Notebook

3:30 p.m. New York time

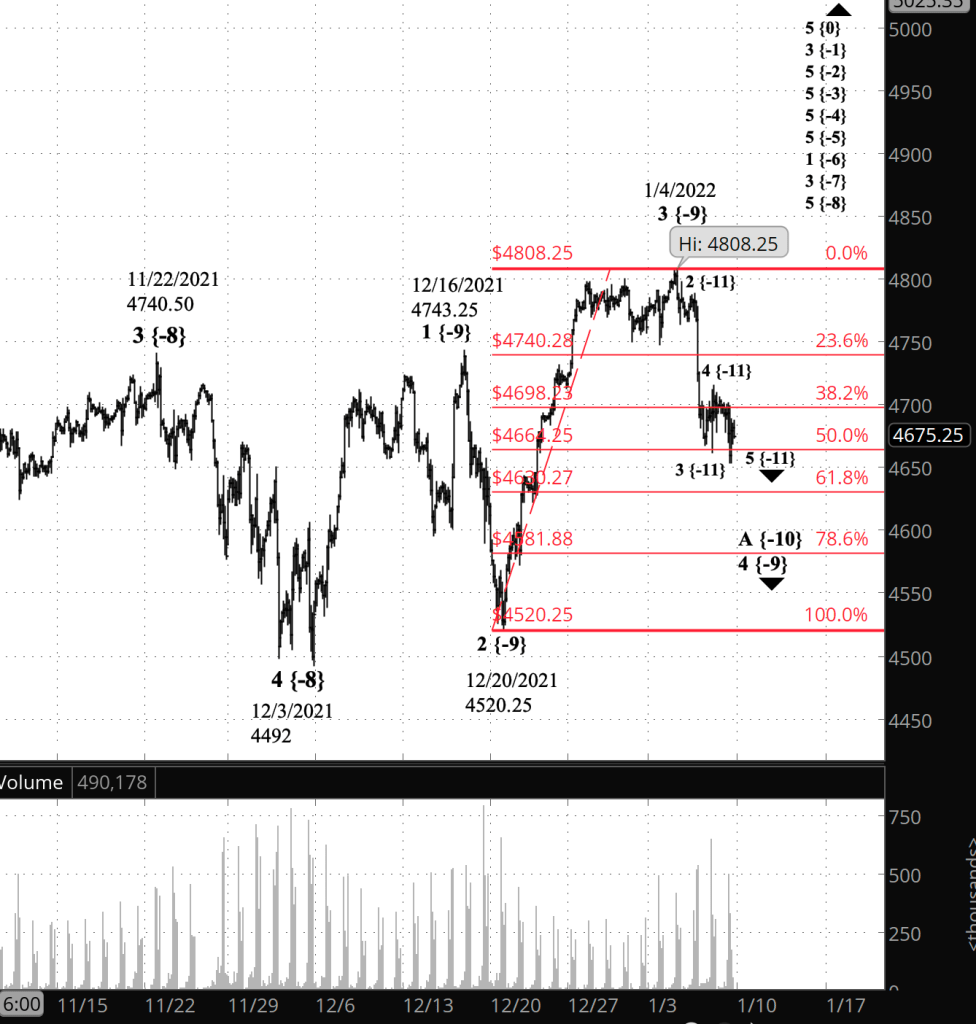
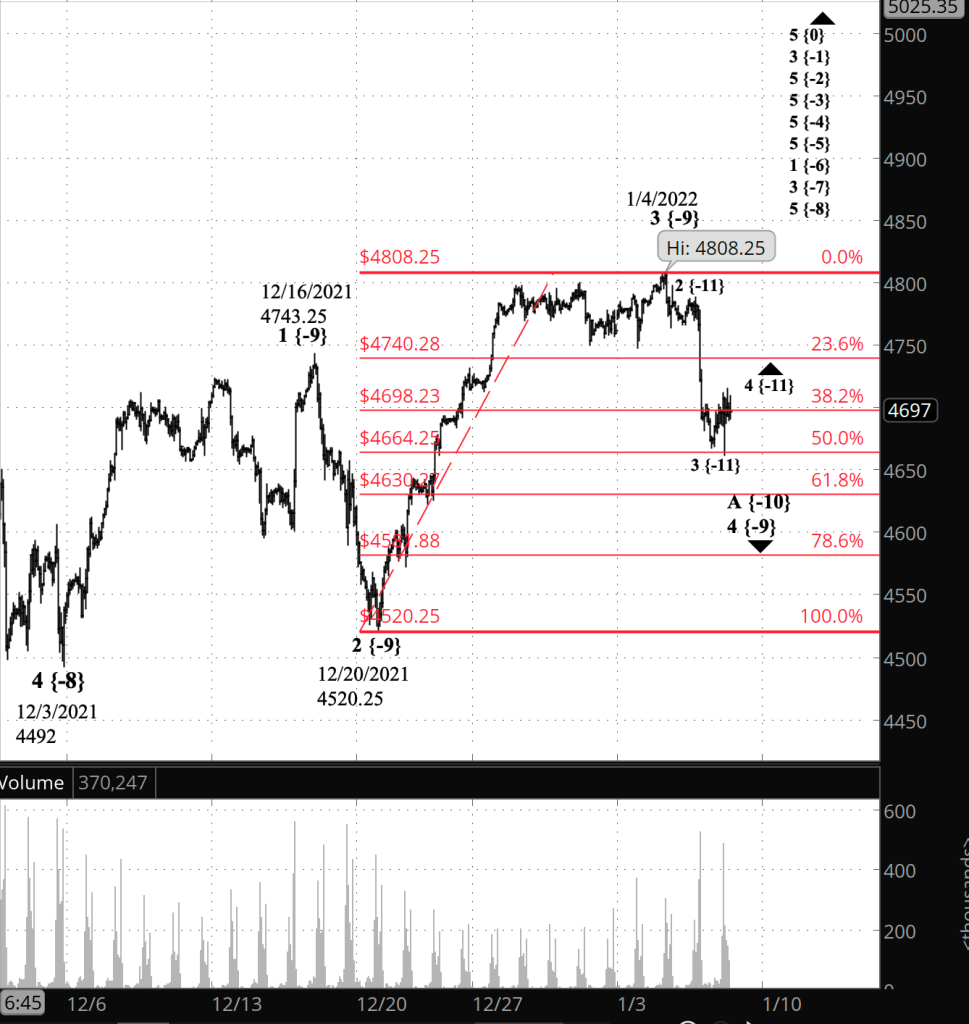
Half an hour before the closing bell. The S&P 500 moved down a bit further, and it’s possible that the final wave internal to wave A{-10} is now underway. At least that’s how I’ve marked the chart. No other change in the analysis. I’ve updated the chart.

3 p.m. New York time

WBA earnings play exit. I’ve exited my options earnings play on WBA for a 27% profit over two days and have updated my analysis with full results.

10:35 a.m. New York time

Trades today. No options trades in sight today.

In shares trades focused on earnings announcements:

  1. I’ve exited my long position on AYI for a 2.4% profit after earnings were published this morning before the opening bell, for an 866% annual rate. The price rose $3.17 above the expected move.
  2. I’ve entered a long position on TLRY, which publishes earnings on Monday before the opening bell. The entry price was $6.50. Based on options pricing, I expect TLRY to move $0.62 either way, or 9.6%, for a range from $5.90 to $7.14. The Zacks ranks is 3-Neutral, and the Earnings Surprise Predictor metric stands at 55.56%.

9:35 a.m. New York time

What’s happening now? The S&P 500 E-mini futures continued to trade in a narrow range, between two Fibonacci retracement points, 38.2% and 50% of the preceding rise.

What does it mean? The first wave of a downward correction from the January 4 peak is underway. It will be followed by an upward movement that I expect to remain below that peak, 4808.25, and then a second downward movement to complete the correction. Thereafter, the price will rise to new highs.

What’s the alternative? Corrections on occasion form a compound structure, linking two or three corrective patterns together. Should that occur, it would delay the rise to new heights. Nonetheless, the rise would follow completion of the correction.

[S&P 500 E-mini futures at 3:30 p.m., 2-hour bars, with volume]

What does Elliott wave theory say? The downward correction is wave 4{-9}, and within it, the three-wave pattern is in its first wave, A{-10}. It will be followed by wave B to the upside, which I expect to remain below the prior peak, 4808.25, and then wave C back to the downside. Wave A{-10} internally will have five waves, and it is presently in wave 4{-11}, an upward correction within the larger downward correction. That larger correction, wave 4{-9} will be followed by a 5th wave that will move above 4808.25, perhaps significantly so. At its peak wave 5{-9} will mark the completion of its parent, wave 5{-8}, which began on December 3 from 4492.

The alternative analysis differs only in how many corrective patterns will be within wave 4{-9}. If it works out as a compound structure, then wave C{-10} within 4{-9} will be followed by an X wave, which connections the first corrective pattern from the second pattern that will follow. Compound corrections can contain up to three corrective patterns.

Learning and other resources. Elliott wave analysis provides context, not prophecy. As the 20th century semanticist Alfred Korzybski put it this way in his book Science and Sanity (1933), “The map is not the territory … The only usefulness of a map depends on similarity of structure between the empirical world and the map.” And I would add, in the ever-changing markets, we can judge that similarity of structure only after the fact.

See the menu page Analytical Methods for a rundown on where to go for information on Elliott wave analysis.

By Tim Bovee, Portland, Oregon, January 7, 2022

Disclaimer

Tim Bovee, Private Trader tracks the analysis and trades of a private trader for his own accounts. Nothing in this blog constitutes a recommendation to buy or sell stocks, options or any other financial instrument. The only purpose of this blog is to provide education and entertainment.

No trader is ever 100 percent successful in his or her trades. Trading in the stock and option markets is risky and uncertain. Each trader must make trading decisions for his or her own account, and take responsibility for the consequences.

License
Creative Commons License

All content on Tim Bovee, Private Trader by Timothy K. Bovee is licensed under a Creative Commons Attribution-ShareAlike 4.0 International License.

Based on a work at www.timbovee.com.
Trader’s Notebook

3:30 p.m. New York time

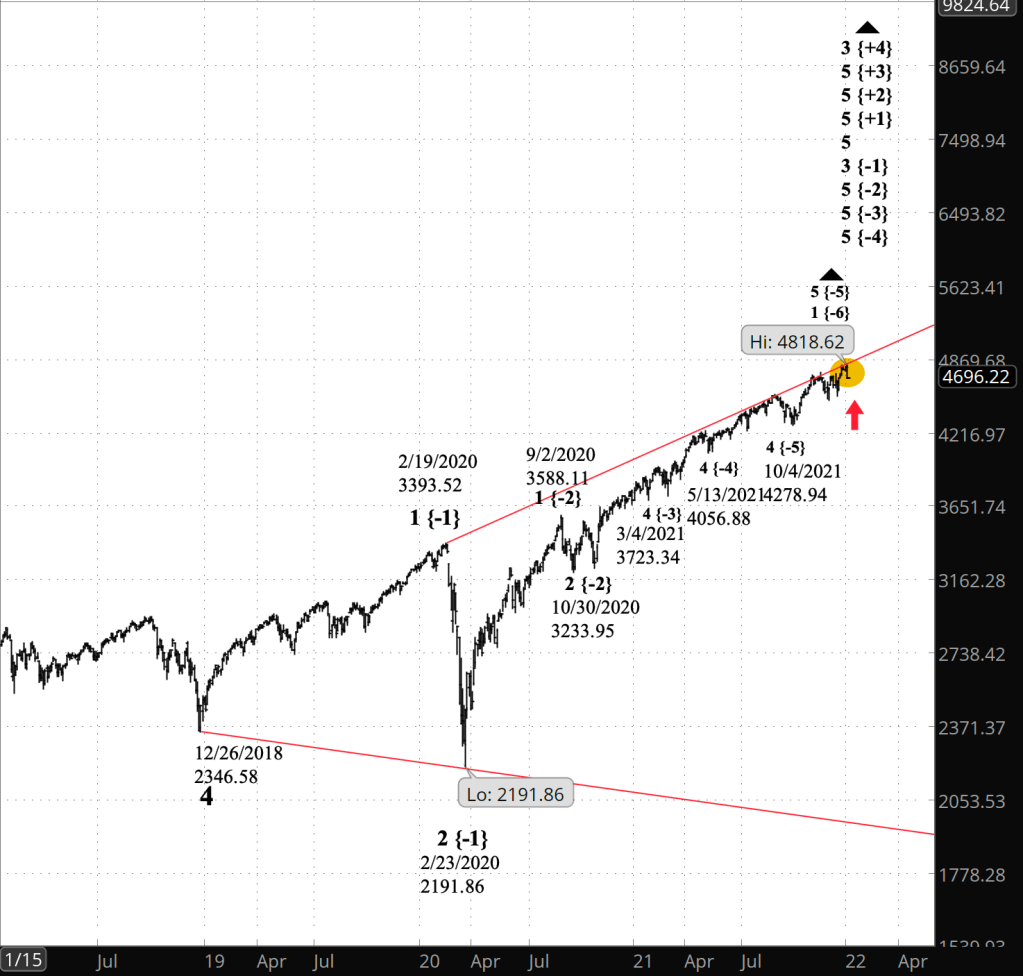
Half an hour before the closing bell. The S&P 500 bounced during the day between two Fibonacci retracement levels: 50% and 38.2%. Wave A {-10} within the downtrending wave 4 {-9} correction continues. No change to the principal analysis. I’ve updated the upper, close-up chart.

10 a.m. New York time

Trades today. I’ve entered a long shares position on AYI, which publishes earnings before the opening bell tomorrow. The expected move is $4.58 in either direction, based on options pricing, and Zacks gives a 3.52% score to the likelihood of an upside earnings surprise, based on analyst revisions. The Zacks rank for AYI is Hold.

9:35 a.m. New York time

What’s happening now? The S&P 500 E-mini futures overnight retraced half of the rise from December 20 and then bounced back slightly. The decline from the January 4 high, 4808.25, covered 140.25 points, carrying the price down to 4668

What does it mean? By my principal analysis the January 4 peak ended the middle leg of the rise that began December 3 from 4492, and a correction is now underway.

What’s the alternative? If the January 4 peak is considered to have ended the final leg of the rise that began on December 3, then the January 4 peak marked the end of a month-long rise and isn’t a correction but instead is the beginning of a new downtrend.

[S&P 500 E-mini futures at 3:30 p.m., 75-minute bars, with volume]

What does Elliott wave theory say? I’ve changed the labelling of the January 4 peak to the {-9th} degree rather than the {-10th}. That labelling best matches subsequent events.

Under my principal analysis, wave 4 {-9} is underway. It’s first wave internally is on wave 4 {-11} in what will end up as a five-wave pattern that will complete wave A {-10}, the first of three waves that will form the correction. The five waves within the wave A {-10} mean that the correction is most likely taking the form of a Zigzag, whose wave structure is 5-3-5, as compared to a Flat, which is 3-3-5. The preceding wave 2 {-9} also took the form of a Zigzag. Normally, waves 2 and 5 alternate in their form, but not always. So perhaps this will work out to be one of exceptions.

Wave 4 {-9} will be followed by a 5th wave that will carry the price to new heights.

Under my alternative analysis, the January 4 peak ended wave 5 {-9}, and the soon-to-be-five waves of the subsequent decline are the 1st wave of a new downtrend. The count of the rise from December 20 is a bit muddy. I think the alternative analysis is unlikely, but it’s possible. The alternative will be confirmed if the price moves below the December 20 low, 4520.25.

I’ve a seen a couple of OMG! scare headlines this morning. To put the decline in perspective, here’s a chart showing the entirety of the expanding Diagonal Triangle, the form the market has taken since December 2018. The small tan circle at the right side of the price line, pointed to by a large red arrow, is the decline since January 4. In the larger scheme of things, not yet a big deal, although it could develop into a significant move.

[S&P 500 index at 9:30 a.m., 2-day bars]

Learning and other resources. Elliott wave analysis provides context, not prophecy. As the 20th century semanticist Alfred Korzybski put it this way in his book Science and Sanity (1933), “The map is not the territory … The only usefulness of a map depends on similarity of structure between the empirical world and the map.” And I would add, in the ever-changing markets, we can judge that similarity of structure only after the fact.

See the menu page Analytical Methods for a rundown on where to go for information on Elliott wave analysis.

By Tim Bovee, Portland, Oregon, January 6, 2022

Disclaimer

Tim Bovee, Private Trader tracks the analysis and trades of a private trader for his own accounts. Nothing in this blog constitutes a recommendation to buy or sell stocks, options or any other financial instrument. The only purpose of this blog is to provide education and entertainment.

No trader is ever 100 percent successful in his or her trades. Trading in the stock and option markets is risky and uncertain. Each trader must make trading decisions for his or her own account, and take responsibility for the consequences.

License
Creative Commons License

All content on Tim Bovee, Private Trader by Timothy K. Bovee is licensed under a Creative Commons Attribution-ShareAlike 4.0 International License.

Based on a work at www.timbovee.com.
LW Trade

Lamb Weston Holdings Inc. (LW)

Update 1/18/2022: I exited my short iron condor position on LW 31 days before expiration, for a $1.22 debit per contract/share, a profit before fees of $43.00 per contract. Shares were trading at $67.99, up $4.37 from the entry level.

The Implied Volatility Rank at exit was 18.7%, down 37.7 points from the entry level.

I exited because the position exceeded 25% of maximum potential profit, my normal exit point for earnings plays.

Shares rose by 6.9% over 13 days for a 192% annual rate. The options position produced a 35.2% return for a 990% annual rate.


I have entered a short iron condor spread on LW, using options that trade for the last time 44 days hence, on February 18. The premium is a $1.65 credit per contract share and the stock at the time of entry was priced at $63.62.

The Implied Volatility Ratio stands at 56.4%

Premium:$1.65Expire OTM
LW-iron condorStrikeOddsDelta
Calls
Long75.009211
Break-even71.6546.417.5
Short70.0080.0%24
Puts
Short60.0064.0%31
Break-even56.6573.5%22.5
Long55.0083.0%14

The premium is 33% of the width of the positions short/long spreads. The profit zone covers a 12.6% move to the upside and a 12.3% move to the downside.

The risk/reward ratio is 2:1, with maximum risk of $335 and maximum reward of $165 per contract.

How I chose the trade. The trade was placed to coincide with LW’s earnings announcement, before/ the opening bell on the day after entry. The short strikes were set to coincided with the expected move of $0.87 either way, based on options pricing, which gives a price range of $62.43 to $64.17.

By Tim Bovee, Portland, Oregon, January 5, 2022

Disclaimer

Tim Bovee, Private Trader tracks the analysis and trades of a private trader for his own accounts. Nothing in this blog constitutes a recommendation to buy or sell stocks, options or any other financial instrument. The only purpose of this blog is to provide education and entertainment.

No trader is ever 100 percent successful in his or her trades. Trading in the stock and option markets is risky and uncertain. Each trader must make trading decisions for his or her own account, and take responsibility for the consequences.

License
Creative Commons License

All content on Tim Bovee, Private Trader by Timothy K. Bovee is licensed under a Creative Commons Attribution-ShareAlike 4.0 International License.

Based on a work at www.timbovee.com.

WBA Trade

Walgreens Boots Alliance Inc. (WBA)

Update 1/7/2022: I exited my short iron condor position on WBA 42 days before expiration, for a $1.05 debit per contract/share, a profit before fees of $56 per contract. Shares were trading at $53.93, down $0.53 from the entry level.

The Implied Volatility Rank at exit was 12.3%, down 20.2 points from the entry level.

I exited because the position had neared 25% of maximum potential profit, my normal exit point for earnings plays.

Shares declined by 1% over two days for a -178% annual rate. The options position produced a 26.7% return for a 4,867% annual rate.


I have entered a short iron condor spread on WBA, using options that trade for the last time 44 days hence, on February 18. The premium is a $1.33 credit per contract share and the stock at the time of entry was priced at $54.46.

The Implied Volatility Ratio stands at 32.5%

Premium:$1.33Expire OTM
WBA-iron condorStrikeOddsDelta
Calls
Long62.5093.0%10
Break-even58.8383.5%20.5
Short57.5074.0%31
Puts
Short50.0075.0%21
Break-even46.3383.0%14
Long45.0091.0%7

The premium is 26.6% of the width of the positions short/long spreads. The profit zone covers an 8% move to the upside and a 17.5% move to the downside.

The risk/reward ratio is 2.8:1, with maximum risk of $367 and maximum reward of $133 per contract.

How I chose the trade. The trade was placed to coincide with WBA’s earnings announcement, before the opening bell on the day after entry. The short strikes were set to coincided with the expected move of $2.06 either way, based on options pricing, which gives a price range of $52.00 to $56.12.

By Tim Bovee, Portland, Oregon, January 5, 2022

Disclaimer

Tim Bovee, Private Trader tracks the analysis and trades of a private trader for his own accounts. Nothing in this blog constitutes a recommendation to buy or sell stocks, options or any other financial instrument. The only purpose of this blog is to provide education and entertainment.

No trader is ever 100 percent successful in his or her trades. Trading in the stock and option markets is risky and uncertain. Each trader must make trading decisions for his or her own account, and take responsibility for the consequences.

License
Creative Commons License

All content on Tim Bovee, Private Trader by Timothy K. Bovee is licensed under a Creative Commons Attribution-ShareAlike 4.0 International License.

Based on a work at www.timbovee.com.

CAG Trade

Conagra Brands Inc. (CAG)

Update 1/11/2022: I exited my short iron condor position on CAG 39 days before expiration, for a $0.67 debit per contract/share, a profit before fees of $22 per contract. Shares were trading at $33.99, down $0.64 from the entry level.

The Implied Volatility Rank at exit was 15.1%, down 30.7 points from the entry level.

I exited because the position reached 25% of maximum potential profit, my normal exit point for earnings plays.

Shares declined by 1.8% over six days for a 112% annual rate. The options position produced a 32.8% return for a 1,998% annual rate.


I have entered a short iron condor spread on CAG, using options that trade for the last time 44 days hence, on February 18. The premium is a $0.89 credit per contract share and the stock at the time of entry was priced at $34.63.

The Implied Volatility Rank stands at 45.5%.

Premium:$0.89Expire OTM
CAG-iron condorStrikeOddsDelta
Calls
Long39.00196
Break-even36.890.960.5
Short36.0080.0%25
Puts
Short33.0067.0%29
Break-even30.8978.0%19
Long30.0089.0%9

The premium is 35.6% of the width of the positions short/long spread. The profit zone covers a 15.2% move to the upside and a 12.1 move to the downside).

The risk/reward ratio is 2.4:1, with maximum risk of $211 and maximum reward of $89 per contract.

How I chose the trade. The trade was placed to coincide with CAG’s earnings announcement, before the opening bell on the day after entry. The short strikes were set to coincided with the stocks expected move of $1.05 either way, based on options pricing, which gives a price range of $33.55 to $35.65.

By Tim Bovee, Portland, Oregon, January 5, 2022

Disclaimer

Tim Bovee, Private Trader tracks the analysis and trades of a private trader for his own accounts. Nothing in this blog constitutes a recommendation to buy or sell stocks, options or any other financial instrument. The only purpose of this blog is to provide education and entertainment.

No trader is ever 100 percent successful in his or her trades. Trading in the stock and option markets is risky and uncertain. Each trader must make trading decisions for his or her own account, and take responsibility for the consequences.

License
Creative Commons License

All content on Tim Bovee, Private Trader by Timothy K. Bovee is licensed under a Creative Commons Attribution-ShareAlike 4.0 International License.

Based on a work at www.timbovee.com.

Trader’s Notebook

3:30 p.m. New York time

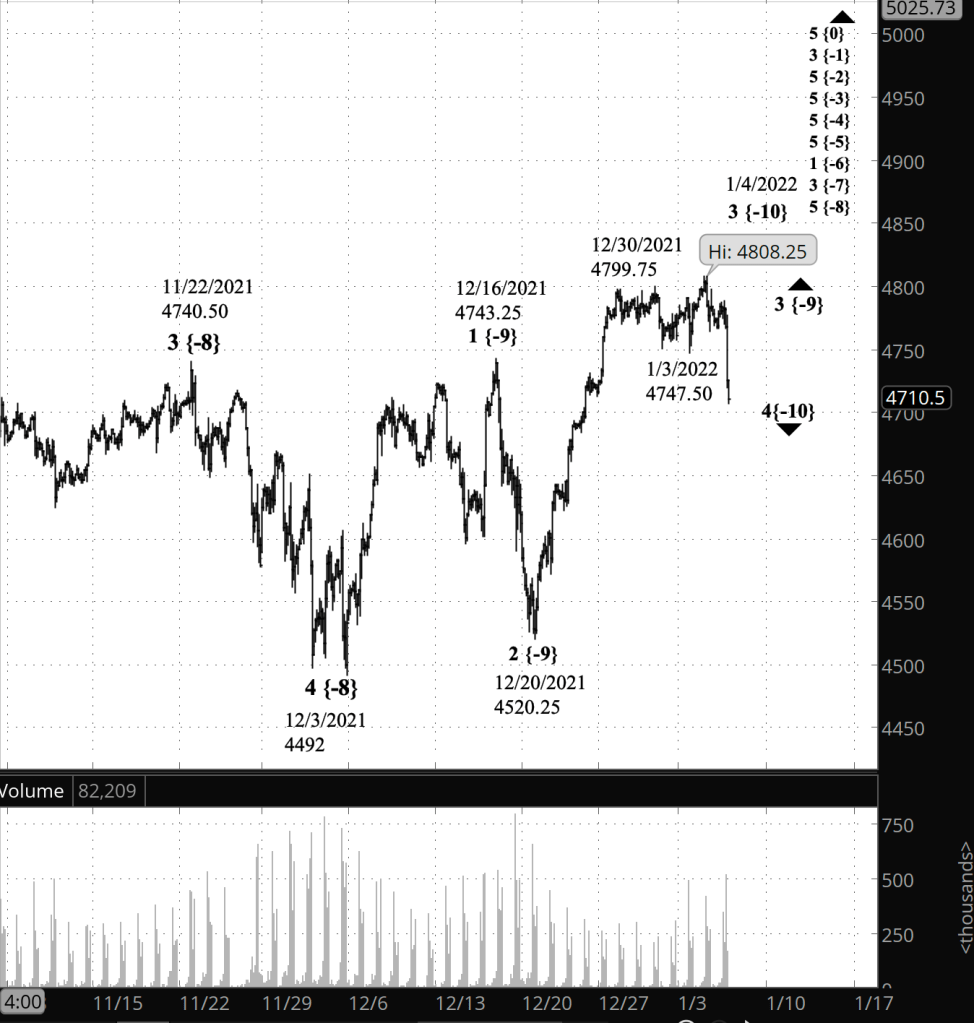
Half an hour before the closing bell. The S&P 500 took a sharp turn to the downside. I’m promoting my alternative analysis to principal and interpreting the decline to mean that wave 4 {-10} is still underway. This 4th wave is a downward correction within uptrending wave 3 {-9} within uptrending wave 5 {-8}. I’ve updated the chart to reflect the changes in my analysis.

2:40 p.m. New York time

Earnings play on LW. I’ve entered a short iron condor position on WBA timed to coincide with tomorrow morning’s earnings announcement and have posted an analysis of the trade.

2:15 p.m. New York time

Earnings play on WBA. I’ve entered a short iron condor position on WBA timed to coincide with tomorrow morning’s earnings announcement and have posted an analysis of the trade.

1:15 p.m. New York time

Earnings play on CAG. I’ve entered a short iron condor position on CAG timed to coincide with tomorrow morning’s earnings announcement and have posted an analysis of the trade.

10 a.m. New York time

Trades today. I’ll be looking at three earnings plays using options: A bull put spread on LW, a bear call spread on CAG, and possibly an iron condor on WBA. I looked at a long shares earnings play on STZ, but directionally it looks like a downward move to me so I’m passing. STZ has options, but it isn’t liquid enough to meet my standards. I’ll be posting analyses of the options trades as they are placed.

9:35 a.m. New York time

What’s happening now? The S&P 500 E-mini futures rose slightly in overnight trading.

What does it mean? The rise that began on January 3 continues, within the larger uptrend that began on December 20.

What’s the alternative? The correction that began on December 30 could still be underway. A push of the futures above the January 4 high, 4808.25, will eliminate this alternative analysis and confirm the principal analysis.

[S&P 500 E-mini futures at 3:30 p.m., 2-hour bars, with volume]

What does Elliott wave theory say? Under the principal analysis, wave 5 {-10} began on January 3 and is still taking its early, tentative steps. It will rise above 4808.25 — the January 4 high — perhaps significantly above that level.

This is all happening with wave 3 {-9}, which began on December 20, and one degree higher, within wave 5 {-8} which began on December 3 from 4492.

The alternative analysis recognizes that wave 4 {-10}, the correction that began on January 3, could still be underway. Only when the price rises above 4808.25 will this possibility be eliminated.

Learning and other resources. Elliott wave analysis provides context, not prophecy. As the 20th century semanticist Alfred Korzybski put it this way in his book Science and Sanity (1933), “The map is not the territory … The only usefulness of a map depends on similarity of structure between the empirical world and the map.” And I would add, in the ever-changing markets, we can judge that similarity of structure only after the fact.

See the menu page Analytical Methods for a rundown on where to go for information on Elliott wave analysis.

By Tim Bovee, Portland, Oregon, January 5, 2022

Disclaimer

Tim Bovee, Private Trader tracks the analysis and trades of a private trader for his own accounts. Nothing in this blog constitutes a recommendation to buy or sell stocks, options or any other financial instrument. The only purpose of this blog is to provide education and entertainment.

No trader is ever 100 percent successful in his or her trades. Trading in the stock and option markets is risky and uncertain. Each trader must make trading decisions for his or her own account, and take responsibility for the consequences.

License
Creative Commons License

All content on Tim Bovee, Private Trader by Timothy K. Bovee is licensed under a Creative Commons Attribution-ShareAlike 4.0 International License.

Based on a work at www.timbovee.com.