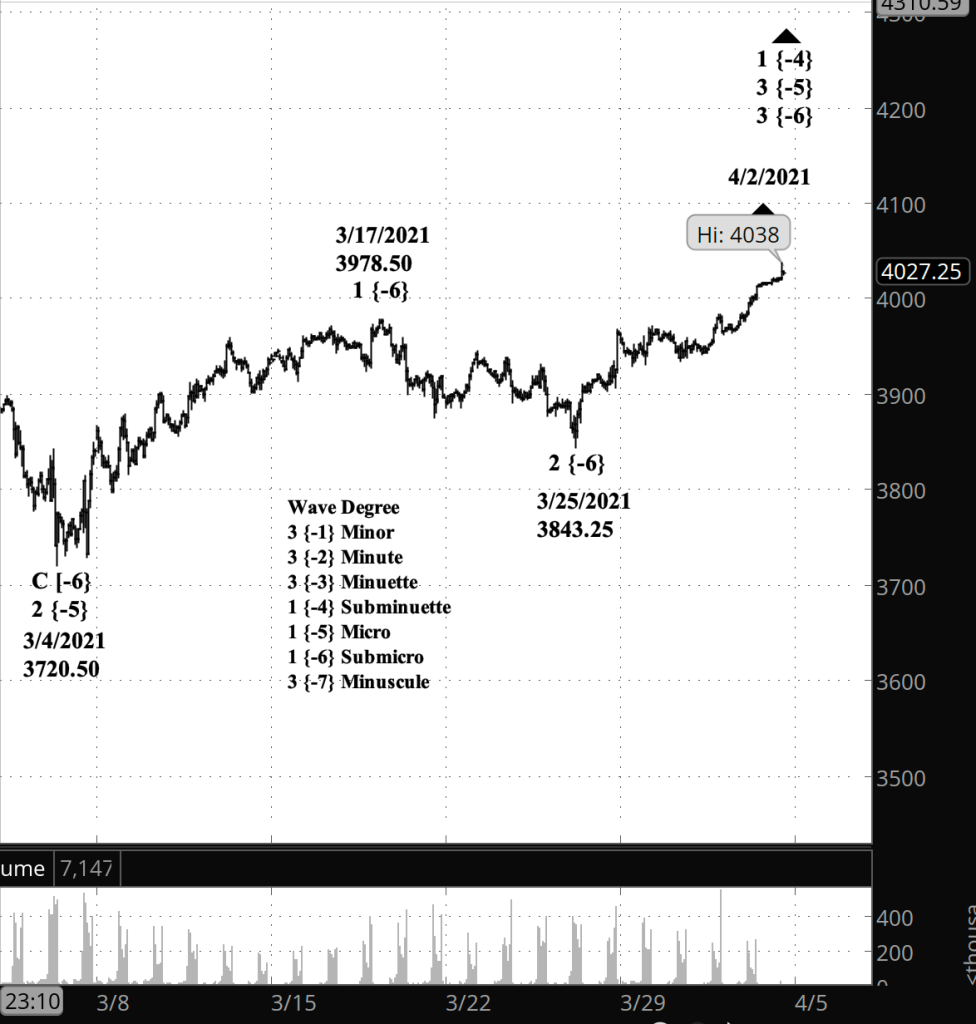
What’s happening now? Although the U.S. stock markets are closed for a holiday, the S&P 500 E-mini futures continued to trade overnight, rising 25.5 points from the close of Thursday’s session, to 4038. This will be the final update today.
What does it mean? The uptrend that began March 25 from 3843.25 is still underway.
[S&P 500 E-mini futures at 9:50 a.m., 70-minute bars, with volume]
What does Elliott wave theory say? The near-term uptrend is wave 3 of Submicro degree within a rising series of parent waves stretching up to wave 3 of Supercycle degree, which began in 1932. Submicro 3 will be followed by a shallow 4th wave correction and then a final 5th wave push higher that, when complete, will signal the start of a downtrend, all the up to the Supercycle degree.
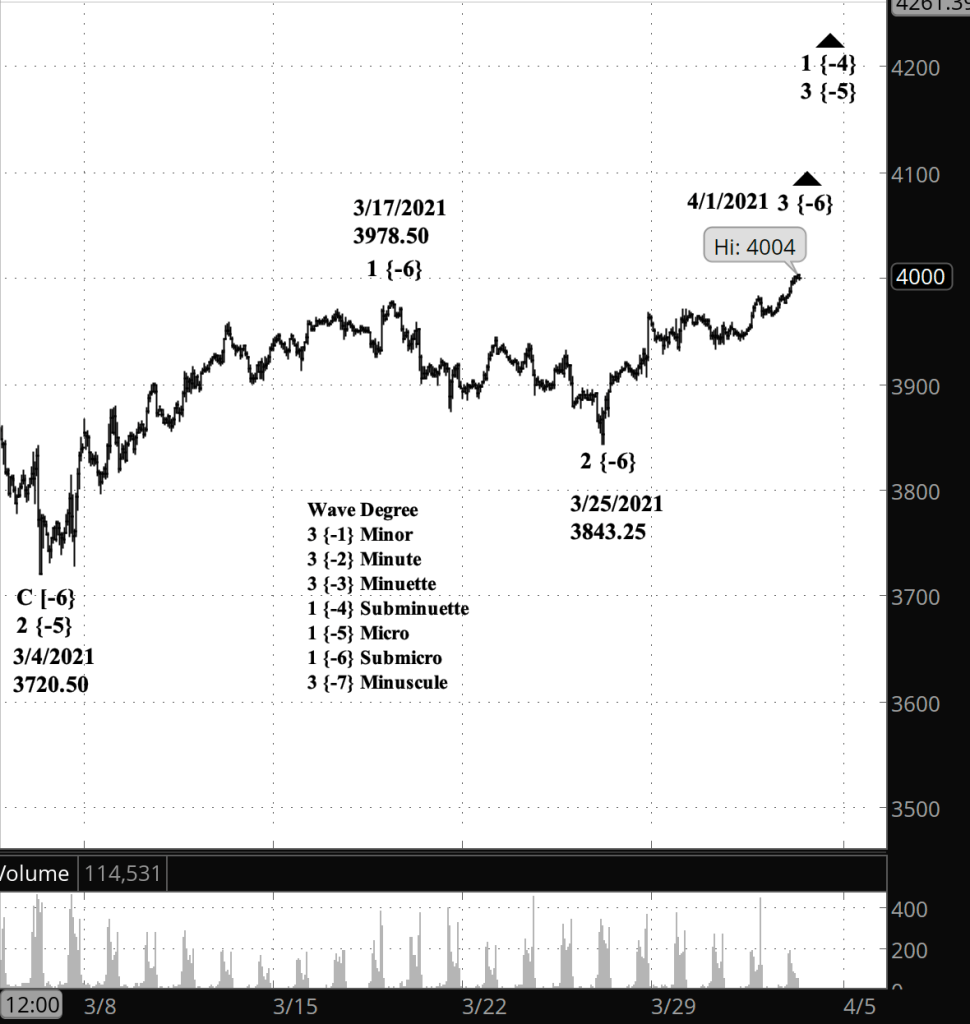
Half an hour before the closing bell. The S&P 500 continued its upward crawl, reaching a high so far today of 4004 on the E-mini futures, 4014.34 on the index. No change to the analysis. I’ve updated the chart below.
10 a.m. New York time
Calendar note: The U.S. stock markets will be closed on Friday for the Easter holiday. The bond and futures markets will close early on Friday, at 12 noon New York time.
What’s happening now? The S&P 500 rose to a new high at the opening, 3991.50 on the E-mini futures and 4002.42 on the index.
What does it mean? The uptrend that began on March 25 is continuing, the final leg of a larger uptrend that began on March 4.
What are the alternatives? At this point I have none. I’ve relabeled the chart to conform to my principle analysis.
[S&P 500 E-mini futures at 3:30 p.m., hourly bars, with volume]
What does Elliott wave theory say? On the chart I’ve labelled the present wave as the 3rd of Submicro {-6} degree within wave 3 of Micro {-5} degree, selecting the degree to conform in duration with my labelling prior to the beginning of Micro 3. This is all happening within wave 5 of Subminuette {-4} degree, which began on October 30, 2020, part of the major uptrend that began on February 23, 2020 as wave 3 of Primary {-3} degree
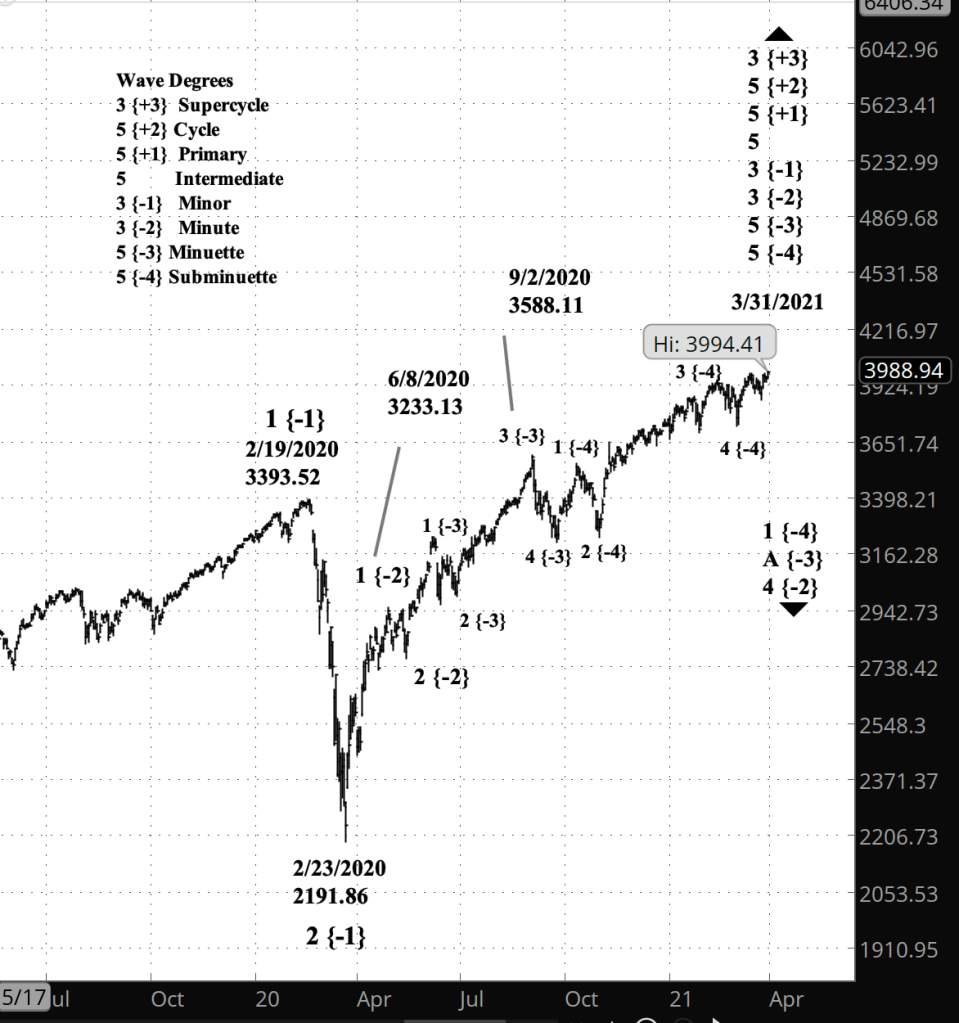
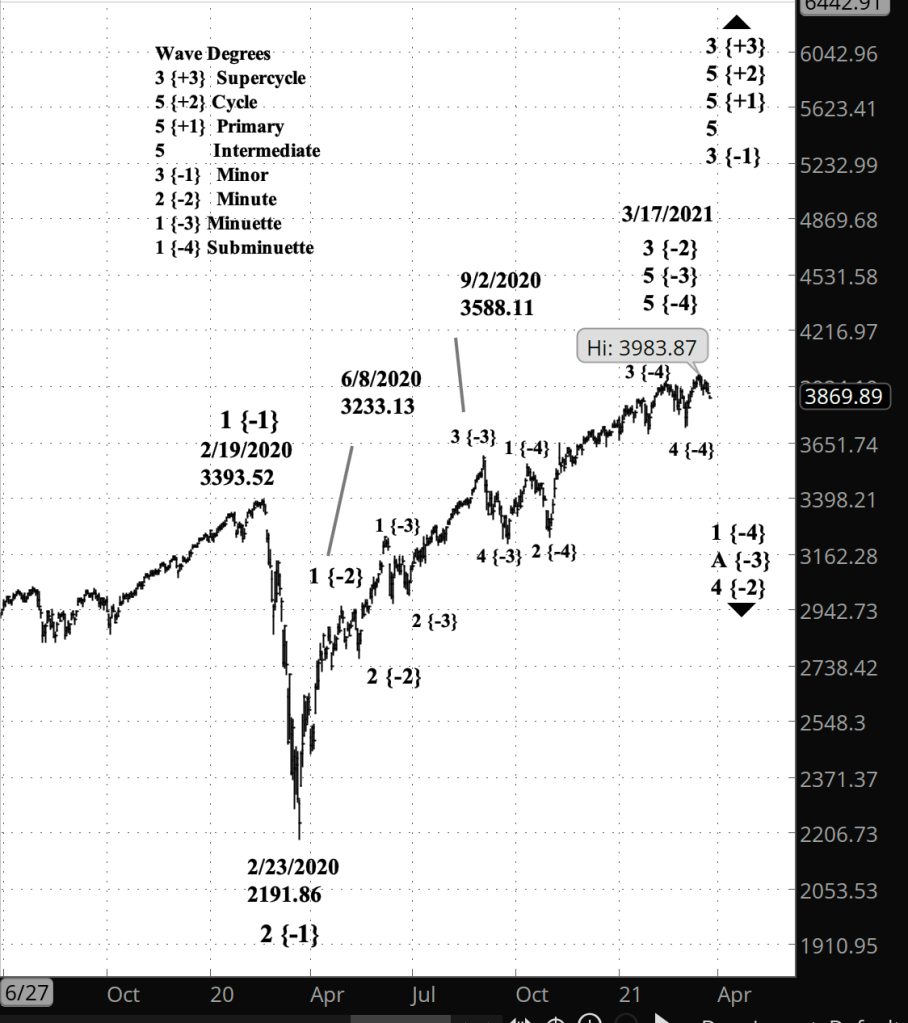
Half an hour before the closing bell. The S&P 500 broke above the high of March 17, so far to 3983.75 on the futures and 3994.41 on the index, following the course of my alternative analysis. That means that the uptrend is still in place. Rather than changing the chart below from this morning, I’ve added in a long-term chart to show where we now stand and shall update the short-term chart for Thursday morning’s post.
Bottom line: The uptrend is still in place. We are presently in wave 5 of Subminuette degree.
[S&P 500 index at 3:32 a.m., daily bars]
9:40 a.m. New York time
What’s happening now? The S&P 500 E-mini futures continued their so-far-shallow decline from yesterday’s peak.
What does it mean? By my principle analysis, the decline is the early stage of a significant decline from the March 17 peak, 3978.50 on the futures, 3983.87 on the index.
What are the alternatives? If the price should rise above the March 17 peak, then it would invalidate my principle analysis, showing that the uptrend that began in February 2020 is still underway. If the price moves above yesterday’s high, 3971.25 on the futures, then the upward correction that began March 25 is still underway.
[S&P 500 E-mini futures at 9:36 a.m., 30-minute bars, with volume]
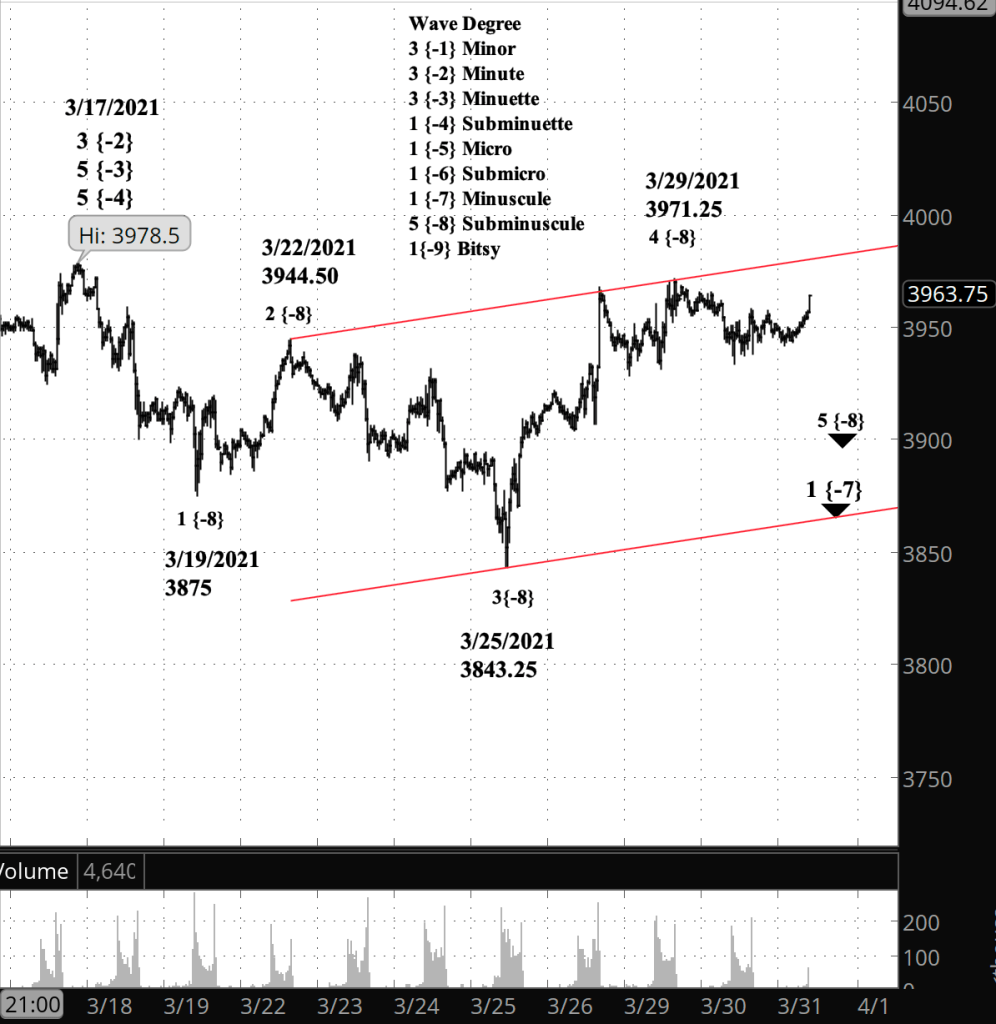
What does Elliott wave theory say? Yesterday’s peak was the end of wave 4 and the beginning of wave 5, both of Subminuscule degree, within wave 1 of Minuscule degree, and first waves up several degrees, to Subminuette degree. These are motive ways, moving in the direction of the main trend, which is down. First waves tend to be undramatic, and the following 2nd wave generally takes back much of the ground covered by wave 1. The true drama — “capitulation”, in the language of trading — comes with the 3rd wave.
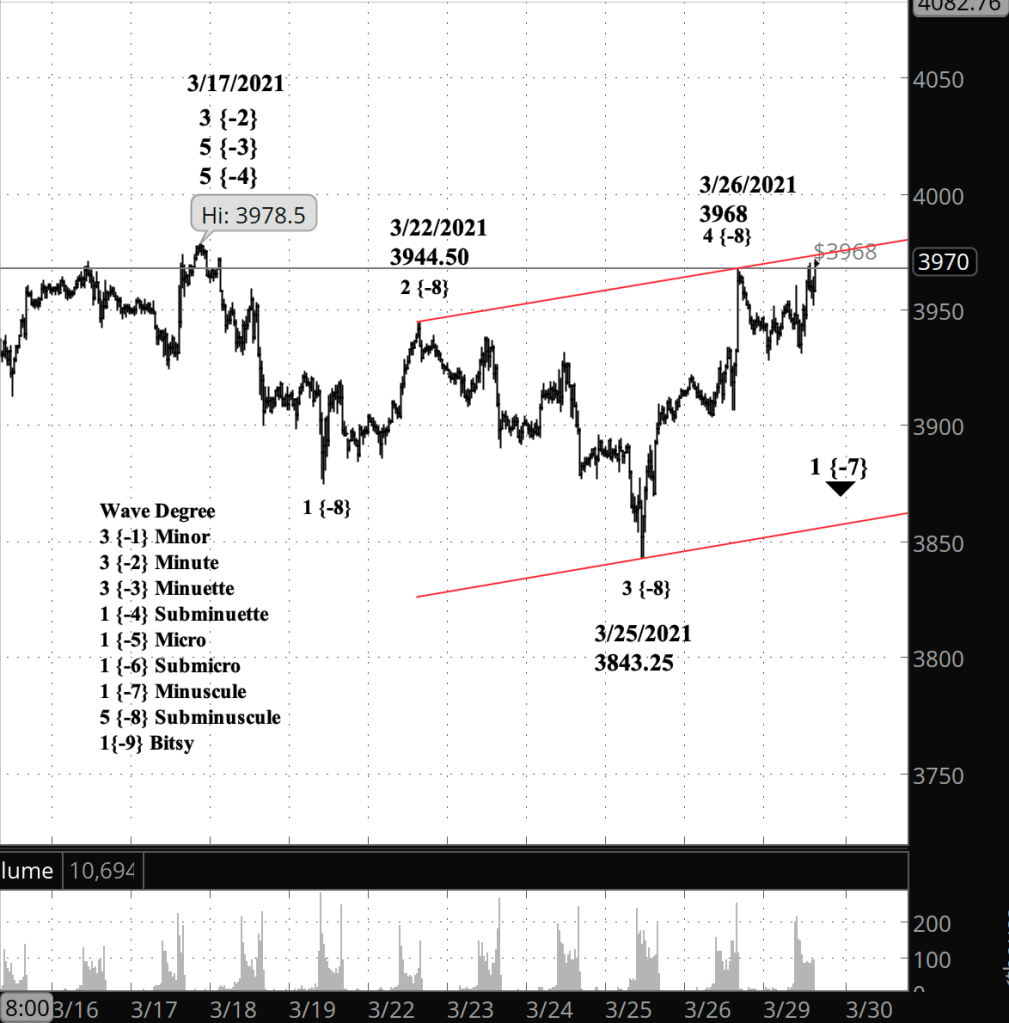
I’ve added a price channel (red lines) for the Subminuscule degree, with an upper boundary defined by the start of wave 3 and wave 5, and a lower boundary defined by the end of wave 3.
Half an hour before the closing bell. The S&P 500 dawdled throughout the day, remaining so far within a range of less than 30 points. No change to the analysis. I’ve updated the chart below.
10 a.m. New York time
What’s happening now? The S&P 500 E-mini futures dropped off from yesterday’s peak.
What does it mean? Yesterday’s ambiguities in the chart remain. I’m retaining my principle analysis, which puts the end of the correction at yesterday’s peak.
What are the alternatives? Alternatively, yesterday’s peak marks the end of a leg within correction and the correction is continuing.
[S&P 500 E-mini futures at 3:30 p.m., 30-minute bars, with volume]
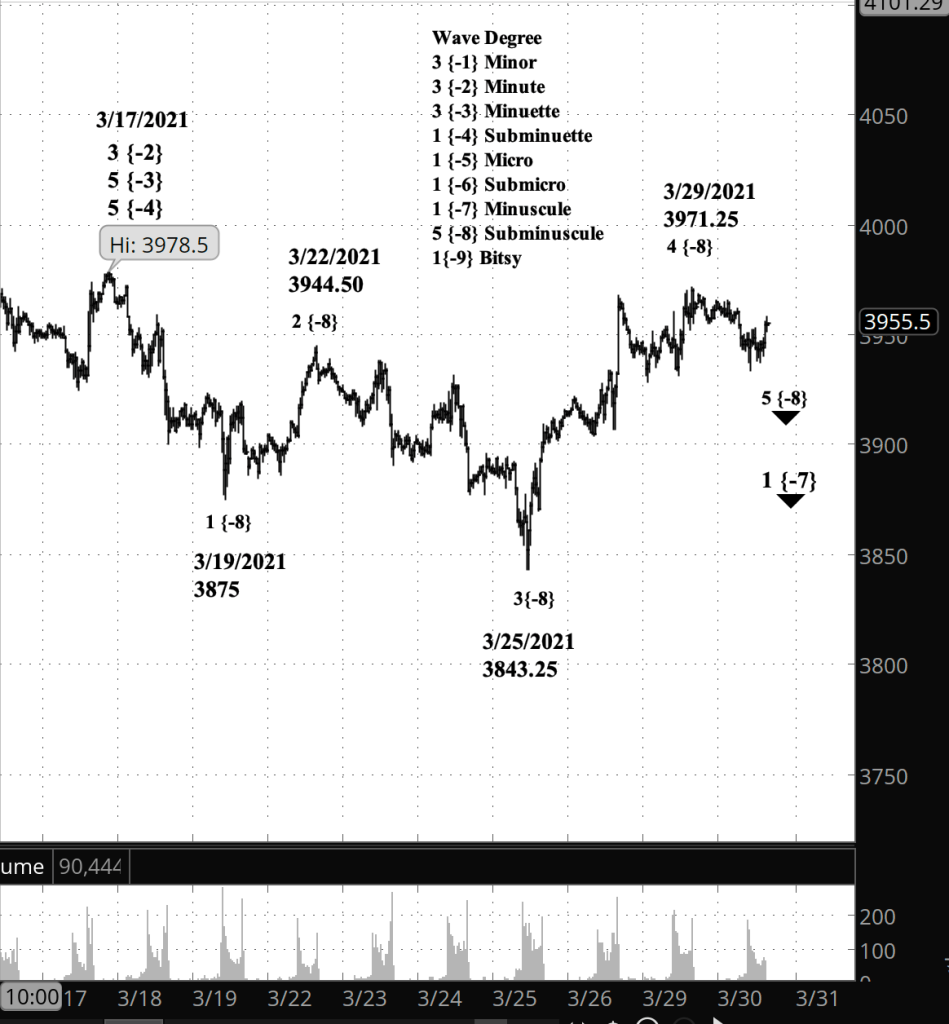
What does Elliott wave theory say? Unchanged from yesterday. The alternatives I tried out either violated rules of Elliott wave analysis or were misshapen in ways that detracted from their credibility. Ending wave 4 of Subminuscule degree at the March 29 high of 3971.25 seems to be the most straightforward reading of the chart. Under this analysis yesteday marked the beginning of wave 5 of Subminuscule degree.
If the price resumes its rise and moves above the March 17 high of 3978.50, the end of the rise of Minuette degree, then the entire analysis of the rise from February of last year will need to be revisited.
If the price falls below 3843.25, the low of March 25, then then Subminuscule wave 5 is confirmed.
Half an hour before the closing bell. The S&P 500 moved above Friday’s high of 3968 on the index, to 3970.25., and a high of 3978.19 on the index, to 3968. I dislike this chart immensely. Wave 2 of Subminuscule degree seems overly shallow for a 2nd wave, and wave 4 seems overly robust. And there’s the whole breaking past the end of wave 3, which isn’t strictly forbidden, but it certainly casts doubt on the count.
I think the most likely alternative is that wave 4 of Subminuette degree is still underway, and the rise from February 23, 2020 is not yet complete. I’ve left the chart numbering as it was, and will present a renumbered version in Tuesday’s post. I’ve updated the priceline in the chart below, but not the wave numbers.
9:35 a.m. New York time
What’s happening now? The S&P 500 E-mini futures declined from Friday’s peak, 3968, in overnight trading, reaching 3928.75 today hours before the opening bell.
What does it mean? The decline adds weight to the idea idea that Friday’s peak marked the end of the upward correction that began on March 25 and the beginning of a downtrend that will end in the 3850s or below.
What are the alternatives? First alternative: The decline from Friday could be followed by a second corrective pattern, and if that proves to be the case, then the correction is still underway. More on this in the Elliott wave section, below.
Second alternative: And if the price moves above Friday’s peak, then the chart will demand a recount showing that the rise that began on February 23, 2020 is sitill in progress.
[S&P 500 E-mini futures at 9:34 a.m., 30-minute bars, with volume]
What does Elliott wave theory say? By my principle count, Friday’s high was the end of wave 4 of Subminuscule degree and the beginning of wave 5. My first alternate count has wave 4 still in progress, with the decline since Friday being an X wave, which separates two corrective patterns within a compound correction structure.
How to tell the difference? If wave 5 is underway, then the first downward wave, the 1st of Bitsy degree, will have five waves internally. It will be a standard impulse wave. If wave 4 is extending into a compound structure, then the X wave will have three subwaves in its downward move: A down, B up and C down. At this low level I think we’ll know which is happening within a day or two.
On the assumption that my principle analysis is correct, that wave 5 of Subminuscule degree began on March 26, I’ve added in a price channel (red lines) for the Minuscule wave 1 downtrend that began on March 17, connecting the beginnings of Subminuscule waves 3 and 5 for the upper boundary and the end of Subminuscule wave 3 for the lower boundary.
It’s an uptrending channel for the internals of a downtrending wave. If Subminuscule wave 5 stays within the channel boundaries, then it will be truncated, failing to move below the end of the preceding wave 3. It would not be surprising if wave 5 broke through the boundary in a throw-over move, the kind of move that in 5th wave can sometimes turnout to be quite dramatic in the extent to which it moves beyond the boundary. For 5th waves, the channel boundary is often nothing more than a gentle suggestion.
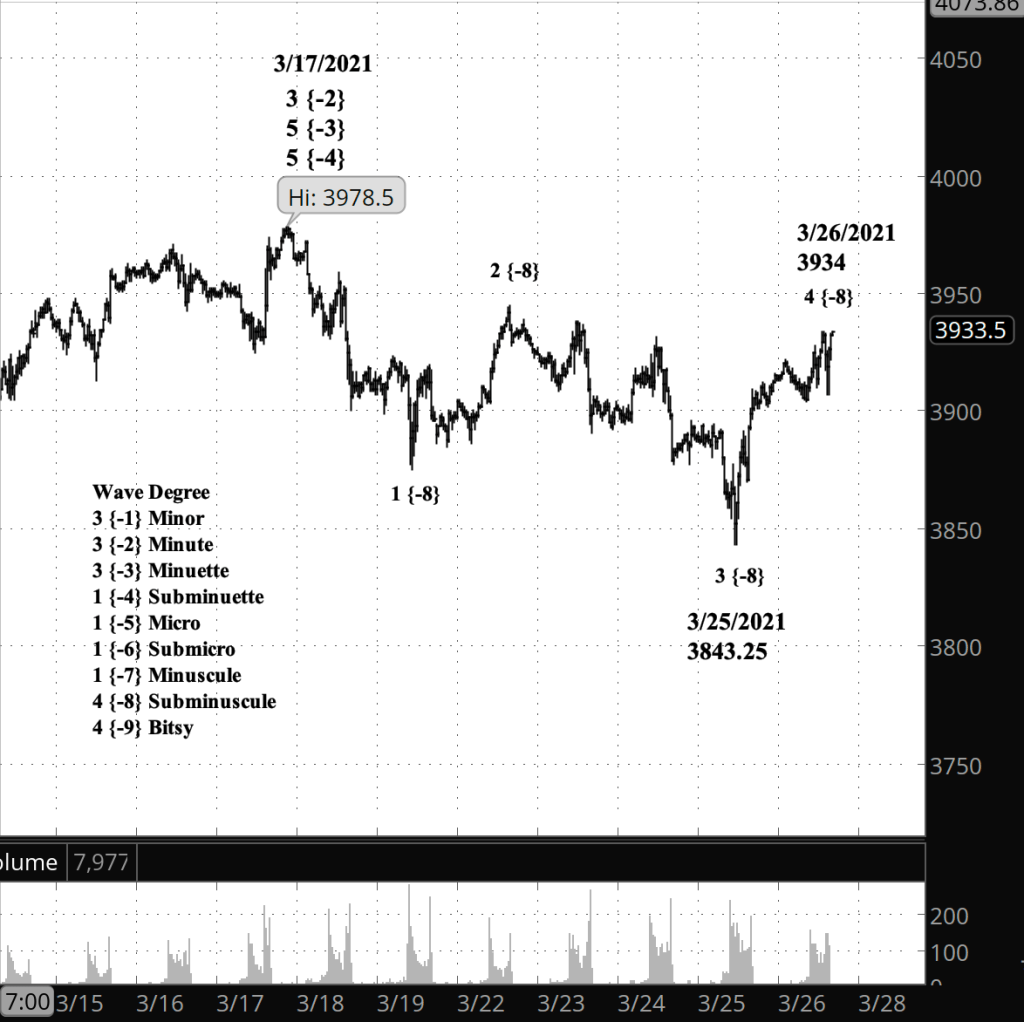
Half an hour before the closing bell. The S&P 500 has risen slightly above the morning high, to 3934 on the E-mini futures, 3919.54 on the index. It is unclear whether that level marks the end of wave 4 of Subminuscule degree. I’ve updated the chart.
9:55 a.m. New York time
What’s happening now? The S&P 500 E-mini futures continued to rise overnight, completing an upward correction within a larger downtrend.
What does it mean? The correction will be followed by a resumption of the downtrend as the prices drops below yesterday’s low, 3843.25.
What are the alternatives? The upward correction has the potential of extending in a net sideways movement before it is complete.
[S&P 500 E-mini futures at 3:30 p.m., 30-minute bars, with volume]
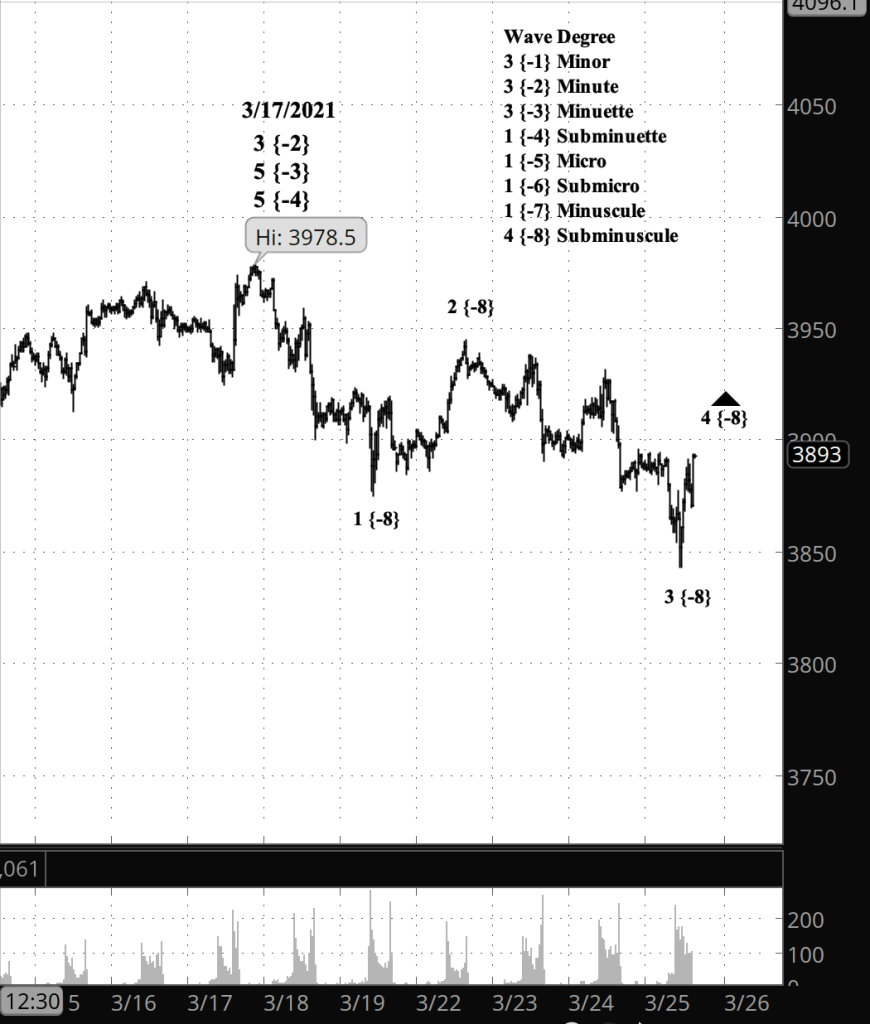
What does Elliott wave theory say? The upward correction, wave 4 of Subminuscule degree, appears to have within it three waves, meaning it has satisfied the rules of Elliott wave theory. The declining middle wave within Subminuscule 4 — a B wave — is quite small compared to the rising waves that surround it, so it is impossible that the rise we’ve seen since yesterday was in fact only the A wave of Bitsy degree. A decline of the price below the start of Subminuscule 4, from 3843.25, will be proof that the 4th wave is complete, eliminating the alternative analysis. A move above today’s high so far, 3921.50, will prove that Subminuscule 4 is still underway and will have at least two more waves of Bitsy degree within it before it conclues.
An hour before the closing bell. The S&P 500 continues the early downward movements of a 4h wave correction at the Minute degree. Here’s a chart of the E-mini futures showing details of the decline that began March 17 from 3978.50 (3983.87 on the index).
[S&P 500 E-mini futures at 3 p.m., 30-minute bars, with volume]
9:35 a.m. New York time
What’s happening now? The S&P 500 index, having peaked on March 17 at 3983.87 — the E-mini futures equivalent is 3978.50 — continues to work through the early phases of a decline.
What does it mean? The downward movement is a correction at higher levels, but to traders more interested in the shorter term — weeks or months — the decline will present itself as a downtrend. See the Elliott wave section for further discussion.
What is the alternative? It is possible that the final upward push of the trend that began February 20, 2020 is not yet complete, that 3983.87 is not the peak. If that proves to be the case, then there will be more net gain in the S&P 500’s near future.
[S&P 500 index at 9:35 a.m., daily bars]
What does Elliott wave theory say? The March 17 peak marks the end of wave 5 of Subminuette degree and its parent wave 5 of Minuette degree. In turn, the end of those 5th waves marks the end of wave 3 of Minute degree, one degree higher than Minuette.
So at the Minuette degree, the index has begun a 4th wave correction to the downside. But what does that look like?
The first wave within a correction is an A wave, and an A wave within wave 4 can have either three subwaves if it is the beginning of a Flat pattern or five subwaves if it is the start of a Zigzag.
At this higher degree, wave A is presently within its first subwave, wave 1 of Minuette degree, which will look like any 1st wave: Five subwaves, just like any movement in the direction of the main trend.
The bottom line is that the word “trend” in Elliott wave analysis is a complex concept. Each wave in the direction of a trend — 1, 3 or 5 — has within it at each smaller degree counter-trend corrections as well as trending movements. Whether “the market” is in an uptrend or a downtrend depends upon what degree we’re looking at.
To my thinking that fractal complexity gives Elliott wave analysis much of its power.
What does this mean for my trading? My options trades generally last a few weeks, and so I’ll be treating this market as downtrending, at the Minuette degree and smaller. Yesterday I exited my options position that expired April 16. The next monthly series expires April 21, which gives me an optimal entry date of April 6, within a window stretching from March 30 to April 13.
Half an hour before the closing bell. The S&P 500 continued its three-wave downward correction, having reached a low of 3898.25 on the futures so far today, and is presently in its final leg, wave C of Subbitsy degree within wave 2 of Bitsy degree. The correction is occurring within a rising wave, the 5th of Subminuscule degree. I’ve updated the chart below.
The completion of wave C will mark the beginning of wave 3 of Bitsy degree, which will carry the price into the 3940s and perhaps even higher.
10:30 a.m. New York time
Trade results. I’ve updated my NIO Trade post with results and an analysis of what went right.
9:45 a.m. New York time
My trade. I’ve exited my short iron condor options spread on NIO for 50% of maximum potential profit, which was my target price. I shall update the NIO Trade entry analysis shortly.
9:40 a.m. New York time
What’s happening now? The S&P 500 E-mini futures rose overnight in the second leg of a downward correction.
What does it mean? The correction is likely to reach completion quickly and will be followed by a rise to new highs.
What are the alternatives? My prior analysis had suggested, as an alternative, that the rise from March 19 might have been the prelude to a third corrective pattern, but I’m taking that off the table and have no alternative analysis at this point.
[S&P 500 E-mini futures at 3:30 p.m., 10-minute bars, with volume]
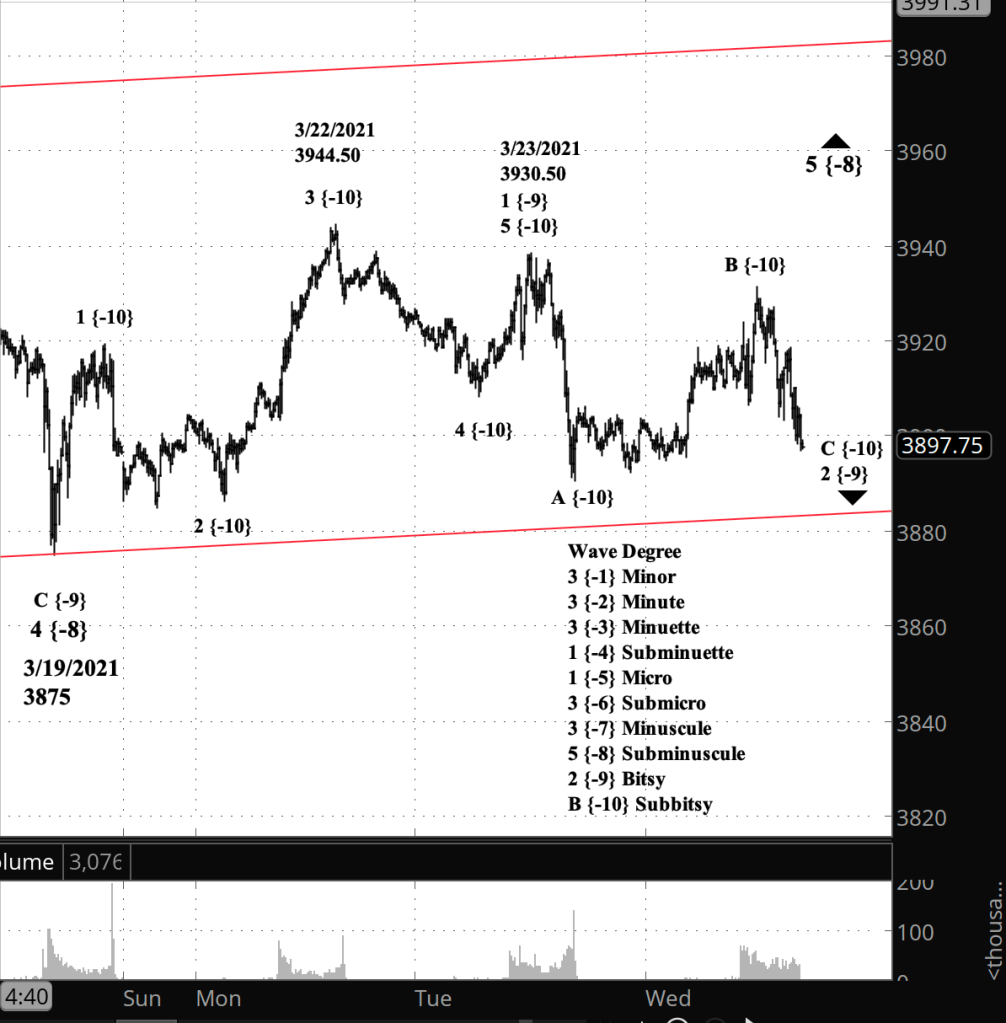
What does Elliott wave theory say? I’ve moved the chart in for a close-up so as to better track the subwaves of the rise from March 19. The price channel (red lines) is for Subminuscule degree, which began on March 9. (See yesterday’s post to view the full channel.)
So here’s where we are. Within uptrending wave 5 of Subminuscule degree, wave 1 of Bitsy degree ended yesterday, March 23, with a truncated 5th wave of Subbitsy degree at 3930.50, and Bitsy wave 2 began. Within wave 2 of Bitsy degree, downtrending wave A of Subbitsy degree fell sharply to completion yesterday, and subsequently the price rose in wave B of Subbitsy degree, which is still underway.
Second waves are generally simple Zigzags, dramatic in their scope and over quickly. Once Bitsy wave 2 is complete, wave 3 of Subminuscule degree will begin its rise. Third waves tend to be energetic, and I expect this 3rd wave to carry the price significantly closer to the price channel’s upper boundary.
Half an hour before the closing bell. The S&P 500 reversed to the downside in trading today after completing a 5-wave uptrend of a small degree — perhaps Bitsy degree, perhaps even smaller. The downside reversal would be correction, and I expect the upward trend to resume soon with another 5-wave pattern. I’ve updated the chart below.
10 a.m. New York time
What’s happening now? The S&P 500 E-mini futures continued the rise that began on March 19 and at the opening bell was undergoing a lower level correction within that rise.
What does it mean? Completion of the rise, at around the 4000 level, will trigger a correction.
What are the alternatives? The rise could be an upward movement separating two corrective patterns rather than an uptrend
[S&P 500 E-mini futures at 3:30 p.m., 40-minute bars, with volume]
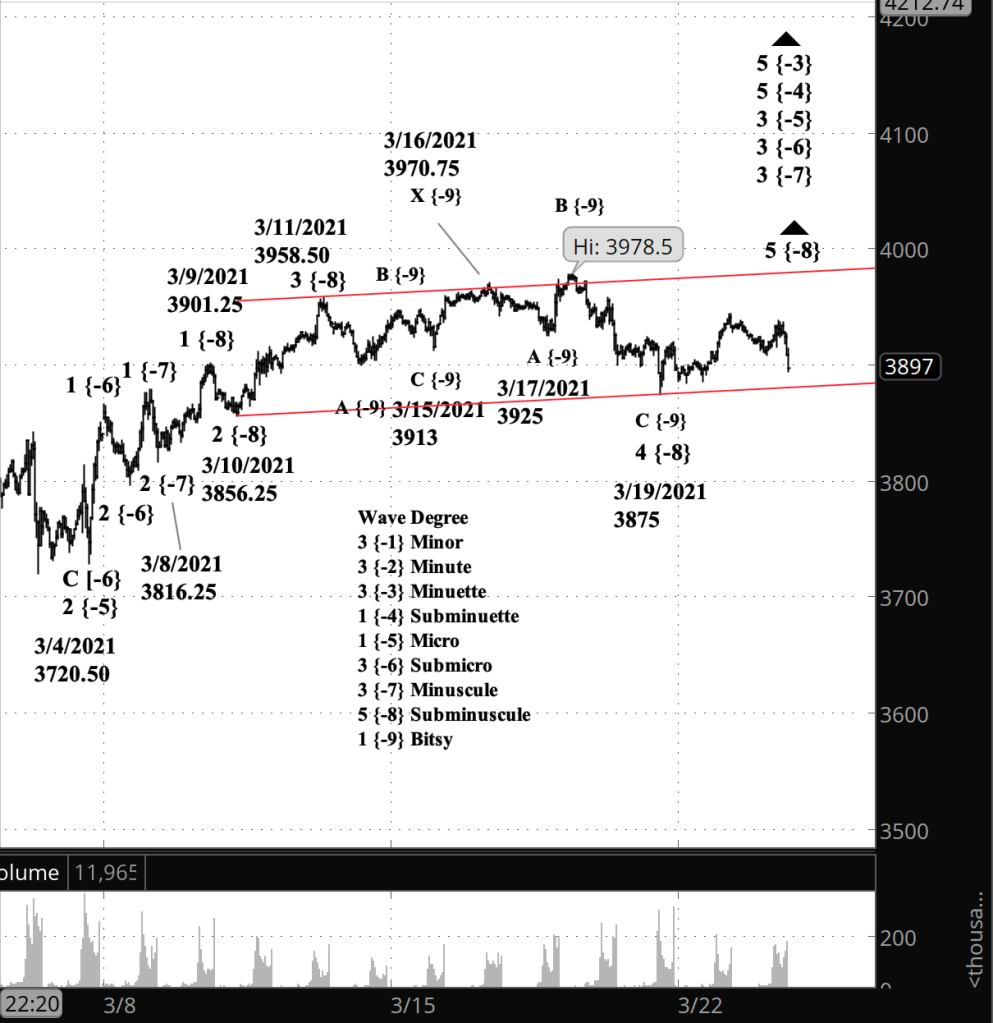
What does Elliott wave theory say? The rise from March 19 is wave 5 of Subminuscule degree. A line connecting the beginning points of Subminuscule waves 3 and 5, with a parallel line passing through the end of wave 3 produces a rather shallow price channel for the Subminuscule degree. If the price were to touch the channel’s upper boundary in the next few days, it would be in the 3980s. Fifth waves have a habit of occasionally breaking through the channel and continuing to rise much higher in an extended wave. And sometimes, 5th waves fall short, failing to exceed the peak of wave 3. So there’s no way to place a definite target for the present 5th wave rise.
Completion of Subminuscule 5 will also be the end of the parent wave, Minuscule 3, and will be followed by a 4th wave correction. Fourth waves tend to be shallow, although not always.
The alternative analysis defines the present rise as an X wave of Bitsy degree, a wave that separates the previous corrective pattern from one that will begin from the peak of wave X. The new corrective pattern would be the third within wave 4 of Subminuscule degree. I haven’t seen three patterns within a corrective wave very often, so I’m treating this as a the less likely prospect.
My trades. On Friday my short iron condor position on NIO will reach 21 days before expiration. If it’s profitable, then I exit on Friday. If unprofitable, then I try to salvage the situation by modifying the untested leg of the iron condor. Presently the position stands at 23% of maximum potential profit.
Half an hour before the closing bell. The S&P 500 continued to rise during the trading session, reaching a high so far of 3944.50. The pattern is consist with both the principle analysis (5th wave of Subminuscule degree) and the alternate analysis (X wave of Bitsy degree). I’ve updated the chart below.
9:40 a.m. New York time
What’s happening now? The S&P 500 E-mini futures continues to tentatively work through the early stages of an uptrend from the March 19 low of 3875.
What does it mean? Under my principle analysis, the rising price will eventually reach above the present high of 3978.50.
What are the alternatives? It’s possible that the correction that began March 11 is still underway, with the present rise being a link with a new corrective pattern. If the alternative proves out, the price will continue to fluctuate within a narrow range.
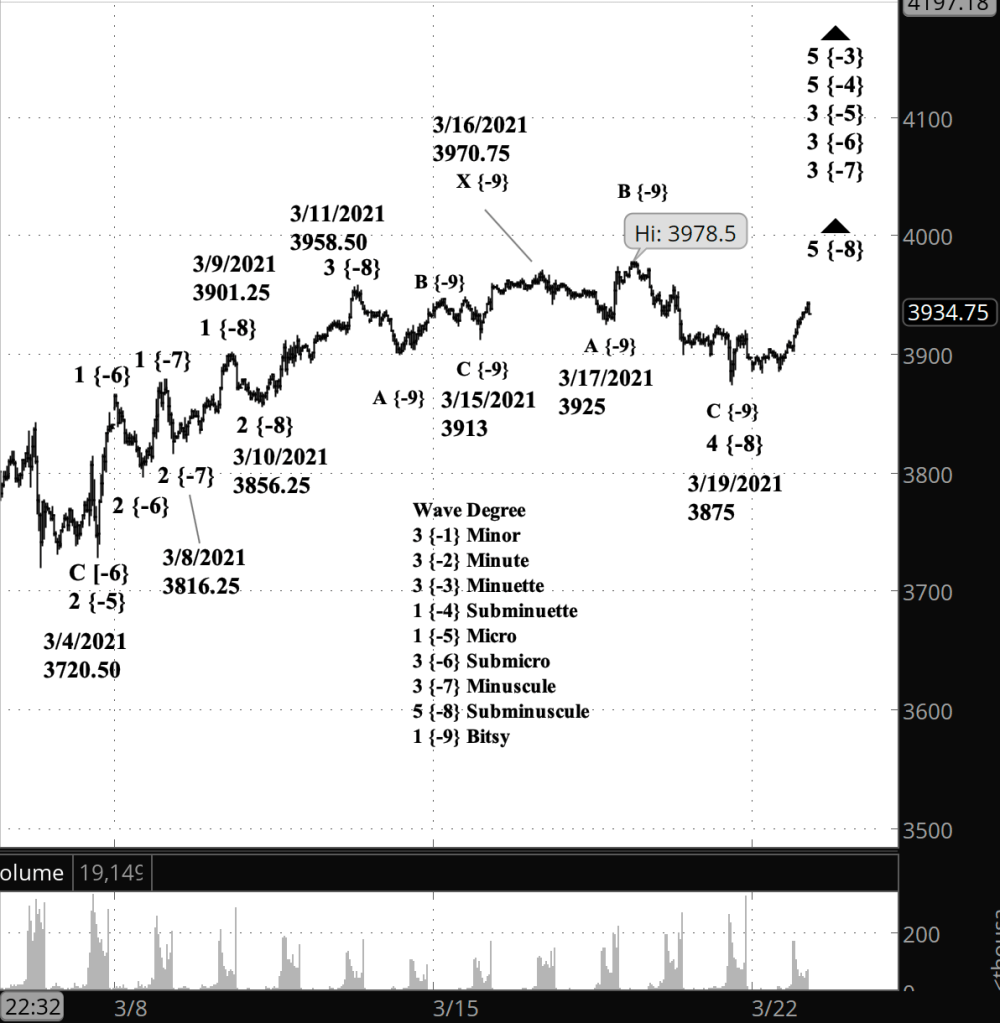
[S&P 500 E-mini futures at 3:30 p.m., 38-minute bars, with volume]
What does Elliott wave theory say? Under the principle analysis, the rising price is wave 5 of Subminuscule degree. The completion of Subminuscule wave 5 will also mark the end of its parent wave, Minuscule wave 3 and will be followed by a shallow correction.
Under the alternative, it’s an X wave connector of Bitsy degree, which will be followed by a Flat, a ZigZag or a Triangle formation to complete the parent wave 4 of Subminuscle degree.
Practically speaking, the difference between the two analyses is the degree of upward potential now rather than later.


You must be logged in to post a comment.