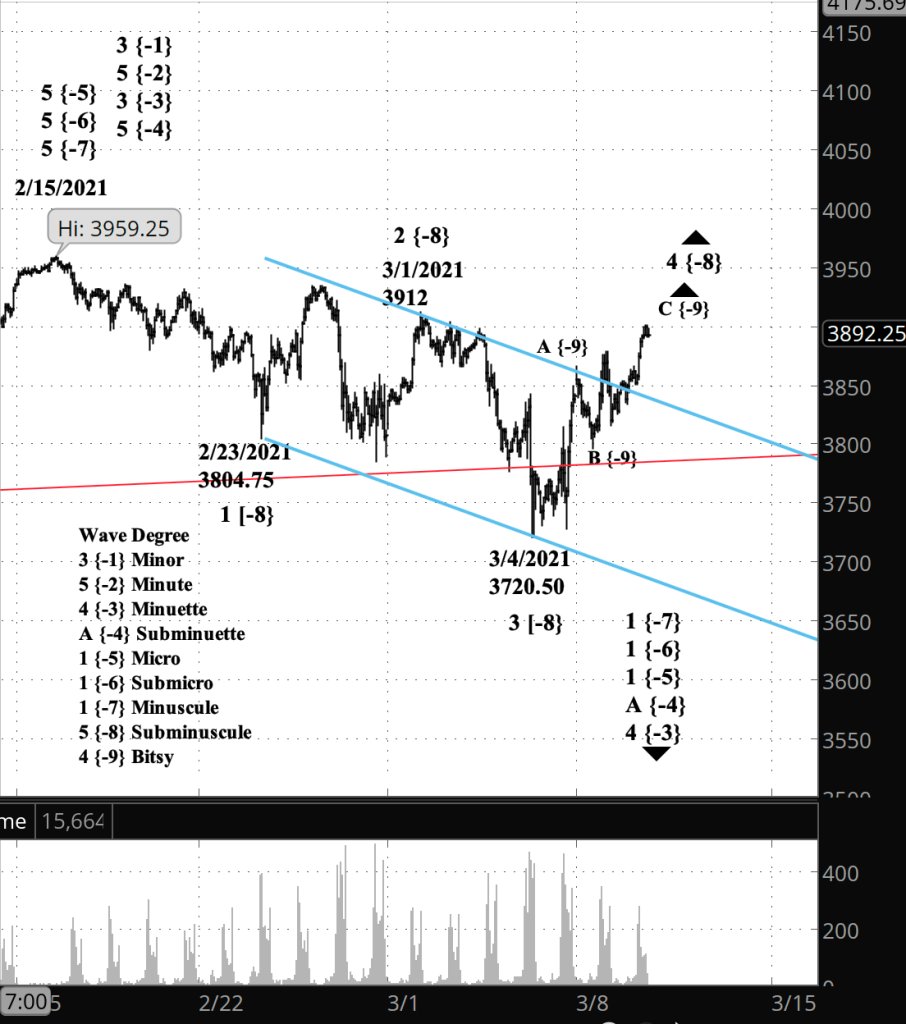
Friday, March 19, 2021

3:30 p.m. New York time

Half an hour before the closing bell. No change from the 2:10 p.m. analysis. I’ve updated the chart.

2:10 p.m. New York time

Two hours before the closing bell. The S&P 500 E-mini futures reversed at a low of 3875, which is 26.25 points below the end of wave 1 of Subminuscule degree, 3901.25, and moved back above that level. The S&P 500 index never fell below the end of Subminuscule 1. So this confirms my rounding-error theory for the futures, as discussed below the the Elliott wave theory section, and enables me to reanalyze the chart.
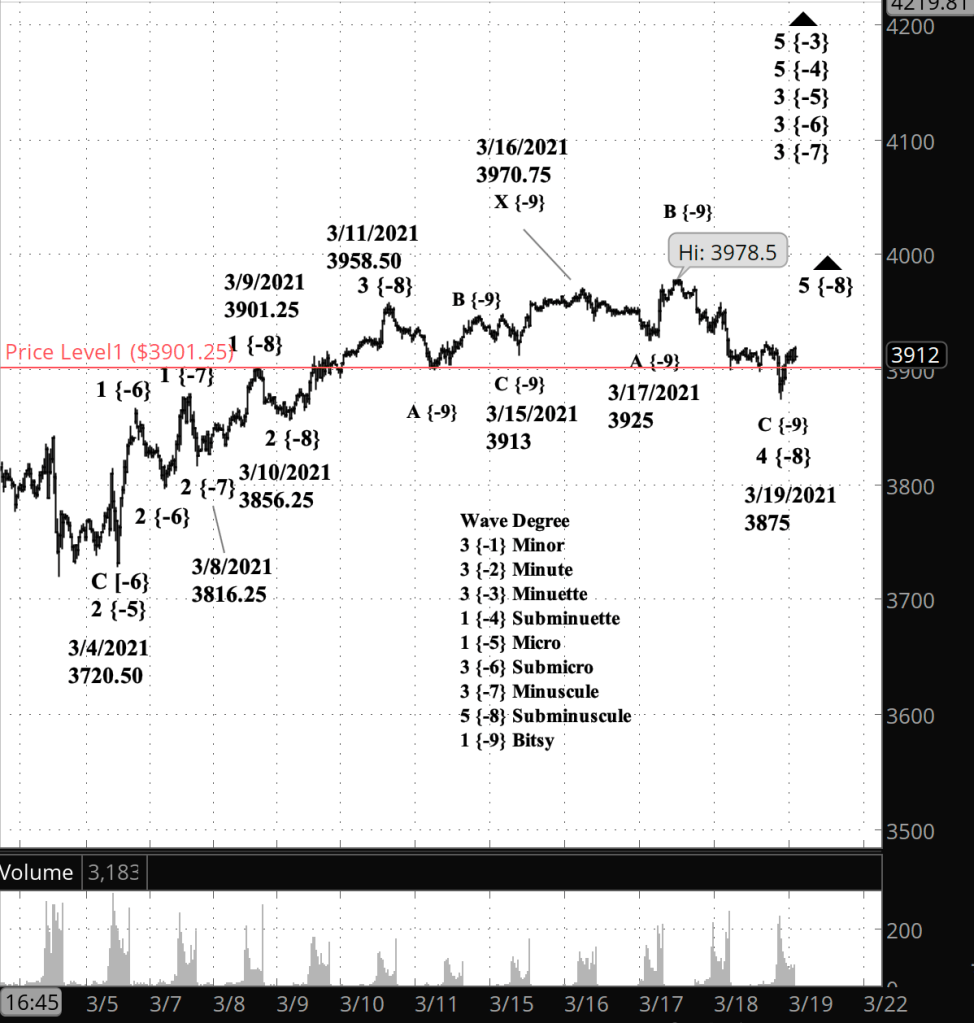
[S&P 500 E-mini futures at 3:30 p.m., 35-minute bars, with volume]

Under my principle analysis, wave 4 of Subminuscule degree ended today at 3875, and the reversal to the upside is wave 5 of Subminuscule degree. The rules of Elliott wave analysis impose no limits, beyond common sense, on the distance a 5th wave can travel. The end of Subminuscule 5 will also mark the end of the parent wave, 3 of Minuscule degree, which will trigger a correction of the rise from 3816.25, which began on March 8.

The alternate analysis designates the rise today as an additional separator, wave X of subminuscule degree, to be followed by another corrective pattern that will probably trend sideways. And a third possibility is that Wave C of Bitsy degree is still declining, although I consider this to be unlikely.

10:10 a.m. New York time

Update. The S&P 500 index 4th wave of Minuscule degree has not penetrated the end of the prior wave 1. The 1st wave ended at 3878.07 on the index, and the low so far of wave 4 is 3886.75. This lends weight to my rounding-error theory.

9:55 a.m. New York time

What’s happening now? The S&P 500 E-mini futures traded sideways overnight as the downward correction that began March 11 continues.

What does it mean? But there’s a potential problem with the count, one that I’m unable to resolve at present.

What’s the alternative? See the Elliott wave theory section below.
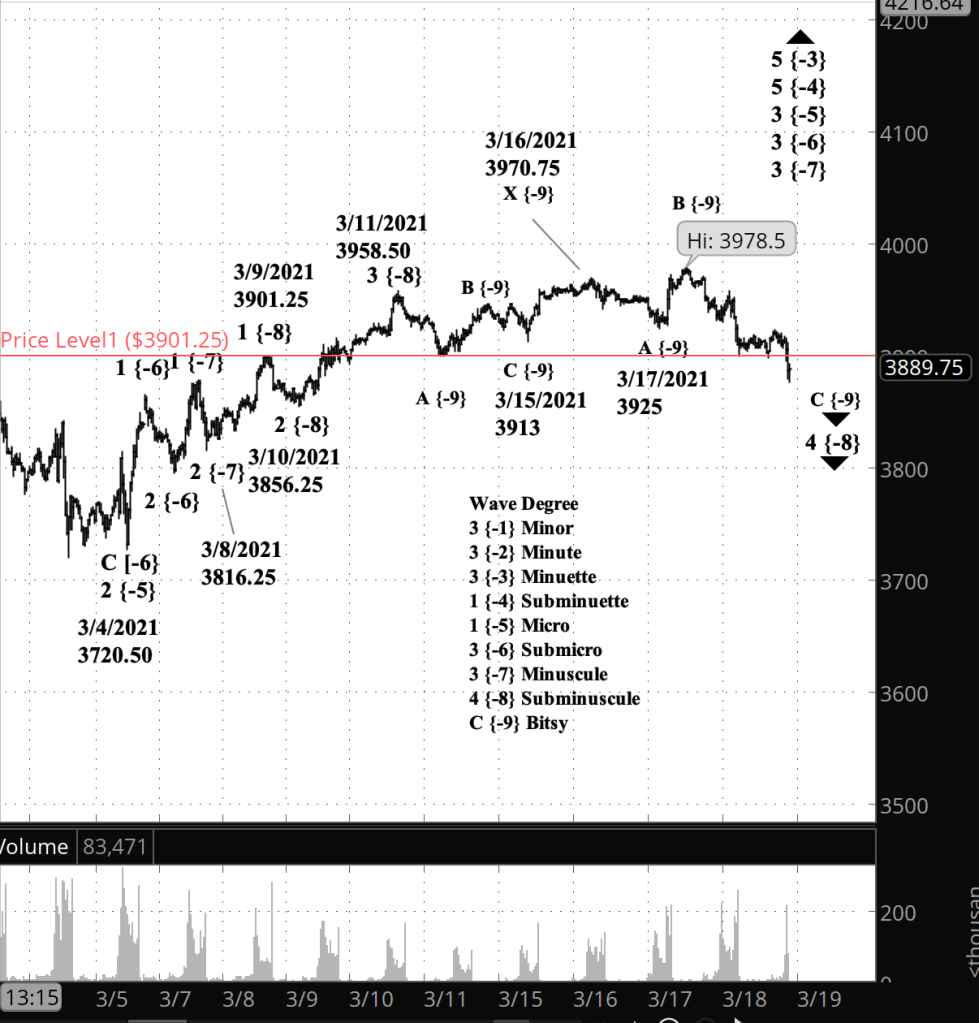
[S&P 500 E-mini futures at 9:54 a.m., 35-minute bars, with volume]

What does Elliott wave theory say? The problem is this. It’s a firm rule in Elliott wave analysis that a 4th wave cannot move beyond the end of the preceding 1st wave. I’ve counted the present decline as the 4th wave of Subminuscule degree. The 1st wave of Subminuscule degree ended at 3901.25 (the red horizontal line on the chart)_. The price has moved below that level in three 35-minute bars since yesterday, always briefly, as it quickly retreats to above the level. In the last hour as I write this the price has penetrated that level in two bars, the most recent reaching a low of 3877.25 (so far).

So what make of this? There are several possibilities, none of which I find especially compelling. The first is the granularity of futures pricing. The S&P 500 index is priced in cents, 1/100th of a dollar. The futures are priced in 25 cent increments, 1/4th of a dollar. The rule forbidding a 4th wave move beyond the end of wave 3 says “never”, but it was written for the index, before the futures had even been invented. So it could be that the moves below the line amount to a rounding error. After all, the largest push below that level has been 24 cents, and the rounding error will continue as low as 50 cents below the end of wave 1.

If we stick to “never means never”, then the alternative is the severely truncated 3rd wave model that I discussed in detail in yesterday’s analysis. In brief, I wrote that a short wave 3 ending at 3978.50 means that the future 5th wave must even shorter to avoid the 3rd wave being shorter than both waves 1 and 5. That’s another forbidden structure under the rules of Elliott wave analysis.

At this point I’m throwing up my hands and quietly sipping my Bancha green tea until the chart gains some clarity. As the Martian-raised Earthling Valentine Michael Smith put it in Robert Heinlein’s masterpiece Stranger in a Strange Land, “Waiting is.”

Read More »
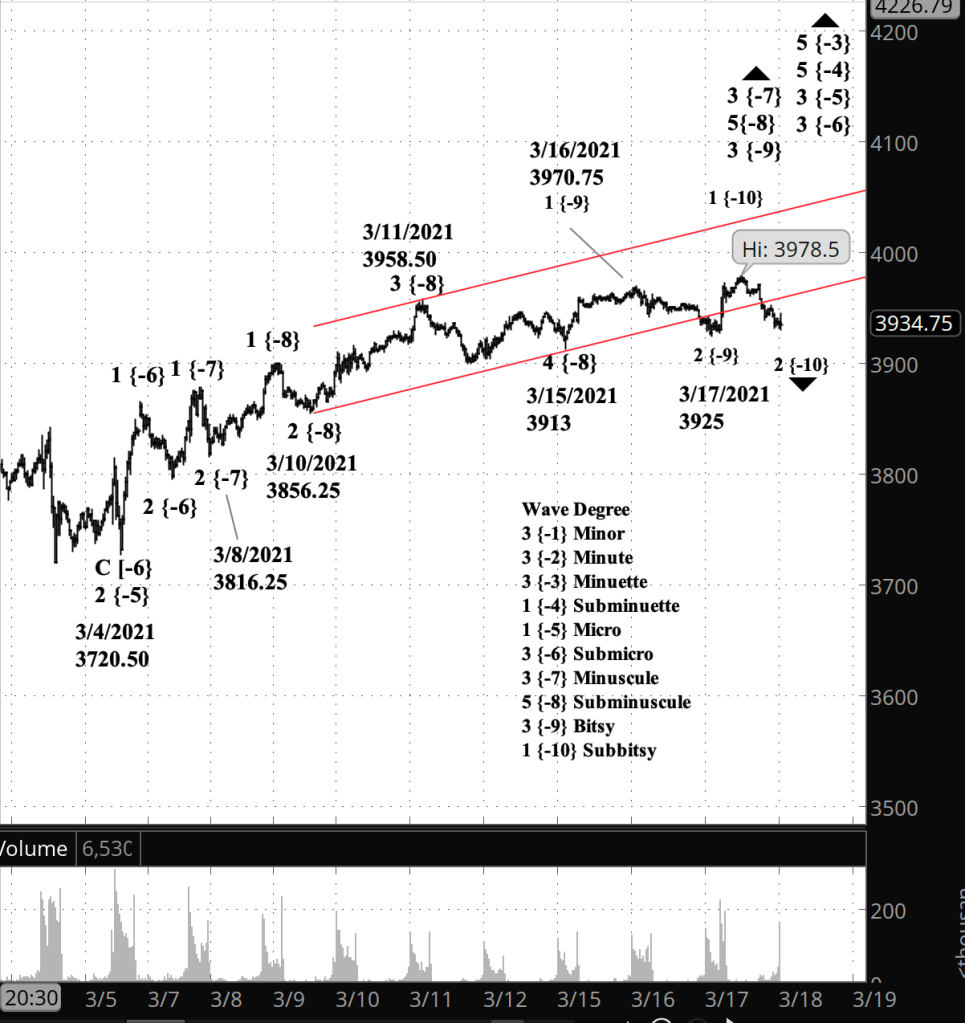
Thursday, March 18, 2021

3:30 p.m. New York time

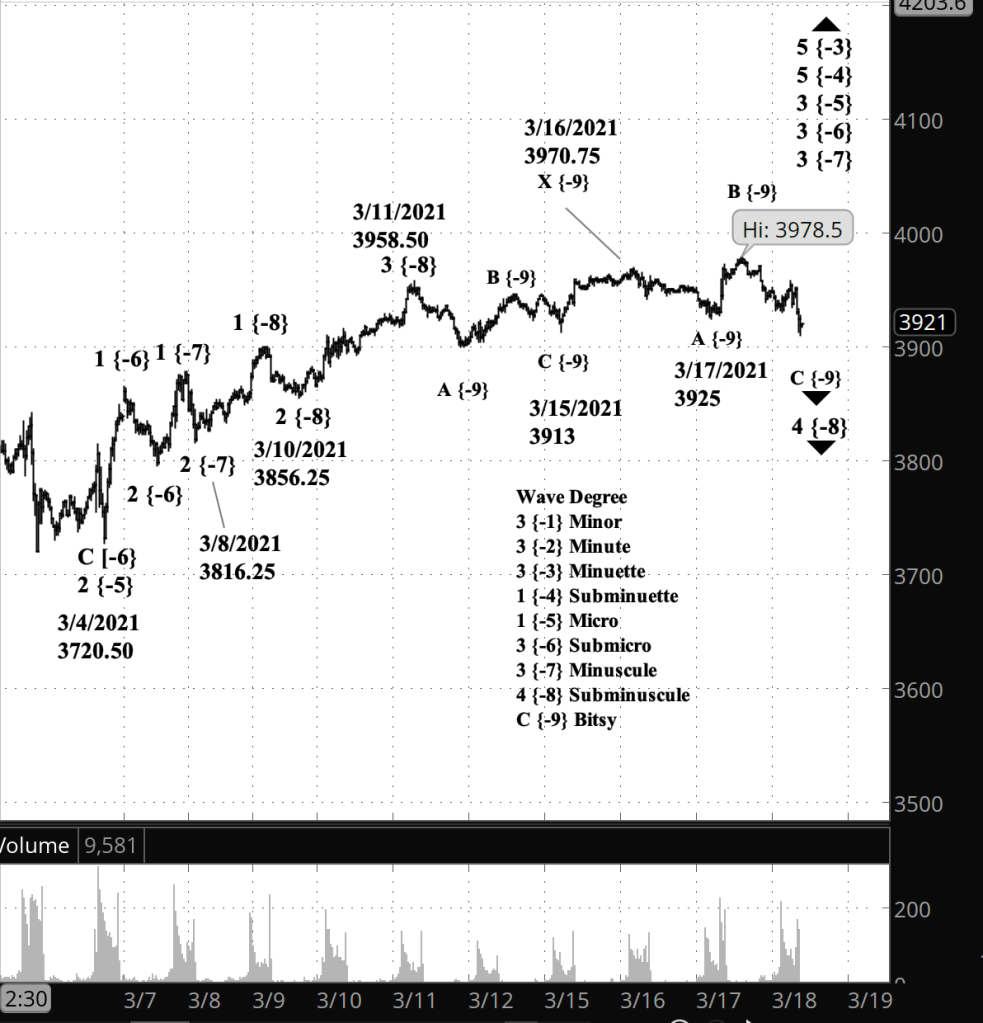
Half an hour before the closing bell. The S&P 500 fell below 3925, invaliding this morning’s count. My new principle analysis shows wave 4 of Subminuscule degree underway, having traced a compound pattern, the second of which, C of Bitsy degree, is still in progress. Here’s a chart of the new count, and I’ve left the chart of the old count from this morning for comparison, marking it as outdated.

[S&P 500 E-mini futures at 3:30 p.m., 30-minute bars, with volume]

9:55 a.m. New York time

What’s happening now? The S&P 500 E-mini futures fell to within seven points of yesterday’s low of 3925. A decline below 3925 would require a re-analysis of the rise that began on March 8.

What does it mean? By my principle analysis, yesterday’s rise is the beginning of the middle wave to the upside, often the most powerful wave in the direction of the trend.

What are the alternatives? It’s possible that correction beginning March 11 is still underway. It’s also possible that yesterday’s rise completed the middle wave to the upside. See a more detailed discussion in the Elliott wave section below.

[Outdated S&P 500 E-mini futures at 9:51 a.m., 30-minute bars, with volume]

What does Elliott wave theory say? By my principle analysis, yesterday’s rise, to a high of 3978.50, was wave 1 of Subbitsy degree, the initial leg of the parent wave 3 of Bitsy degree.

Yesterday’s rise can also be counted as the completion of wave 3 of the parent Bitsy degree. However, under this scenario, wave 3 is shorter than the preceding wave 1, and that would require that the future wave 5 be really short, since under Elliott’s rules wave 3 cannot be shorter than both wave 1 and wave 5. To my mind, that makes counting the rise as one degree lower, wave 1 of Subbitsy degree, a far more likely count.

The rise I called Subbitsy 1 could also be an X wave separating corrective patterns in an ongoing correction. Sometimes corrections extend by combining two or sometimes three corrective patterns, each pattern being separated from the one before by the X wave. If the rise from today’s decline remains below 3978.50, then the X-wave scenario becomes more likely.

Read More »

Wednesday, March 17, 2021

3:30 p.m. New York time

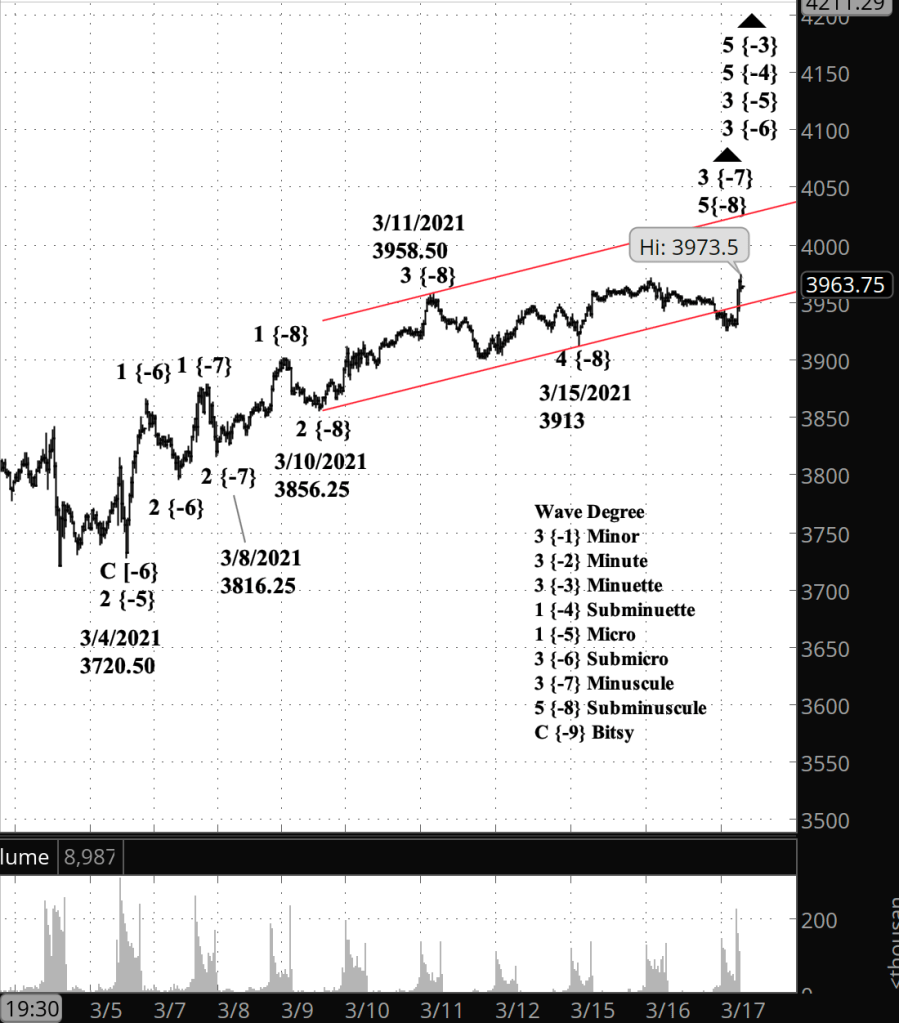
Half an hour before the closing bell. The S&P 500 rose concurrently with today’s announcement by the Federal Open Market Committee. In Elliott wave terms, the rise was a 3rd wave internal to wave 5 of Minuscule degree. Third waves tend to be energetic and are often the longest wave in the direction of a trend. It will be followed by a 4th wave correction and then a 5th wave push to the upside which will compute the parent wave, Minuscule 5. I’ve updated the chart below.

10:15 a.m. New York time

What’s happening now? The S&P 500 E-mini futures continue to work through a very low level correction within the final upward push of a slightly higher level. So far yesterday’s high of 3970.75 stands.

What does it mean? There’s more upside ahead. The rise from March 15 will be followed by by a correction of the rise that began on March 8, from 3816.25.

What are the alternatives? A decline below 3816.25 would mean something beyond a simple correction is going on.

[S&P 500 E-mini futures at 3:30 p.m., 30-minute bars, with volume]

What does Elliott wave theory say? The rise from March 15 is wave 5 of Subminuscule degree, and the parent is wave 3 of Minuscule degree which began on March 8. A trend channel for Minuscule degree shows Subminuscule wave 5 has the potential to reach into 4030s or higher, perhaps significantly higher if it extends, or perhaps somewhat lower it truncates.

Read More »

Tuesday, March 16, 2021

3:30 p.m. New York time

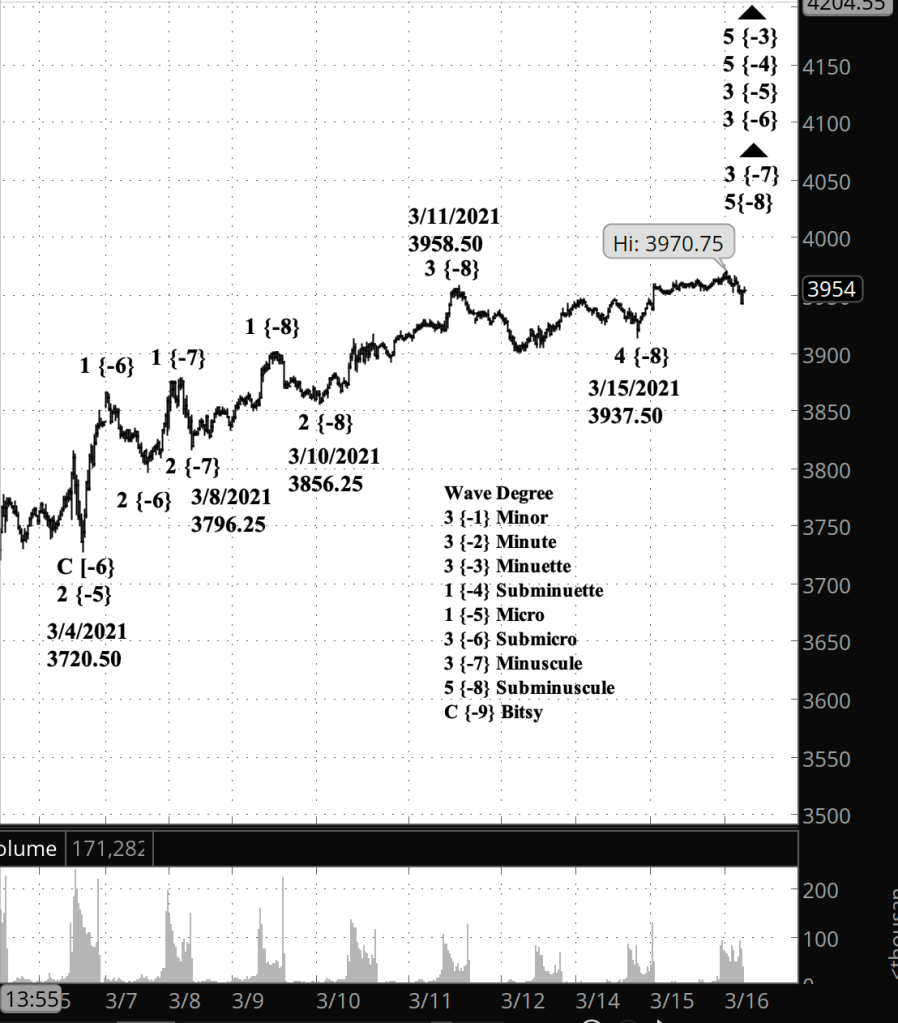
Half an hour before the closing bell. The S&P 500 rose to a high of 3970.75 on the futures, 3981.04 on the index, and then dropped off slightly as the price formed the internal structure of wave 5 of Subminuscule degree, which began yesterday. The end of Subminuscule 5 will mark the end of Minuscule 3, which will be followed by a shallow correction. I’ve updated the chart below.

9:40 a.m. New York time

What’s happening now? The S&P 500 E-mini futures reached 3966 in the uptrend that began March 10 from 3856.25.

What does it mean? Internally, the uptrend is in its final wave, which will be followed by a shallow correction. There’s no guidance on how far a final wave in a trend can go, so there’s no way of setting an upper price target.

I have no alternative analysis today.

[S&P 500 E-mini futures at 3:31 p.m., 25-minute bars, with volume]

What does Elliott wave theory say? The present rise is wave 5 of Subminuscule degree. Its completion will also mark the end of wave 3 of Minuscule degree, which began on March 10 from 3856.25. All of this is happening within wave 3 of Submicro degree, and up the ladder, wave 3 of Micro degree, wave 5 of Subminuette degree and wave 5 of Minuette degree. So at this point we’re tracking quite small degrees, where movements are a matter of days, not weeks, and certainly not the years and decades seen on a longer-term chart.

Read More »

Monday, March 15, 2021

4:10 p.m. New York time

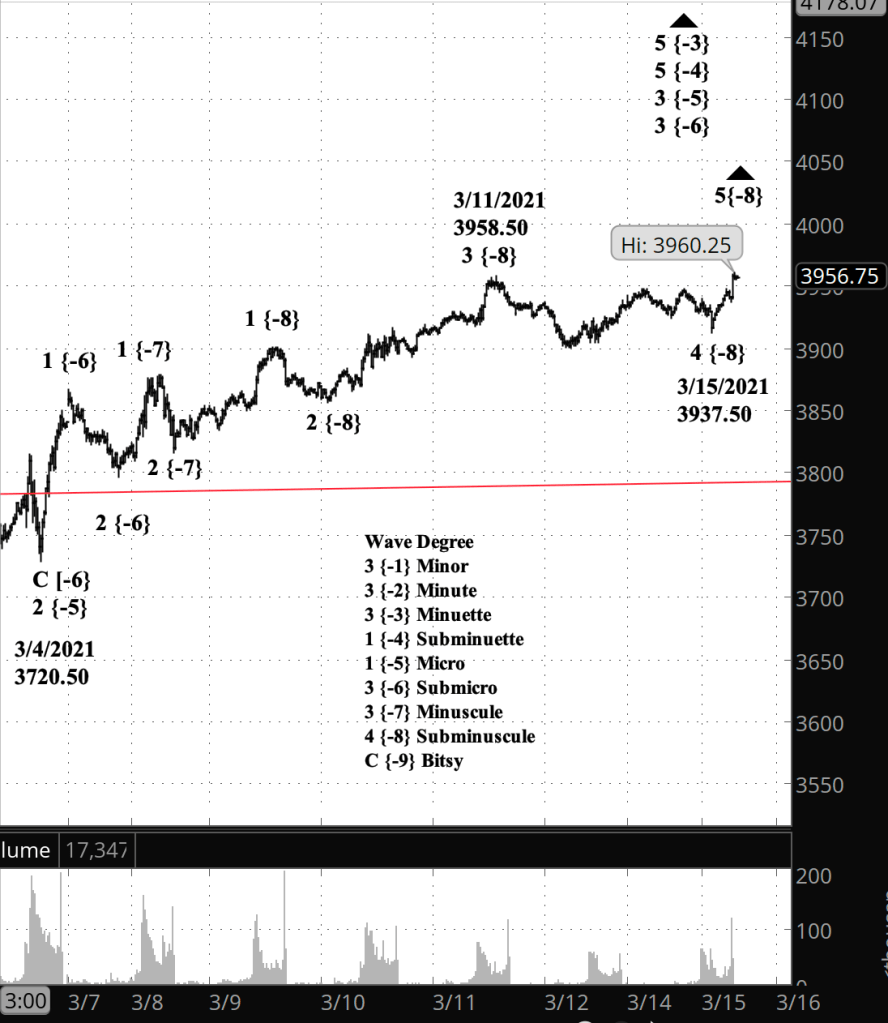
After the closing bell. The S&P 500 — index and futures — rose above the high of March 11, confirming my principle analysis that wave 5 of Subminuscule degree has begun. The 5th wave has so far reached 3960.25 on the futures and 3970.08 on the index. In the futures chart below I’ve updated the wave numbering to reflect the resumption of the upward trend post-correction.

[S&P 500 E-mini futures at 4:06 p.m., 20-minute bars, with volume]

3:30 p.m. New York time

Half an hour before the closing bell. The S&P 500’s shallow correction continues. Looking ahead, I expect another slight decline to wrap up wave C of Bitsy degree, and then, under the principle analysis, a rise above the March 11 high of 3958.50 (the end of Subminuscule wave 3), or under the alternative analysis, a separator X wave up into the 3940s, followed by another corrective pattern. I’ve updated the chart.

9:50 a.m. New York time

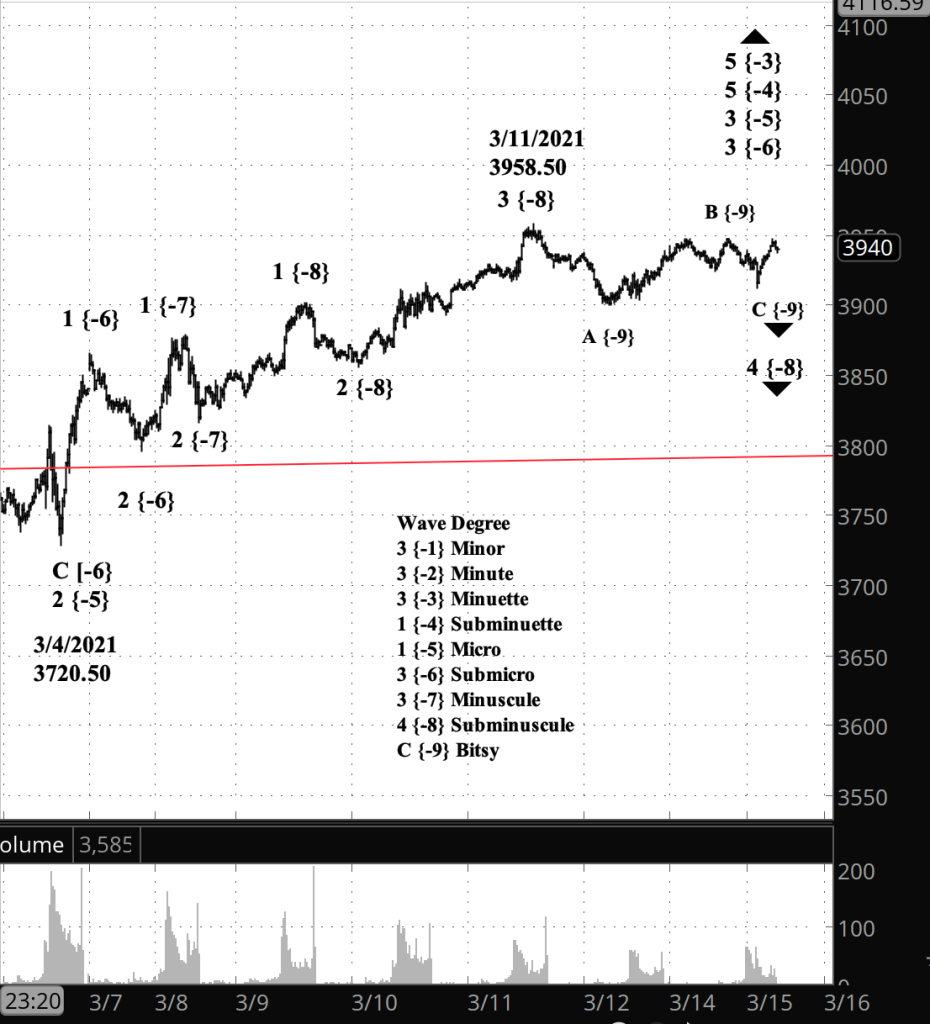
What’s happening now? The S&P 500 E-mini futures have continued their shallow downward correction since trading resumed Sunday evening and have entered the third leg of a three-wave pattern.

What does it mean? The end of the third wave often marks the end of the correction and the resumption of a rise to new highs.

What are the alternatives? Corrections sometimes have more than one three-wave corrective pattern, a compound structure. If that’s the case with this correction, expect the end of the final wave to be followed by a rising separator wave, followed by a second corrective pattern.

[S&P 500 E-mini futures at 3:30 p.m., 20-minute bars, with volume.]

What does Elliott wave theory say? The correction is wave 4 of Subminuscule degree within — several degrees higher — wave 3 of Micro degree. Within Subminuscule 4, the price has entered wave C of Bitsy degree. Under my principle analysis, the end of Bitsy wave C will also be the end of the Subminuscule 4 correction and will be followed by the rising wave 5 of Subminuscule degree. If the correction turns out to be a compound structure, the rising separator will be an X wave of Bitsy degree.

Read More »

Friday, March 12, 2021

3:30 p.m. New York time

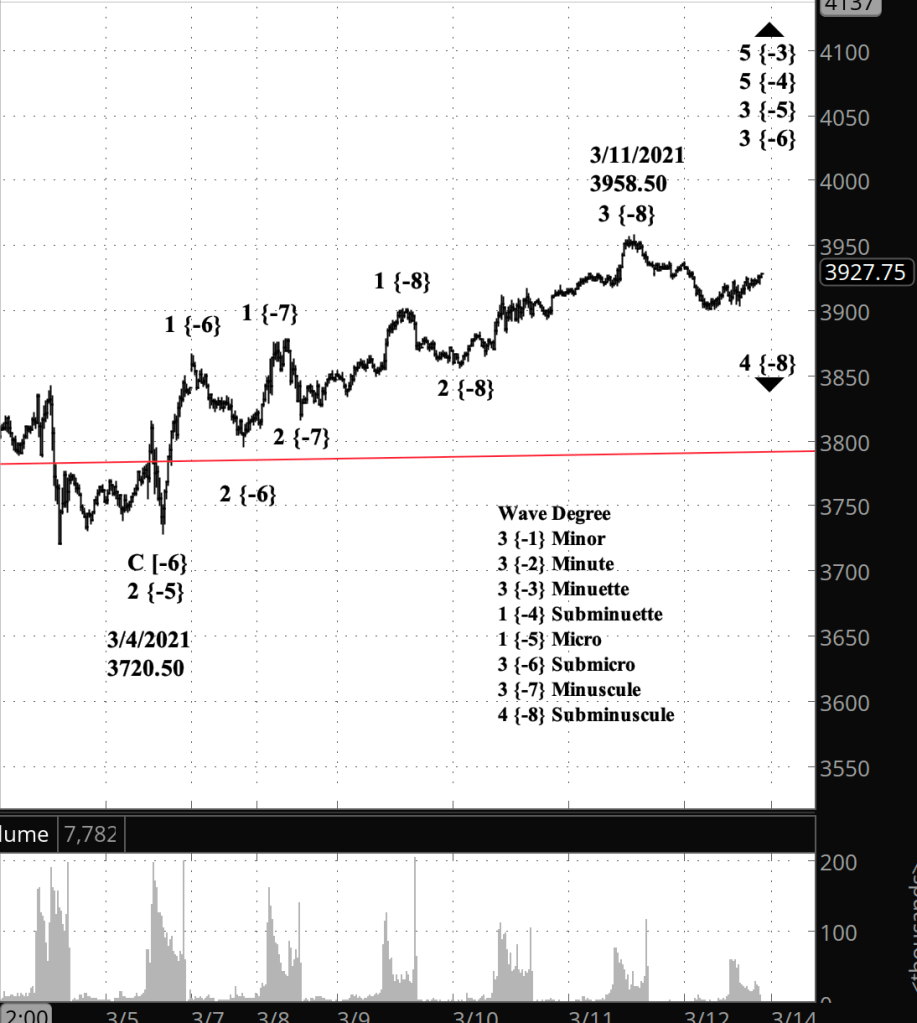
Half an hour before the closing bell. The S&P 500 E-mini futures completed the first very small scale downward movement (an A wave) in a correction that began March 11, and then rose very slightly (a B wave) in a shallow upward movement. The structure is within the 4th wave of Subminuscule degree, which appears to be shaping up as a shallow Flat pattern. I’ve updated the short-term chart, the first of the two charts below.

10:10 a.m. New York time

What’s happening now? The S&P 500 E-mini futures continued to move sideways in overnight trading as it went through a small correction within the rise since March 4.

What does it mean? The correction will be followed in short order by a further rise will almost certainly penetrate yesterday’s high of 3958.50. The completion of that further rise will trigger a correction of a larger degree, which will be followed by another upward move.

What are the alternatives? The rise could fall short of that prior high and still be within the rules of Elliott wave analysis, in condition called a “truncation”.

[S&P 500 E-mini futures at 3:30 p.m., 20-minute bars, with volume]
[S&P 500 index at 10:06 a.m., 2-day bars]

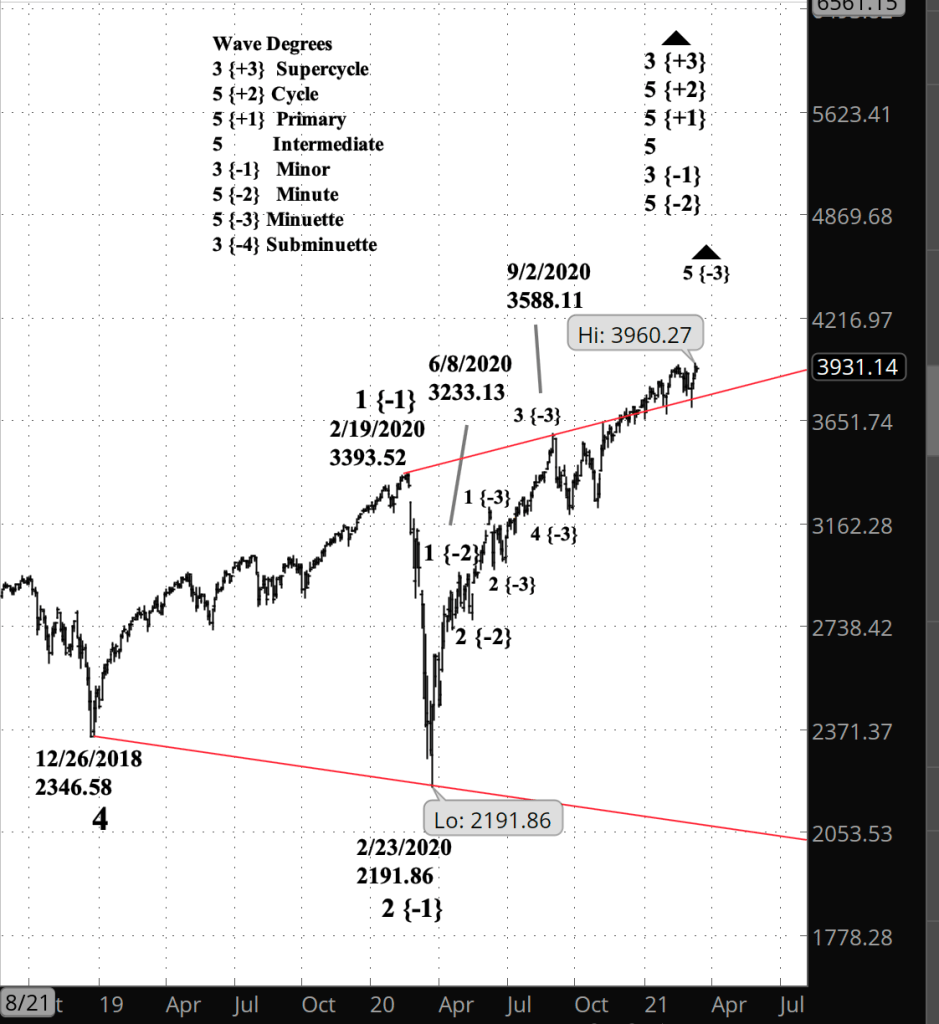
What does Elliott wave theory say? Yesterday’s breakout signaled that the Minor wave uptrend that began February 23, 2020 is still underway.

The short-term upper chart shows a typical motive wave in the direction of the main trend, with the usual waves within waves pattern that characterize the markets. The small, sideways correction is wave 4 of Subminuscule degree within a series of uptrending wave, from Minuscule up to Supercycle, which covers quite a bit territory. The Minuscule wave began on March 8, four days ago. The Supercycle wave began on October 5, 1929.

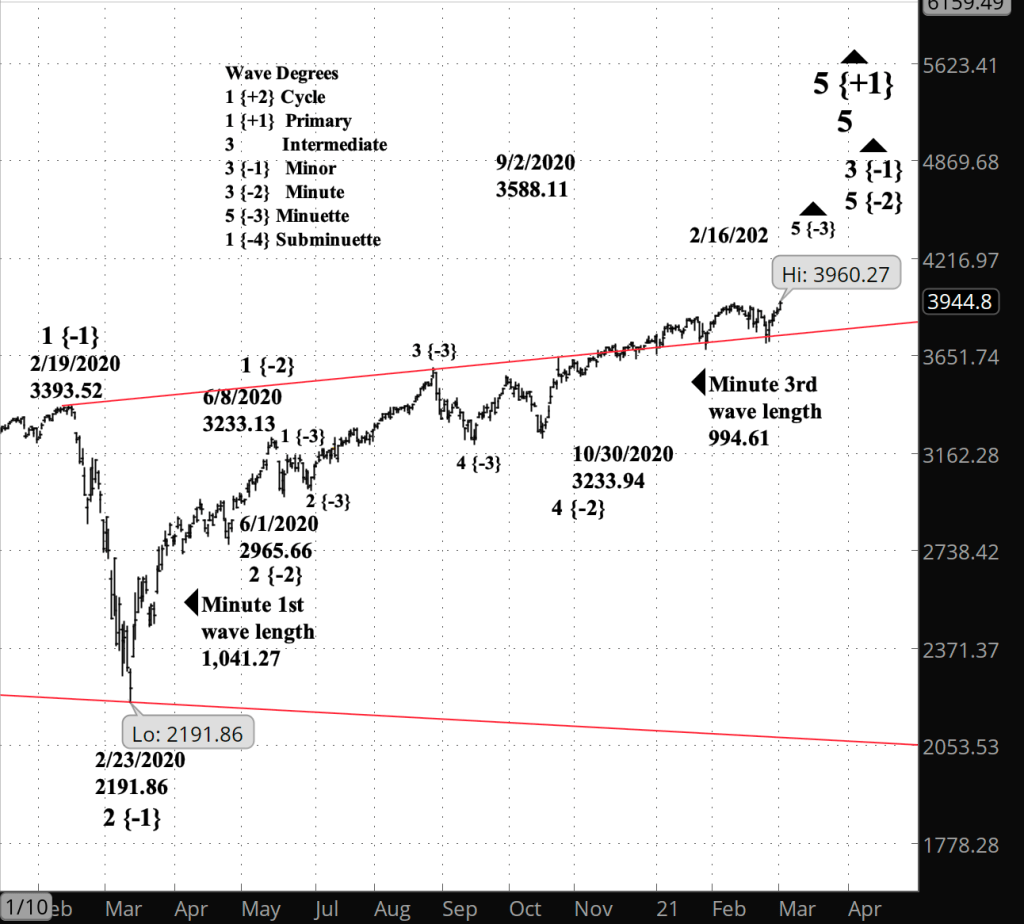
To summarize the big picture on the lower chart, the rise that began on February 23, 2020 from 2346.58 is Minor wave 3. Within it, working from smaller to larger, the S&P 500 index is moving through Minuette wave 5 of Minute wave 5. Minor wave 3 is part of Intermediate wave 5 within Primary wave 1 within Cycle wave 1.

So what does all of that mean for the Expanding Diagonal Triangle that began on December 26, 2018, the red lines on the long-term chart that a reader of Private Trader has aptly described as a megaphone? And the answer is, no impact. The price broke above the upper boundary of the triangle last December and has continued to bounce along the line ever since. The bouncing will end with the completion of wave 3 of Minor degree. The next movement will be wave 4, which by the rules of Elliott wave analysis will eventually reach the lower boundary, presently around 2080 but sinking further each day. If wave 4 instead proves to be a shallow correction, then the analysis that resulted in the Diagonal Triangle will need to be revised.

After Minor wave 4 is complete, if the triangle remains intact, then the next move will Minor wave 5, which will return to the upper boundary, presently in the 3390s but rising each day. Completion of the 5th wave of Minor degree will mark the end of the Diagonal Triangle and the end of the parent wave, Primary wave 5, and moving the ladder of degrees, also the completion of Cycle wave 5 within Supercycle wave 3.

For perspective: Cycle wave 5 began on December 9, 1974 from a price of 570. (Three figures — 570 — is correct, not a typo.) So given that high degree, the decline that follows the end of Cycle wave 5 will be with us, almost certainly, for decades, and given the fractal nature of the Elliott waves that we use to describe the market, will provide plenty of opportunity for both bull and bear trades.

Read More »

Thursday, March 11, 2021

3:05 p.m. New York time

A new analysis. Although the S&P 500 index has broken above its February 15 high, showing that the year-long uptrend is continuing, the S&P 500 futures remain below that high, creating a discrepancies. Both the index and the futures are derivatives of a collection of corporate equities. The index is derived from the price of the stocks, and the futures are derived from the index.

For the following Elliott wave analysis I’ve taken the index as definitive, assuming that the futures will follow, since the index is one step closer to the stocks from which both products are derived.

Note that wave 3 of Minute degree, which began on June 1, 2020, is shorter than the preceding 1st wave. That means that either Minute wave 3 will continue to rise until it’s longer than Minute 1, or if wave 3 comes up short, then the future wave 5 of Minute degree can be no longer than Minute 1.

First, the big picture. The rise since March 4 is wave of Minuette degree within wave 5 of Minute degree within wave 3 of Minor degree. The Minor 3rd wave began on February 23, 2020 and so far has reached a peak on the index of 3960.27.

[S&P 500 index at 3 p.m., daily bars]

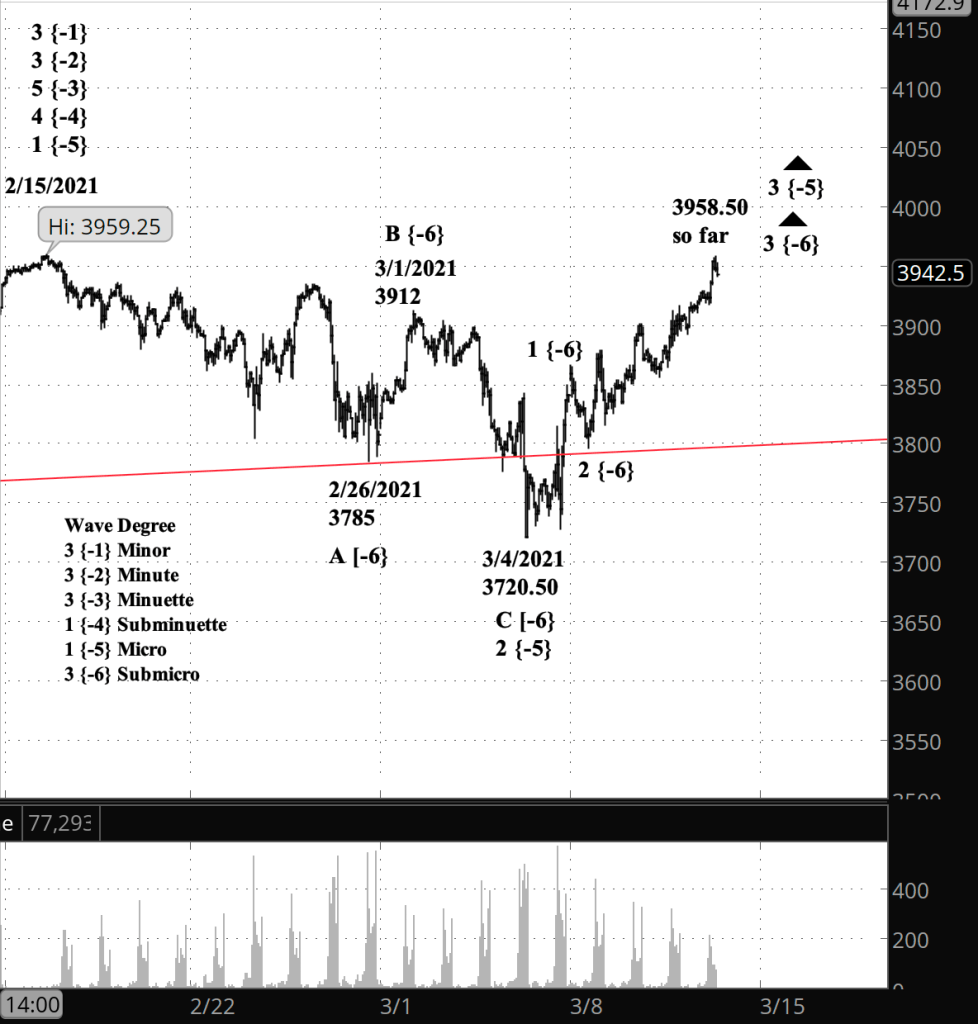
Second, the smaller picture. The wave 2 correction of Micro degree began on March 4 from 3720.50 on the futures and has so far reached a high of 3958.50, still below the end of wave 1 on February 15, at 3959.25. The subsequent rise is wave 3 of Micro degree, and within it, wave 3 of Submicro degree.

[S&P 500 futures at 3:01 p.m., 65 minute bars, with volume]

I’ve left this morning’s chart below, with its now invalidated analysis, unchanged so it can be used for comparison.

2 p.m. New York time

Break-out. The S&P 500 index has risen above its high of February 15, invalidating Elliott wave analysis that saw the subsequent decline as the beginning of a downtrend. The rise from February 23, 2020, beginning from 2191.86, is still underway. The February 15 high on the index was 3950.43. The highest point in today’s index is 3960.27. The S&P 500 futures remain below their February 15 high, which was 3959.25. The highest point in today’s futures trading is 3958.50.

9:35 a.m. New York time

What’s happening now? The S&P 500 E-mini futures continued their relentless rise in the low-level upward correction that began on March 4, reaching a high of 3925 in overnight trading.

What does it mean? If the price reverses to the downside before reaching 3959.25, then the downward movement that began on February 15 from that level will resume, falling below 3720.50, perhaps significantly so.

What are the alternatives? If the price exceeds 3959.25, then the upward movement did not end on February 15 but is still underway, and we can expect a series of higher highs.

[Outdated analysis: S&P 500 E-mini futures at 9:34 a.m., 65-minute bars, with volume]

What does Elliott wave theory say? The upward correction under the principle analysis is wave 4 of Subminuscule degree, and within it, wave C of Bitsy degree is in its 4th day. Big picture: The February 15 peak marked the end of the 5th wave all the way up to Subminuette degree and the beginning of a major decline reaching all the way up to Minor degree.

However, if the alternate count proves to be valid, then the February peak marks the end of wave 3 of Subminuette degree, and the subsequent decline is a wave 4 correction at the Subminuette level.

As is always the case with Elliott wave analysis, and indeed, with life, nothing is ever certain.

Read More »

Wednesday, March 10, 2021

3:30 p.m. New York time

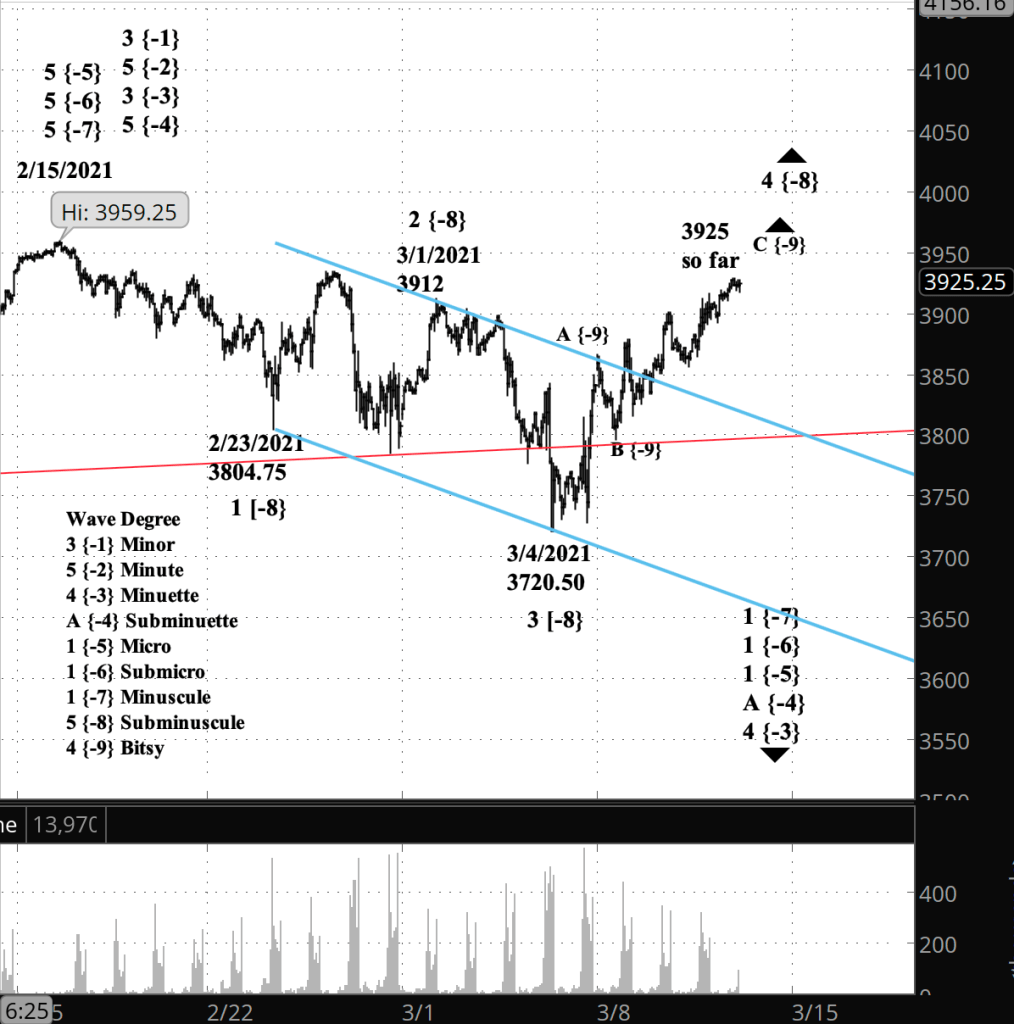
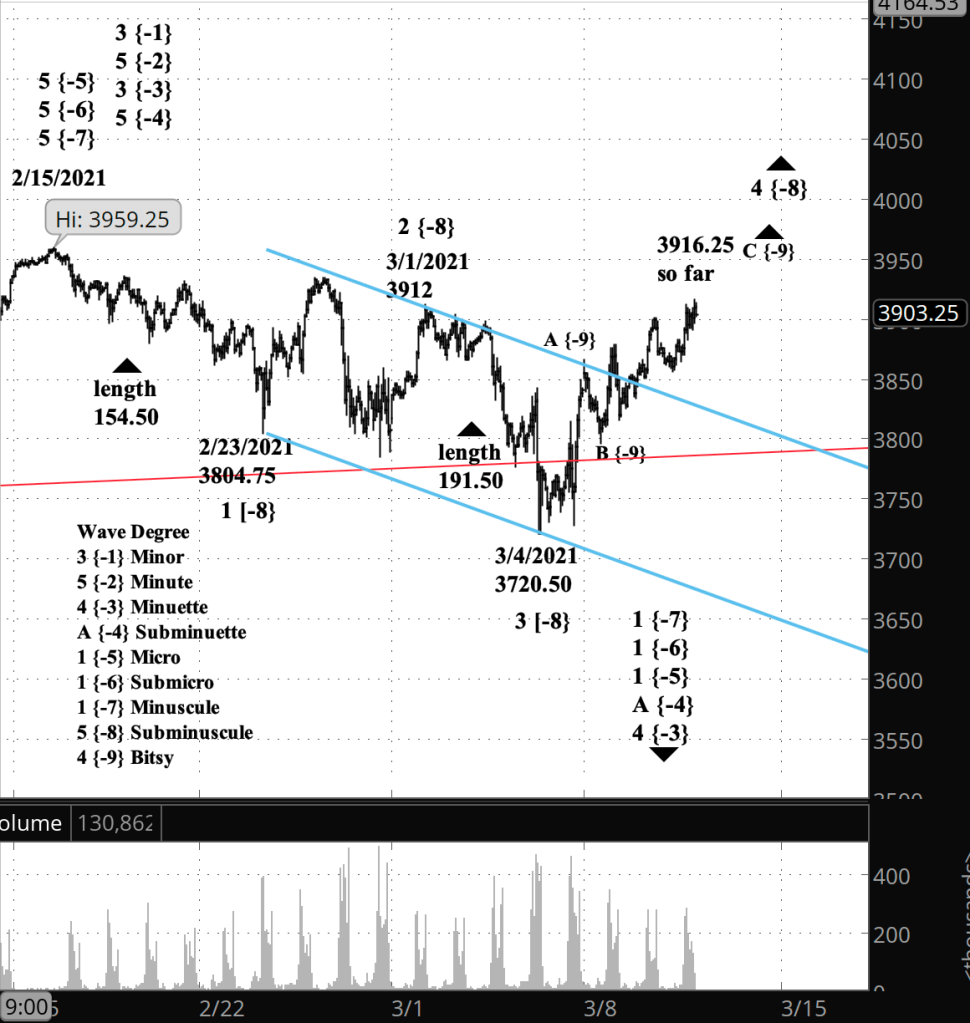
Half an hour before the closing bell. The S&P 500 continued its rise, reaching a high of 3916.25 so far. That level is below the starting point of the downtrend, 3959.25. I’ve updated the chart below.

10:50 a.m. New York time

What’s happening now? The S&P 500 E-mini futures continued to rise in the final leg of an upward correction, reaching a high so far today of 3911.50, which is 47.75 points below the starting point of a downtrend on February 15.

What does it mean? The completion of the upward correction will be followed by an energetic resumption of the downtrend.

What are the alternatives? If the price moves above 3959.25, the beginning the downtrend, then the principle analysis is invalid and must be redone to account for a continuation of the uptrend that began in February

[S&P 500 E-mini futures at 3:30 p.m., hourly bars, with volume]

What does Elliott wave theory say? If the price rises another 48 points, then the 4th wave of Subminuscule degree will exceed the beginning of wave 1 of Subminiscule degree. This isn’t allowed in Elliott wave theory. Should it happen, then all of the drama since the February 15 peak has been a downward correction within an uptrending 5th wave in the rise since February 23 of last year. I count that year-long rise as having completed it’s 5th wave of Minor degree. However, all that has happened since the February 15 peak last month has been movements of small degree, seven and eight levels below Minor degree.

The 3rd wave of Subminuscule degree is longer than the 1st wave, so there’s no danger that this structure will violate the Elliott wave analysis rule that says the 3rd wave cannot be the shortest wave in the direction of the trend.

Elliott wave analysis doesn’t produce predictions. It’s not a crystal ball. Instead, it provides a language for describing the state of the chart at any given moment. So we must wait and see whether that February 15 peak stands or is exceeded.

Read More »

NIO Trade

Nio Ltd. (NIO)

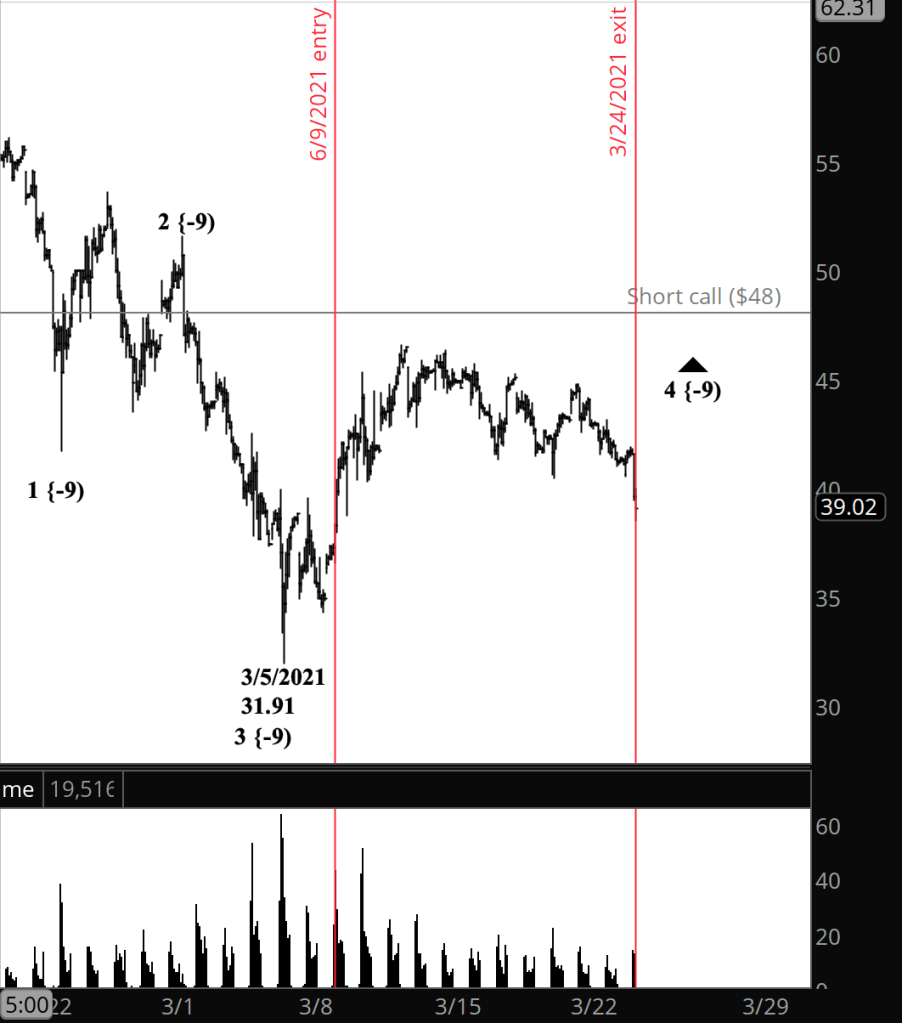
Update 3/24/2021: I exited my short iron condor options position on NIO 23 days before expiration, for a $0.55 debit per contract/share, a profit before fees of $1.10 per contract/share. Shares were trading at $40.38, down $1.44 from the entry level.

I ended the position according to my rule requiring exit when the price reaches 50% of maximum potential profit.

Shares rose by 3.7% over 15 days for a 90% annual rate. The options position produced a 100% return for a 2,433% annual rate.

[NIO, hourly bars, with volume]

NIO rose in the first five days that I held the position and trended sideways thereafter. The rise remained below the $48 strike price of the short call, keeping the position in its profit zone throughout the holding period. My entry point was early in wave 4, and the price behavior was typical of 4th wave corrections — shallow and lacking drama.


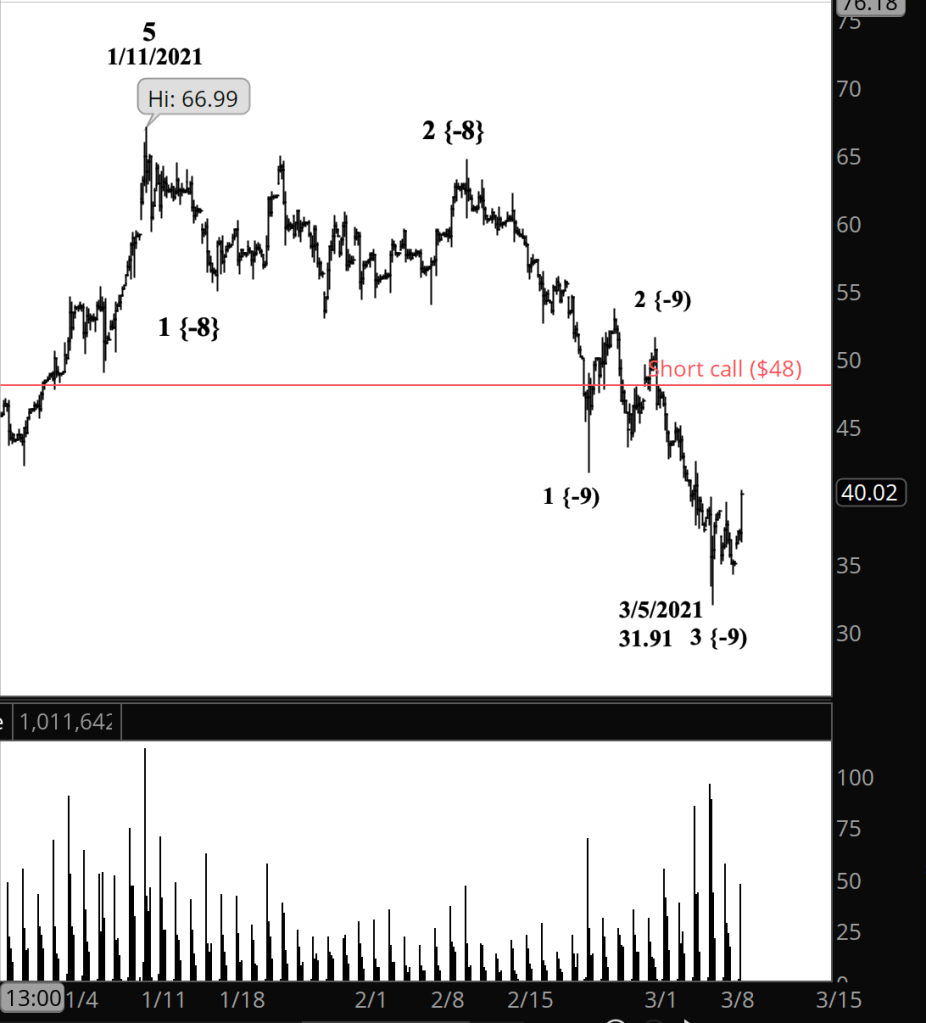
I have entered a short iron condor spread on NIO, using options that trade for the last time 38 days hence, on April 16. The premium is a $1.10 credit per contract share and the stock at the time of entry was priced at $38.94.

The implied volatility rank (IVR) stands at 42.3.

Premium: $1.10 Expire OTM  
NIO-iron condor Strike Odds Delta
Long 55.00 90.0% 18
Break-even 49.10 85.5% 23.5
Short 48.00 81.0% 29
Puts      
Short 23.00 85.0% 8
Break-even 21.10 87.0% 6.5
Long 20.00 89.0% 5

The risk/reward ratio is 3.5:1, with maximum risk of $390 and maximum reward of $110 per contract.The premium is 22% of the width of the position’s wings.
The profit zone covers a 38% move to the upside and a 68% move to the downside, for total range of 106%.

I skewed the entry to the downside based on Elliott wave analysis showing that wave 3 of Bitsy degree appears to have ended four days ago, and that wave 4, likely a shallow correction, is now underway.


[NIO at 10:29 a.m., 2-hour bars, with volume]

The trade was made in a period of low implied volatility. Among equities that meet my liquidity requirements, no ETFs were above my 30% threshold, and the only stocks that passed the test were Chinese companies, which carry additional risk in the form of currency fluctuation and regulatory surprises. Nonetheless, it’s a short-term trade, and that works in my favor, so I decided the risks were acceptable.

By Tim Bovee, Portland, Oregon, March 9, 2021

Read More »

Tuesday, March 9, 2021

3:30 p.m. New York time

Half an hour before the closing bell. The S&P 500 continued to rise during the trading session, reaching a high on the futures of 3901.25 with half an hour to go. The price has moved above yesterday’s high, and so the alternative analysis prevails and the correction, presently wave C of Bitsy degree within wave 4 of Subminuscule degree, is still underway. I’ve updated the chart.

10:40 a.m. New York time

Trade updated. I’ve updated the NIO analysis with a chart and a discussion of decision to enter the trade.

10:30 a.m. New York time

Trade posted. I’ve entered a short iron condor options spread on NIO and have posted the analysis.

9:50 a.m. New York time

What’s happening now? The S&P 500 E-mini futures, having fallen yesterday below the upper boundary of the channel, reversed overnight and recrossed to above the trend, although remaining below yesterday’s high of 3878.75.

What does it mean? Yesterday’s high marks the end of the low-degree upward correction that began on March 4 from 3720.50. A move below the end of the last downtrending wave, 3720.50, confirms the analysis. The downtrending wave may move below 3700, perhaps significantly so.

What are the alternatives? If the price moves above yesterday’s high, 3878.75, then the primary analysis is invalidated and the upward correction is still underway. The decline and rise from yesterday could be a continuation of the final wave of the corrective pattern, a Flat, or a separator wave between two corrective patterns, a compound structure.

[S&P 500 E-mini futures at 3:30 p.m. hourly bars, with volume]

What does Elliott wave theory say? By the primary count, yesterday’s high was the completion of wave 4 of Subminuscule degree. The decline that followed was wave 1 of Bitsy degree within downtrending wave 5 of Subminuscule degree, and the rise is wave 2, an upward correction of Bitsy degree. By the alternative count, yesterday’s high was either wave 2 within wave C of Bitsy degree, or an X wave separating two patterns in a compound structure.

My trades. Yesterday I attempted to enter a short iron condor position on NIO, and couldn’t get a fill at a price I liked. I’m trying again today.

Read More »