Monday, March 8, 2021

3:30 p.m. New York time

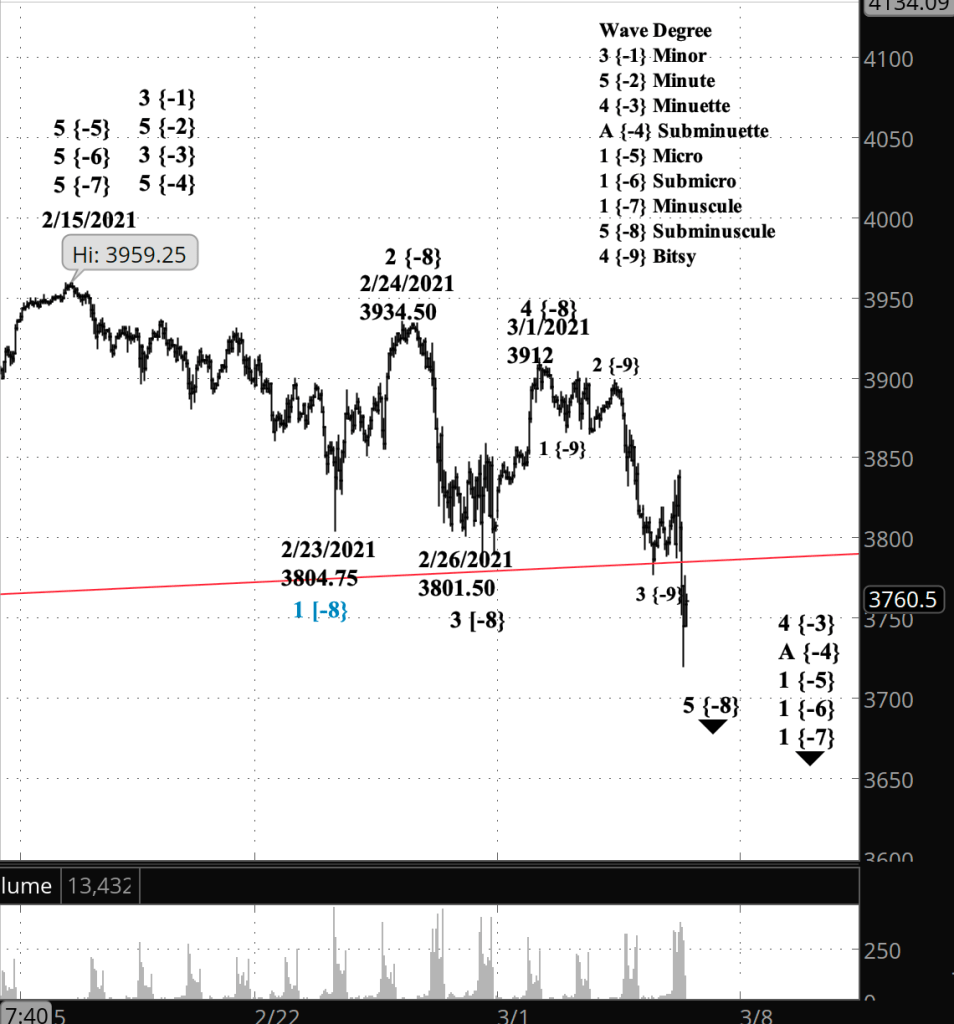
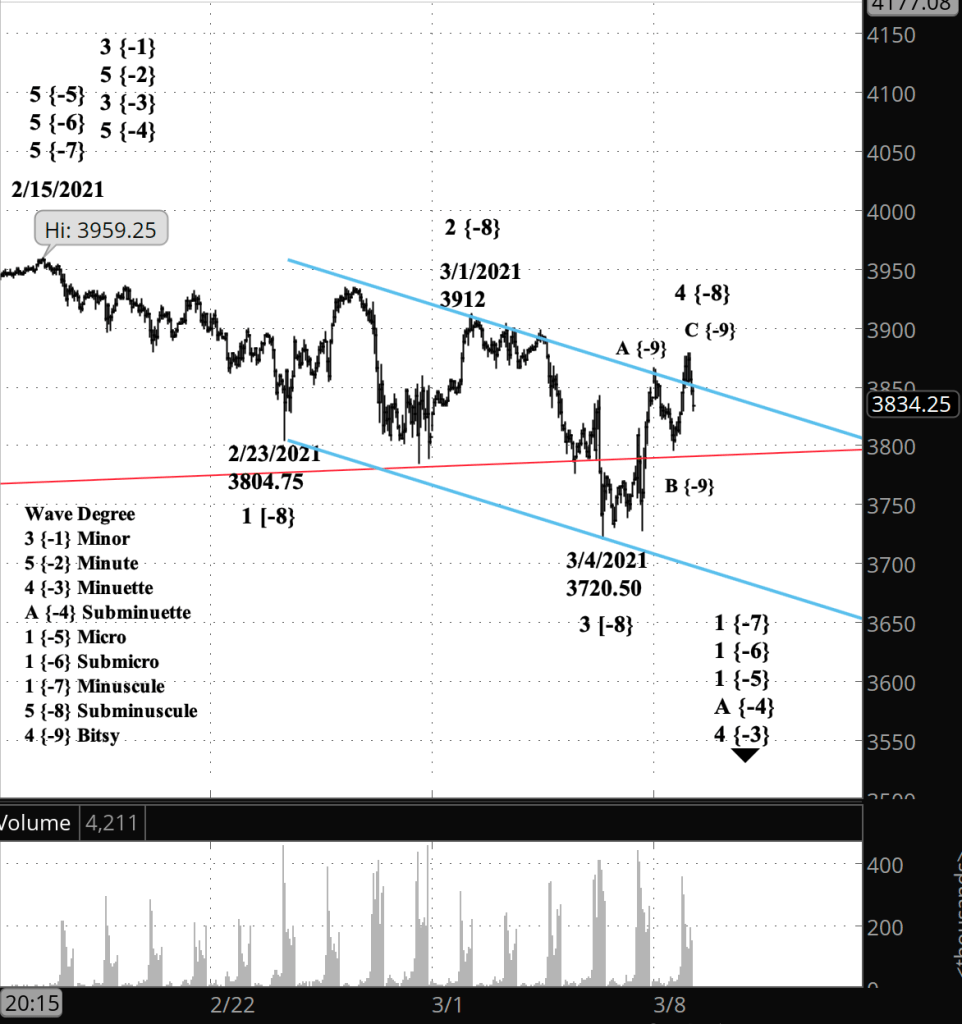
Half an hour before the closing bell. The S&P 500s moved past the upper boundary of a channel for the Subminuscule degree (blue line) and then dropped back into the channel, perhaps signaling, although not for a certainty, an end to the final wave of the upward correction. If that is indeed a valid signal, then the Subminuscule 5th wave has begun, with a target somewhere below 3720.50 on the futures. I’ve updated the chart below. The price remains above the upper boundary of the Diagonal Triangle that began in December 2018 (red line).

9:50 a.m. New York time

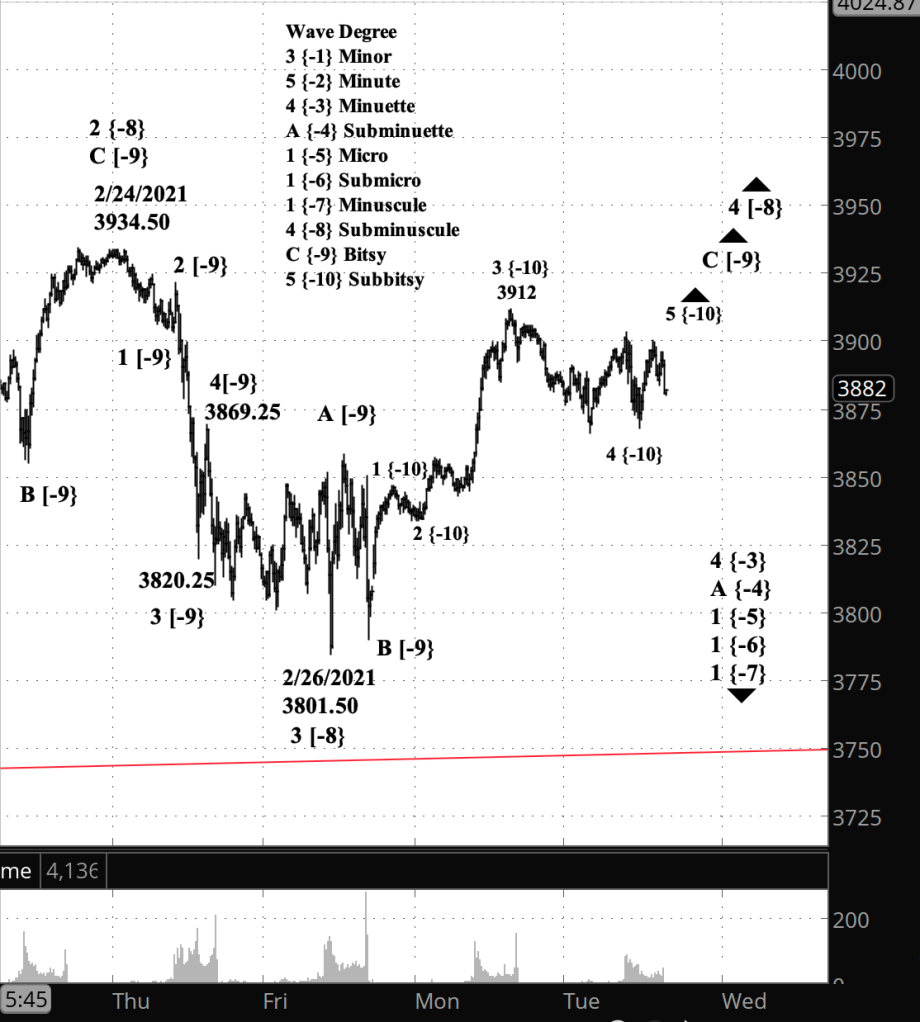
What’s happening now? The S&P 500 E-mini futures continued their upward correction, entering the final portion of the three-wave pattern.

What does it mean? Completion of the pattern opens two possibilities. The first is that the correction comes to an end with that their wave.

What are the alternatives? The alternative is that the correction extends with the addition of a second pattern.
[S&P 500 E-mini futures at 3:30 p.m., 55-minute bars, with volume]

What does Elliott wave theory say? The correction is wave 4 of Subminuscule degree, and within it, wave C of Bitsy degree began today in overnight trading. Under my principle analysis, the end of wave C will also end its parent wave 4, and wave 5 of Subminuscule will resume the downtrend that began February 15 from 3959.25, moving below 3720.50, perhaps significantly below that level. Under my alternative analysis, wave C of Bitsy degree will be followed by an X wave, which will separate the just completed corrective pattern from a corrective pattern that will follow. In this alternative case, the following pattern can be a shallow Flat or a more directional Zigzag. There’s no way to tell at this point.

Read More »
Friday, March 5, 2021

3:30 p.m. New York time

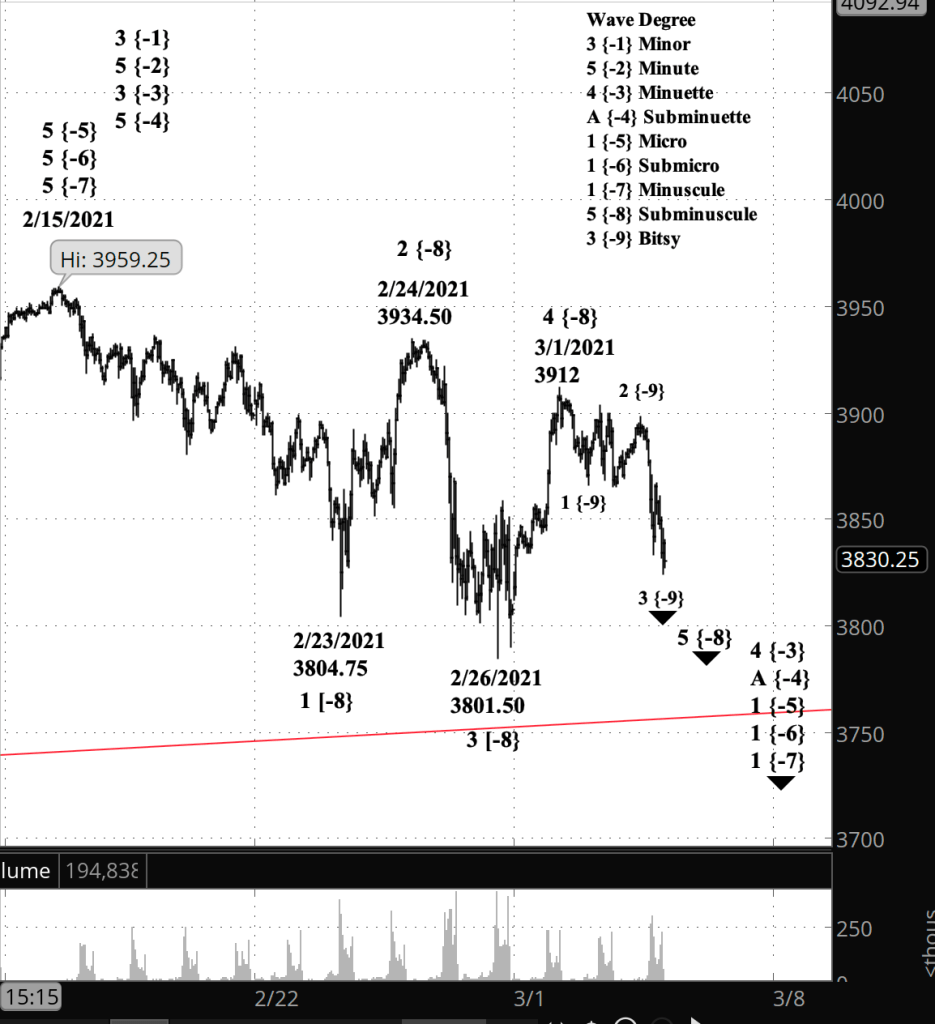
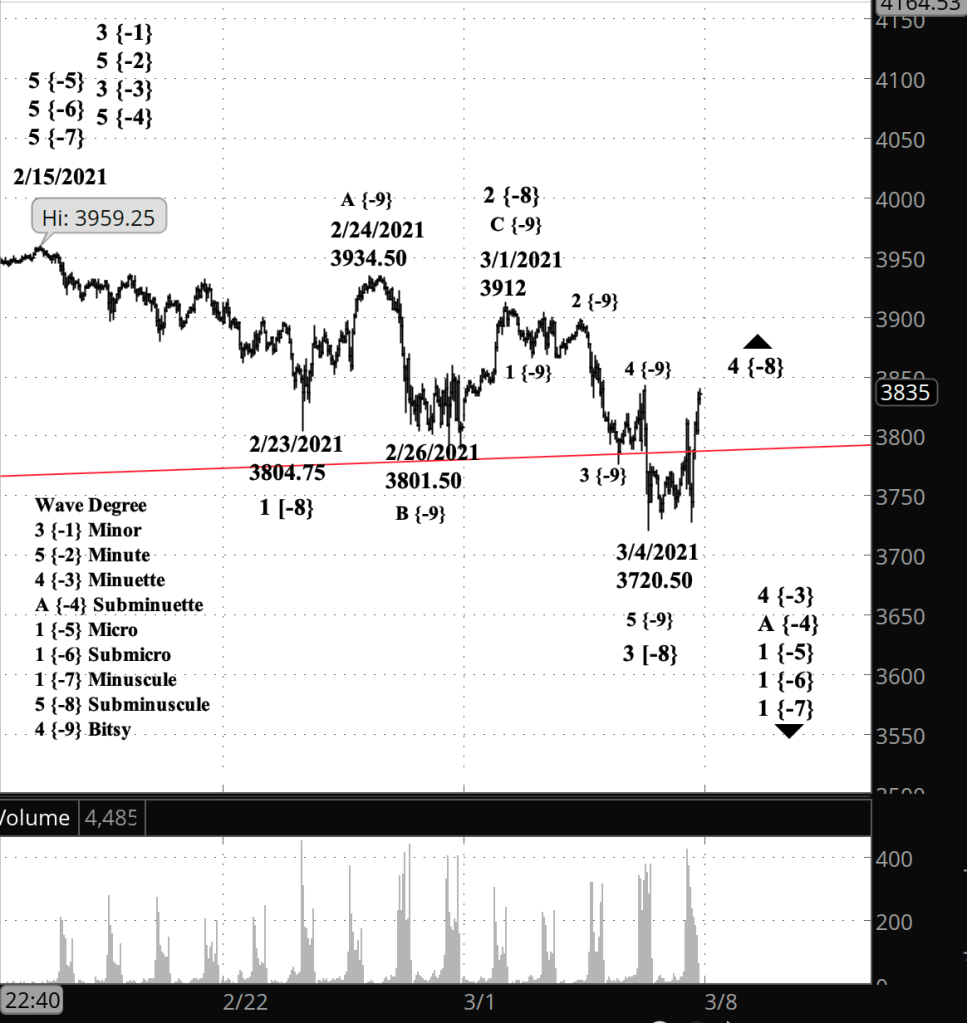
Half an hour before the closing bell. The S&P 500 continued its 4th wave upward correction, reaching 3839 at its highest point, with the trading day not yet ended. I’ve updated the chart.

10:05 a.m. New York time

What’s happening now? The S&P 500 E-mini futures completed a small downward move and began an upward correction, that briefly carried the price back above the upper boundary of a Diagonal Triangle that began in December 2018 before dropping below the boundary again, while remaining above yesterday’s low, 3720.50.

What does it mean? The correction is the second one within the low-level downtrend that began February 15, and so it will typically be a shallow correction, perhaps fluctuating along the triangle’s upper boundary.

What are the alternatives? A price rise above 3912, the March 1 beginning of present leg of the decline will trigger a full chart reanalysis.

[S&P 500 E-mini futures at 3:30 p.m., 50-minute bars, with volume]

What does Elliott wave theory say? We’ve reached a point filled with ambiguity, a not unheard of condition at transition points, and we shall have to wait for those ambiguities to be resolved. The big difficulty, as is often the case, is the pesky 3rd wave problem. The 3rd wave cannot be the shortEST of the three moving in the direction of the trend: Waves 1, 3 and 5. That is a firm rule in Elliott wave analysis.

And so, I renumbered the 2nd wave correction of Subminuette degree to avoid having the 3rd wave be the shortest. Nonetheless, the 1st wave at 215.50 points long has a greater length than the 3rd wave at 191.50 points long. So either the future 5th wave of Subminuette degree will need to be shorter than 191.50, or the 3rd wave is not yet over and will require reanalysis.

My trades. Having exited yesterday from my short iron condor options position on IWM, I’m looking for my next trade. The next series coming up are the options expiring April 16. By my rules, the ideal entry date was March 2 (45 days before expiration), and the acceptable range of dates for entry ends on March 9. The market is low volatility at this point. I prefer an implied volatility rank of 30% or higher, 25% at an absolute minimum. No liquid exchange traded funds meet that criteria, and only two stocks: NIO and JD, both of them Chinese companies whose shares carry higher currency and regulatory risks. So no entry today. I’ll take a look again Monday and Tuesday of next week in the hope of some improvement.

Read More »

Thursday, March 4, 2021

3:30 p.m. New York time

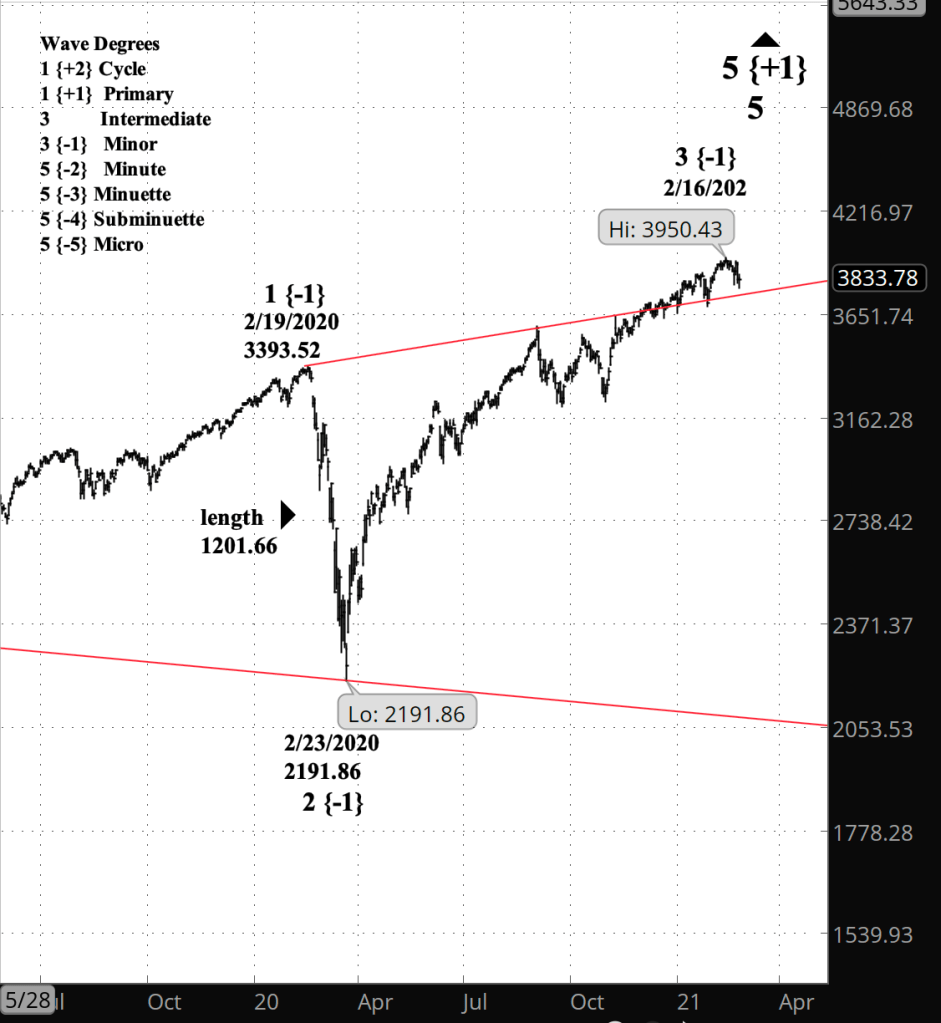
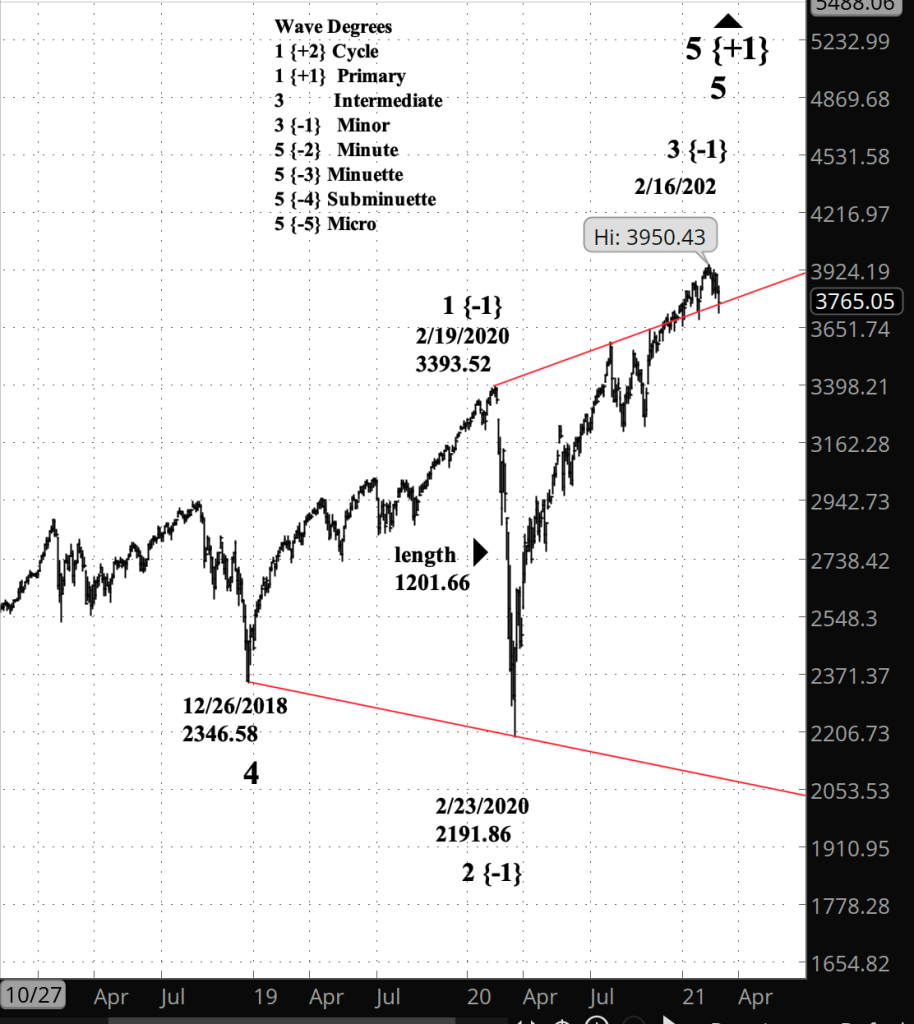
Half an hour before the closing bell. For the first time since January 6, the S&P 500 fell below the upper boundary of the Diagonal Triangle that began on December 2018 and has defined the future movement of the price for more than three years. That serves as yet another confirmation that a major downtrend is underway. I’ve updated the chart from this morning and added a big-picture chart.

[S&P 500 index at 3:27 p.m., 2-hour bars]

2:10 p.m. New York time

My trades. I’ve posted an update with results of my short iron condor options position on IWM. It can be found here.

1:15 p.m. New York time

My trades. I’ve exited my short iron condor position on IWM for a profit and shall update the trade analysis shortly with results and how the trade performed in relation to my Elliott wave analysis.

10:10 a.m. New York time

What’s happening now? The S&P 500 E-mini futures declined overnight, reaching a low of 3777.50 and then beginning a sideways movement. The decline from Wednesday’s overnight peak of 3895 covered 117.50 points.

What does it mean? The price moved below 3801.50, which was the low February 26, thereby confirming that the upward correction of late February had ended and the downtrend had resumed. Although the downtrend is in its early stage, it is a a time of small beginnings the portend large events. In other words, hang on tight. It will be an interesting roller coaster ride.

What are the alternatives? I see none at this point.

[S&P 500 E-mini futures at 3:30 p.m., 50-minute bars, with volume]

What does Elliott wave theory say? The downward movement that began on Wednesday is wave 3 of Bitsy degree, a very small movement with large implications. It is was typical of third waves in that it covered a lot of ground quickly. Although Bitsy 3 is small, it’s movement below the end of the previous 3rd wave of the same degree confirms that the wave 2 upward correction was completed on March 3. The 3rd wave ended this morning and the price began working through the 4th wave of Bitsy degree, which appears to be tracing a shallow corrective pattern called a Flat. Bitsy 4 will be followed by a 5th wave resumption of the downtrend, a decline that can either be short and quick or can stretch out and cover quite a large distance.

The movement is occurring within Bitsy’s parent degree, wave 5 of Subminuscule degree, which began on February 15 from 3959.25. The completion of Subminuscule 5 will mark the end of a series of nested 1st waves reaching three degrees higher, up to wave 1 of Micro degree, and above that, wave A of Subminuette degree and, up another degree, wave 4 of Minuette degree. So the completion of wave 5 of Subminuscule degree will trigger a nested series of upward 2nd wave corrections.

Read More »

Wednesday, March 3, 2021

3:30 p.m. New York time

Half an hour before the closing bell. The S&P 500 continued to decline throughout the day in the early stages of what will develop into a significant downtrend. The decline is wave 5 of Subminuscule degree, and within that wave the price is working through wave 3 of Bitsy degree. I’ve updated the chart below.

9:45 a.m. New York time

What’s happening now? The S&P 500 E-mini futures have completed an upward correction and in overnight trading resumed their downtrend.

What does it mean? The early stages of the downtrend will carry the price below 3801.50, the low of February 26, and ultimately, months from now, down to around 2000, the lower boundary of the massive Diagonal Triangle that began in December 2018.

What are the alternatives? It’s possible that the correction is forming a compound pattern, gluing together several corrective forms, and if so, it will continue awhile longer, delaying the resumption of the decline. Confirmation of the downtrend won’t kick in until the price moves below 3801.50.

[S&P 500 E-mini futures at 3:30 p.m., 45-minute bars, with volume]

What does Elliott wave theory say? The upward corrective movement was wave 4 of Subminuscule degree, whose high point was 3812. The resumption of the downtrend is wave 5 of Subminuscule degree, all of this happening within wave 1 of Minuscule degree, the smallest of a nested series of 1st waves up to Micro degree.

The completion of Subminuscule 5 will also mark the end of the 1st waves up to Micro degree and the beginning of a 2nd wave correction of Micro degree. Second waves have a tendency to retrace a great deal of the preceding 1st wave of the same degree. On this chart, Micro wave 1 peaked on February 15 at 3959.25, and I expect the future 2nd wave to approach 3900 and perhaps even exceed it. It will be followed by an energetic 3rd wave decline that will move well below the end of Micro wave 1, which has not yet occurred.

So, looking ahead in summary: A drop below 3801.50 by an unknown amount, an upward retracement, approaching and perhaps exceeding 3900 while remaining below 3959.25, and then a dramatic decline to a level that is below anything we’ve seen since February.

Read More »

Tuesday, March 2, 2021

3:30 p.m. New York time

Half an hour before the closing bell. The S&P 500 declined slightly and then rose again during the day, staying within the range of the overnight high and low. That sideways trend suggests that the wave 4 correction of Subminuscule degree is still underway, and within it, wave C of Bitsy degree, and down further, wave 5 of Subbitsy degree. I’ve updated the chart below.

9:05 a.m. New York time

What’s happening now? The S&P 500 E-mini futures continue an upward correction that began on February 26 from 3801.50 and by my analysis are in the last phase of the rise. The high so far today is 3903.50.

What does it mean? The end of the correction will be followed by a resumption of the downtrend that began on February 15 from 3959.25 on the futures.

What are the alternatives? If the price rises above 3959.25, then the corrective pattern that began from that price on February 15 ended earlier than my analysis shows, and I would reassess the chart. I consider this to be a lower likelihood.

[S&P 500 E-mini futures at 3:30 p.m., 15-minute bars, with volume]

What does Elliott wave theory say? The rise from February 26 internally is in wave C of Bitsy degree within wave 4 of Subminuscule degree — were talking very small degrees here, so small that I had to make up the name “Bitsy” for the degree that stands nine levels below Intermediate degree.

And now, a new made-up name, “Subbitsy”, for the degree 10 levels below Intermediate. Within wave C of Bitsy degree, the price has completed four waves of Subbitsy degree and this morning about 4 a.m. began wave 5 of Subbitsy degree. That 5th wave remains below the peak of Subbitsy wave 3, which was at 3912. And although the 5th wave is the end of the rise, and although upward waves generally exceed the previous upward wave in the series, there is no rule in Elliott that requires a 5th wave to exceed the prior 3rd wave. It can fall short, a condition called “truncation” in the Elliott wave terminology.

Truncated or not, the end of Subbitsy 5 will also be the end of Bitsy C and, probably, Subminuscule 4, and the beginning of Subminuscule 5 to the downside, which will fall below, perhaps well below, 3801.50, the end of the previous 3rd wave of Subminuscule degree.

I hedged the end of Subminuscule 4 in the graf above with “probably” because corrective waves sometimes will form combinations of patterns, connecting two Flats, for example, or a Flat and a Diagonal. Fourth waves are especially prone to this. So if Subminuscule 4 forms a simple corrective pattern, then it will end with the Bitsy C peak. If it forms a combination of patterns, then there will be a downward X wave separating the patterns, and then another upward correction pattern.

Read More »

Monday, March 1, 2021

3:30 p.m. New York time

Half an hour before the closing bell. The S&P 500 continues its rise, reaching a high today of 3914.50 on the index, 3912 on the futures. Wave C of Bitsy degree within wave 4 of Sub minuscule degree is still underway. I’ve updated the chart below.

2:50 p.m. New York time

My position. The price of IWM has moved above the upper boundary of the profit zone of my short iron condor options position, as the middle wave of wave C of Bitsy degree within wave 4 of Subminuscule degree continues its rise. At this point exiting would cost me 28% more than waiting for the options to expire. So I shall hold on to the position, anticipating that the end of wave C will be followed by either a resumption of the downtrend that began on February 10 from 230.32, or a downtrending separator wave that will paste two corrective patterns together. In either case, the end of the C wave will give me chance to exit either for a profit or for a smaller loss. The options expire in 18 days.

10:15 a.m. New York time

What’s happening now? The S&P 500 E-mini futures moved into the final wave of a shallow upward corrective pattern, reaching a high so far of 3878.75.

What does it mean? The basic correction pattern is three waves — up, down, up for an upward correction. However, the corrections that comes later in the larger trend sometimes will extend, pasting two or even three corrective patterns together, lengthening the correction’s lifespan. Once the correction has ended, the price will then begin a high-energy move to the downside, resuming the downward trend that began on February 16 from 3959.25.

What are the alternatives? It’s conceivable that the high of February 16 was not the end of a major uptrend. If that’s the case, then the corrective pattern would be seen as the small beginnings of the next leg up of the uptrend. I consider this to be a lower probability.

[S&P 500 E-mini futures at 3:30 p.m., 15-minute bars, with volume]

What does Elliott wave theory say? I’ve zoomed the chart in to get a better view of the corrective pattern, which is wave 4 of Subminuscule degree within a series of 1st waves of increasingly higher degree, up to Micro degree. All of that, in turn, is within an A wave correction of Subminuette degree, within wave 4 of Minuette degree, within wave 5 of Minute degree, within wave 3 of Minor degree. Minor wave 3 began on February 23, 2020 from 2l91.86. on the index.

A 4th wave typically ends within the range of the 4th wave with the preceding 3rd wave. I’ve marked that range with blue lines on the chart: 3820.25 to 3869.25.

Read More »

Friday, February 26, 2021

3:30 p.m. New York time

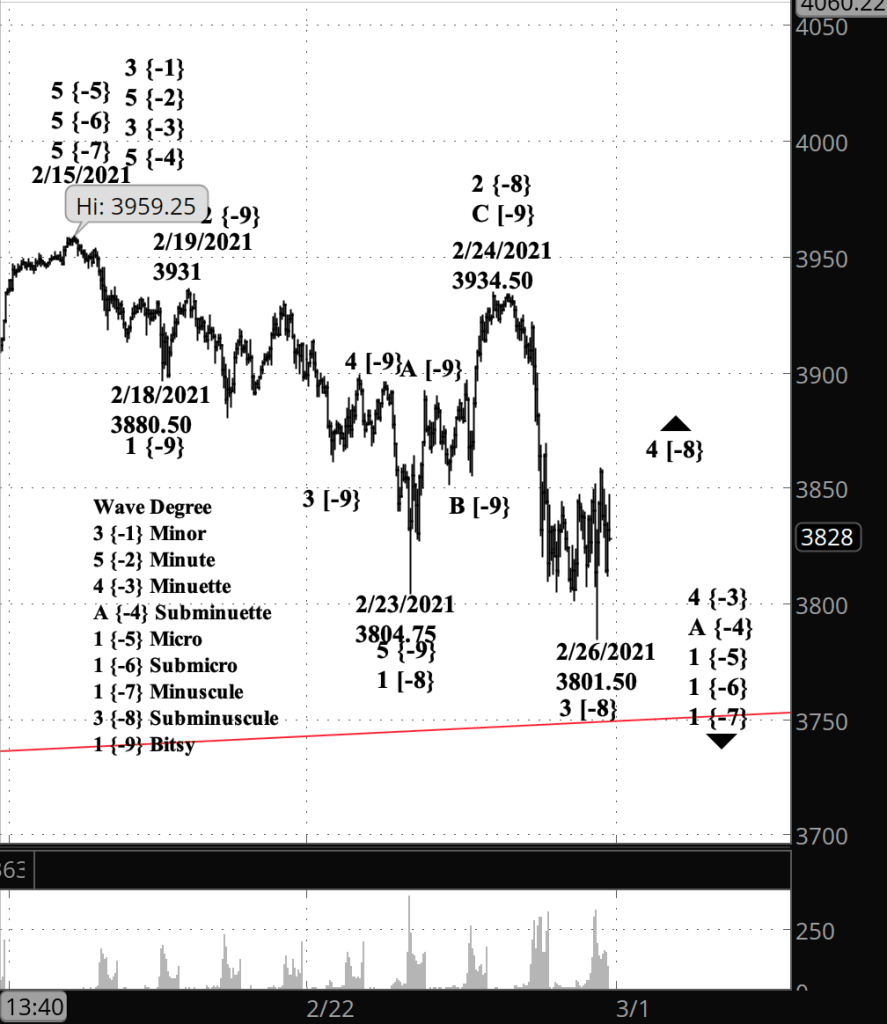
Half an hour before the closing bell. The S&P 500 continued in its sideways movement, staying above the day’s low, 3801.50 as it worked through the 4th wave of Subminuscule degree. I’ve updated the short-term chart from this morning. And here’s the long-term chart, showing the entirety of the rise from February 23, 2020, with the Diagonal Triangle marked in red. In the big picture, the next decline will carry down to the lower boundary of the triangle in a 4th wave, and then rise back to the upper boundary in a 5th and final wave.

[S&P 500 index at 3:29 p.m., daily bars]

2:25 p.m. New York time

I’ve decided to hold my IWM short iron condor options position through the weekend and revisit exiting on Monday. I’ve updated the IWM Trade post with details and a chart.

9:55 a.m. New York time

What’s happening now? The S&P 500 E-mini futures declined 3.25 points below the low of February 23, to 3801.50, and then began a sideways movement.

What does it mean? The break below the February 23 low confirms that a downtrend is under way, and that the price will carry lower. The sideways movement that followed is a shallow correction pattern, a pause that will be followed by further decline. The next milestone is the upper boundary of the expanding triangle that began in December 2018 (the red line on the chart), ending the overthrow condition that began on December 28, 2020.

What are the alternatives? What I’ve labeled a downtrend could in theory be a leg in an expanding triangle pattern that would carry the price above the high of December 24, 3934.50. I consider this to be a low probability. Another possibility is that wave 3 is not yet complete, that today’s low is the end of the 1st wave within wave 3 and the sideways pattern is the beginning of wave 2, which typically will retrace much of the 1st wave.

[S&P 500 E-mini futures at 3:30 p.m., 40-minute bars, with volume]

What does Elliott wave theory say? The sharp decline from February 25 was wave 3 of Subminuscule degree, and the sideways pattern that followed is a wave 4 correction, which is typically a shallow construction. This is all happening within a nested series of 1st waves, up to Micro degree, within wave A of Subminuette degree, which in turn is within wave 4 of Minuette degree. So in the longer run, the wave 4 correction of Minuette degree will be followed by wave 5 that will reach new highs.

My trades. My options position on IWM has 20 days until expiration, and in accordance with my rules, I shall be looking to exit if I can do so profitably. More on this later.

Read More »

Thursday, February 25, 2021

3:30 p.m. New York time

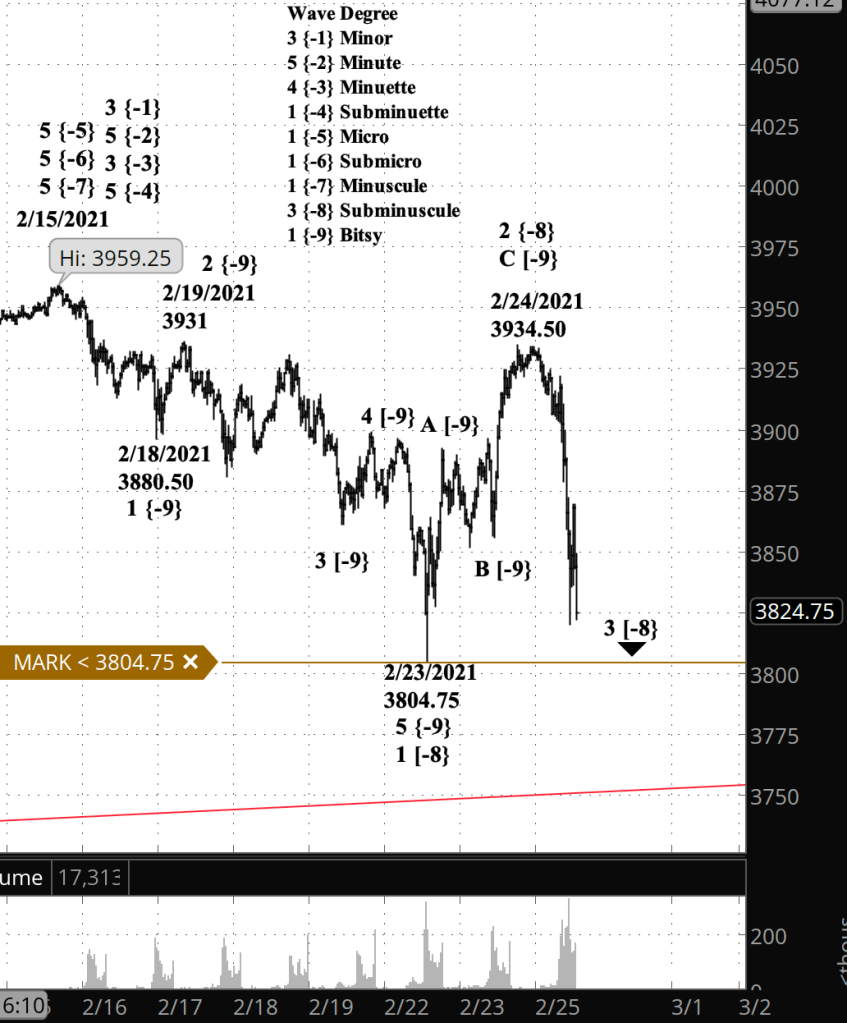
Half an hour before the closing bell. The S&P 500 fell to a low of 3820.25 during trading today, 15.5 points above the low of 3804.25 on February 23. A cross below that level will confirm that wave 3 of Subminuscule degree is underway. The updated chart below includes an alert showing the location of the 3804.25 mark. (Note that WordPress’ resizing function for the chart is, once again, not working on the update. So we all get to enjoy a supersized chart this afternoon.)

10:20 a.m. New York time

What’s happening now? The S&P 500 E-mini futures reached a high of 3934.50 in overnight trading and then reversed to the downside.

What does it mean? That high is above the previous high of 3931, attained on February 19. This has implications for the Elliott wave count.

What are the alternatives? See the Elliott wave theory section below.

[S&P 500 E-mini futures at 3:30 p.m., 35-minute bars, with volume]

What does Elliott wave theory say? A firm rule of Elliott wave analysis is that a 4th wave can’t exceed the end of wave 1. The end of the 1st wave in my count is 3931, and the end of the “4th wave” is 3934.50, which is 3.5 points higher. That means that the “4th wave” is no such thing. So what could it be?

In doing the recount, I have two requirements that must be met. I must ensure that no 4th wave moves beyond the end of wave 1. And in the the downtrend from the 3959.25 peak, reached on February 15, I must ensure that the 3rd wave isn’t the short of the three descending waves in the five-wave pattern. And as it turns out, it can be done, as the chart above shows.

I reanalyzed the internals of the decline from 3959.25 to the low of 3804.75 reached on February 23 so that the low marks the end of wave 1 of Subminuette degree, and the rise that followed becomes Subminuette wave 2. (See my chart in yesterday’s post to compare the new count with the old one.) That eliminates the problematic 4th wave and provides a 3rd wave that is longer than the 1st wave, fulfilling the requirement that wave 3 can’t be runt of the litter.

Second waves tend to take back much of the preceding 1st wave, and I had remarked in an earlier post that the rise seemed far too steep for a 4th wave. The recount takes care of that difficulty with the form.

So what happens next? If the overnight high, 3934.50, is wave C within wave 2 of Subminuette degree, then the upward correction is over, and the price will fall below 3804.75, perhaps quite a bit below. However, I count only one wave so far within wave 2, and there should be three waves. So I would expect a wave B to the downside followed by wave C to the upside, which will complete wave 2.

And that points to a requirement that must be fulfilled by this new wave 2: A second wave cannot move beyond the start of wave 1. It must remain below the February 15 high of 3959.25, where wave 1 begins. And that’s OK. The structure has 24.75 points to work with before reaching that level. Plenty of room.

Read More »

Wednesday, February 24, 2021

3:30 p.m. New York time

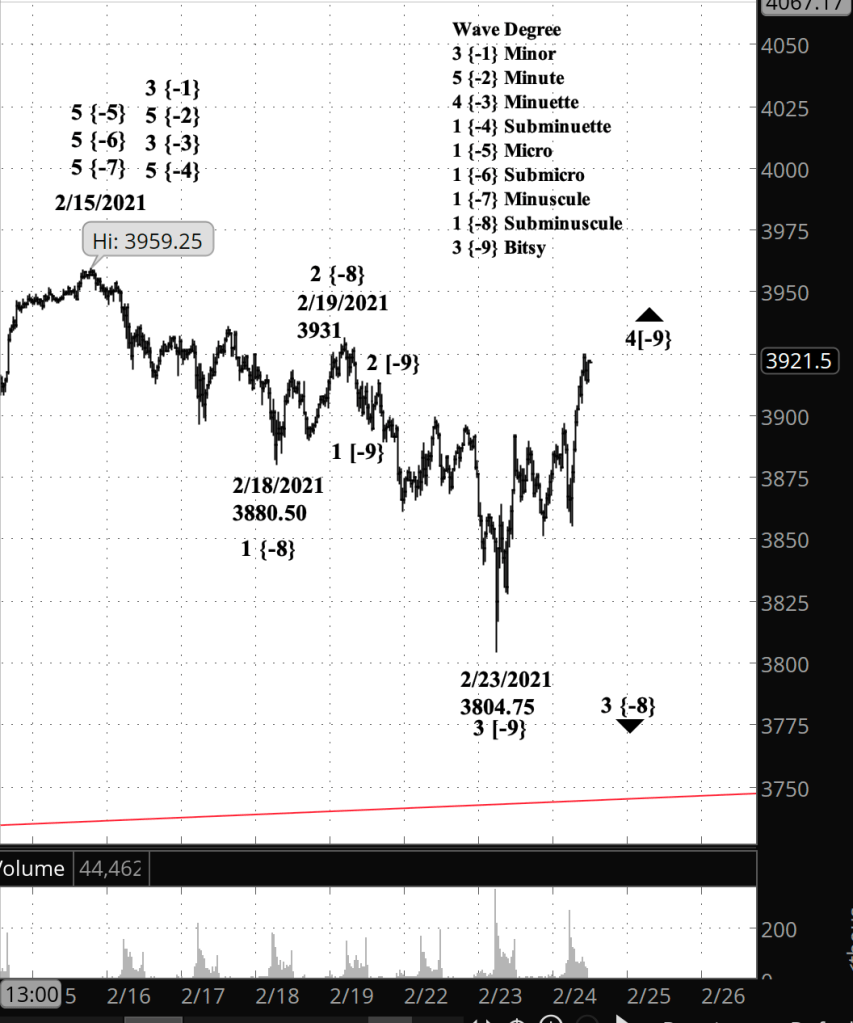
Half an hour before the closing bell. The S&P 500 rose past sharply during the day, reaching a high of 3924.75 on the futures, 3928.39 on the index. I’ve updated the chart below adjusting some of the internal count to avoid wave 3 of Bitsy degree being the shortest wave, which is forbidden under the rules of Elliott wave analysis.

9:55 a.m. New York time

What’s happening now? The S&P 500 E-mini futures continued its upward correction in overnight trading.

What does it mean? Once the correction has ended, the price will resume the downtrend that began February 15, moving below yesterday’s low, 3804.75.

What are the alternatives? The correction can be analyzed as having been completed with the overnight high of 3874.50. I consider this to be the slightly less likely analysis.

[S&P 500 E-mini futures at 3:30 p.m., 30-minute bars, with volume]

What does Elliott wave theory say? The rise from February 23 is wave 4 of Bitsy degree. Fourth waves tend to be shallow, and this one is not, having come within 3 points of the start of Bitsy wave 3. So I don’t have a lot of confidence in the principle analysis compared to the alternate. In either case, once wave 4 is complete, the 5th wave that follows will move below the end of wave 3.

Read More »

Bitcoin Analysis

3:35 p.m. New York time

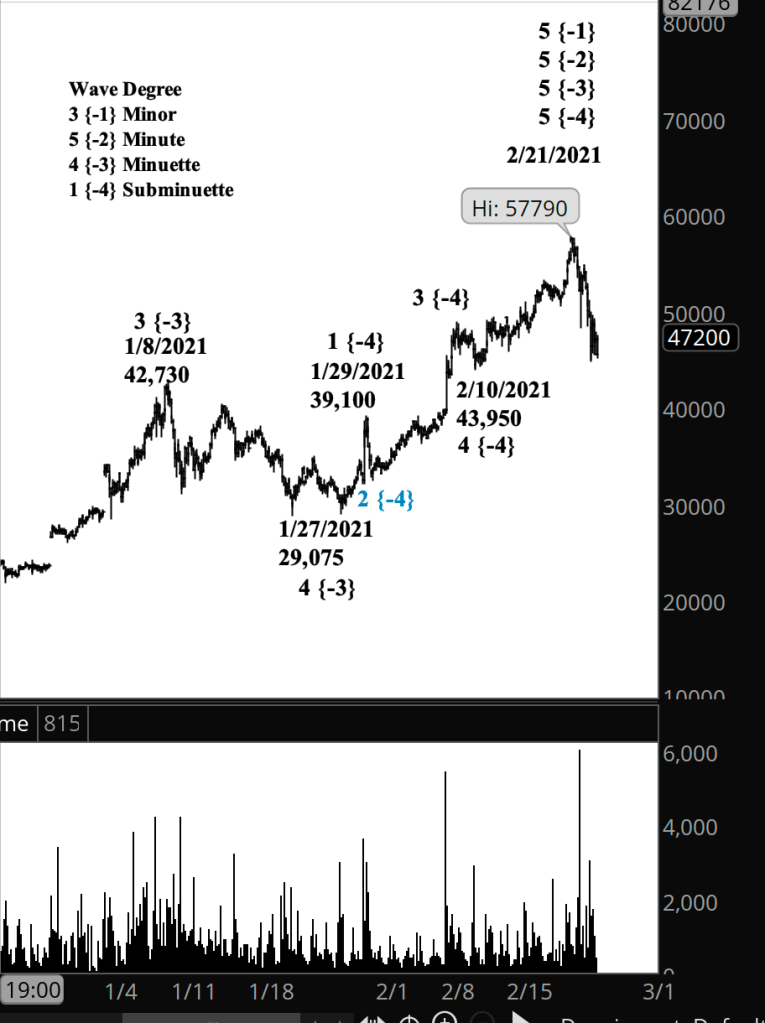
What’s happening now? Bitcoin futures today continued their decline from the high of 57,7890 set on February 21.

What does it mean? If the price stays below that high, then Bitcoin has begun a downward movement that as either a correction of the rise that began December 14, 2018 from 3120….

What are the alternatives? … or, it has begun a downward correction of the still incomplete rise that began on February 10 from 43,950.

[Bitcoin futures at 3:37 p.m., 2-hour bars, with volume]

What does Elliott wave theory say? If the price remains above the February 10 level of 43,950, then the rise did not end on February 21 and wave 5 of Subminuette degree is still underway. If the price moves below 43,950, then either the uptrend ended on February 21, or wave 5 of Subminuette degree is taking a Diagonal Triangle formation. If it is expanding, then the price will bounce between widening trend lines for five waves.

Read More »