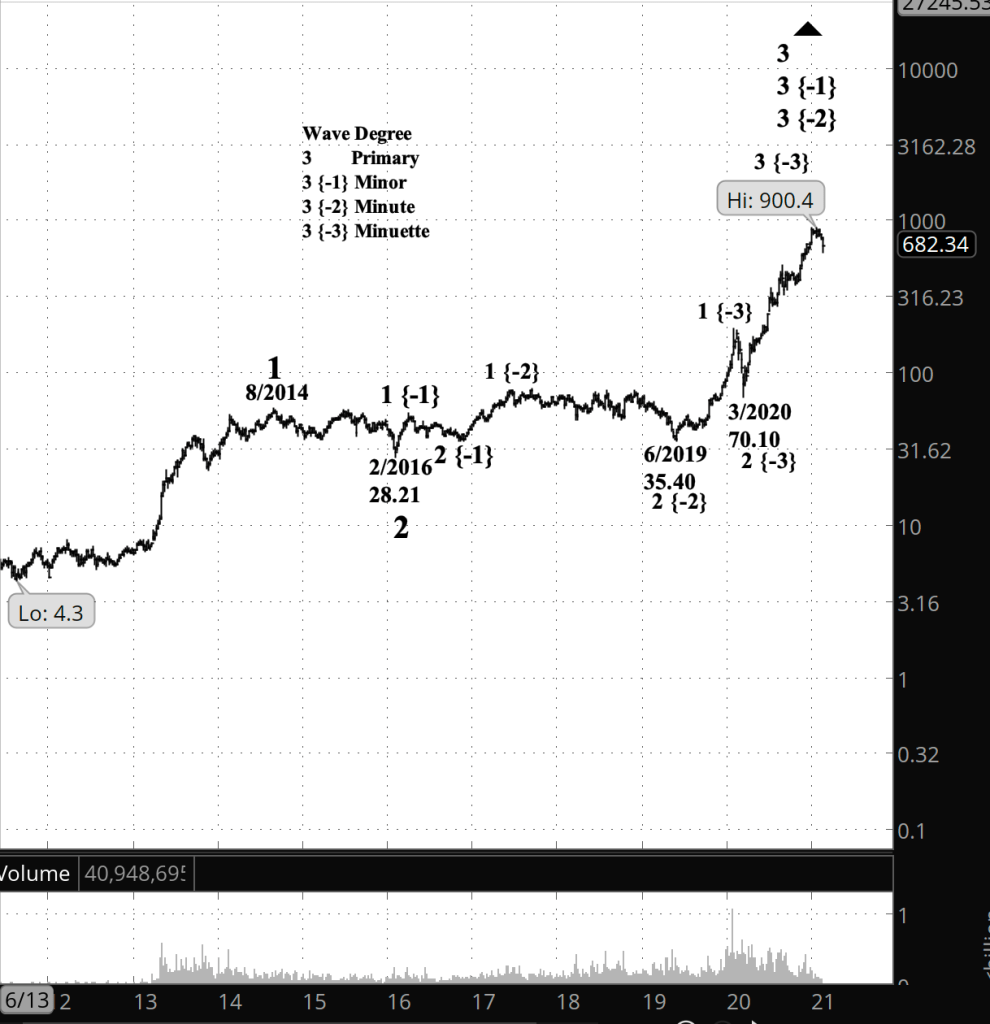
What’s happening now? TSLA accelerated its decline from a peak of 900.40 set on January 25, reach as low as 619 in afternoon trading.
What does it mean? The stock is in the early stages of a downward movement correcting the rise that began in June 2019.
What are the alternatives? The decline hasn’t been that large yet, and even though the rise from has met all of the requirements for completion, it’s possible that the present drop is a lower-level correction within the larger uptrend. The lower the price, the less likely the alternative scenario.
[TSLA at 1:49 a.m., weekly bars, with volume]
What does Elliott wave theory say? TSLA by my principle count has completed wave 3 of Minuette degree and has embarked on a wave 4 correction to the downside. This is happening within a series of 3rd waves all the way to Primary degree. The whole Primary degree movement is within an uptrending Intermediate degree that began in August 2011 from 4.30.
Returning to the Minuette degree: 4th waves tend to be shallow, so I expect the price to remain well above the beginning of wave 3 from 70.10 in March 2020. After the 4th wave is complete, then the price will push upward to new highs.
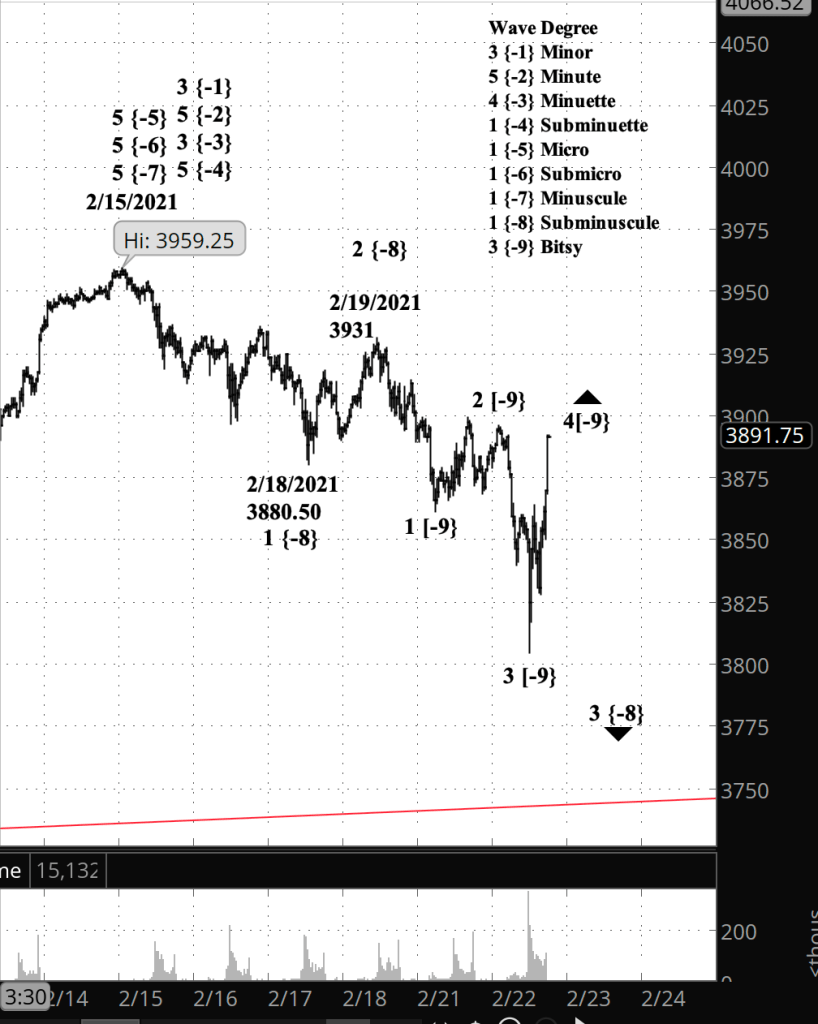
Half an hour before the closing bell. The S&P 500 reached a low of 3904.75, the end of wave 3 of Bitsy degree, and bounced in a wave 4 correction to the upside. Following wave 4 it will decline below 3904.05 in a 5th wave. I’ve updated the chart.
What’s happening now? The S&P 500 E-mini futures continued to fall in overnight trading, reaching a low of 3840 in the middle portion of the decline that began on February 15 from 3959.25, and at a smaller level, the middle portion of the decline that began on February 19 from 3931.
What does it mean? What we’ve seen since mid-February are the early steps in what will develop into a significant decline of 1,000 points and more.
What are the alternatives? The alternative is that the rise that ended on February 15 isn’t over, and the price will reverse and set a new high. The lower the price goes, the less likely is the alternative.
[S&P 500 E-mini futures at 3:30 p.m., 25-minute bars, with volume]
What does Elliott wave theory say? The present decline is wave 3 of Bitsy degree within wave 3 of Subminuscule degree within wave 1 of Minuscule degree, the smallest of a series of 1st waves of increasingly larger degree, up to wave 1 of Minuette degree, and above that, wave A of Minute degree within wave 4 of Minor degree. At the Bitsy degree, it’s possible that the morning bump to the upside is the beginning of Bitsy wave 4, or it could be wave 2 correction within Bitsy 3. Time will clarify the chart.
Minor wave 4 is part of an expanding Diagonal Triangle that began December 26, 2018 and will eventually reach the lower boundary of that triangle, presently in the low 2000s.
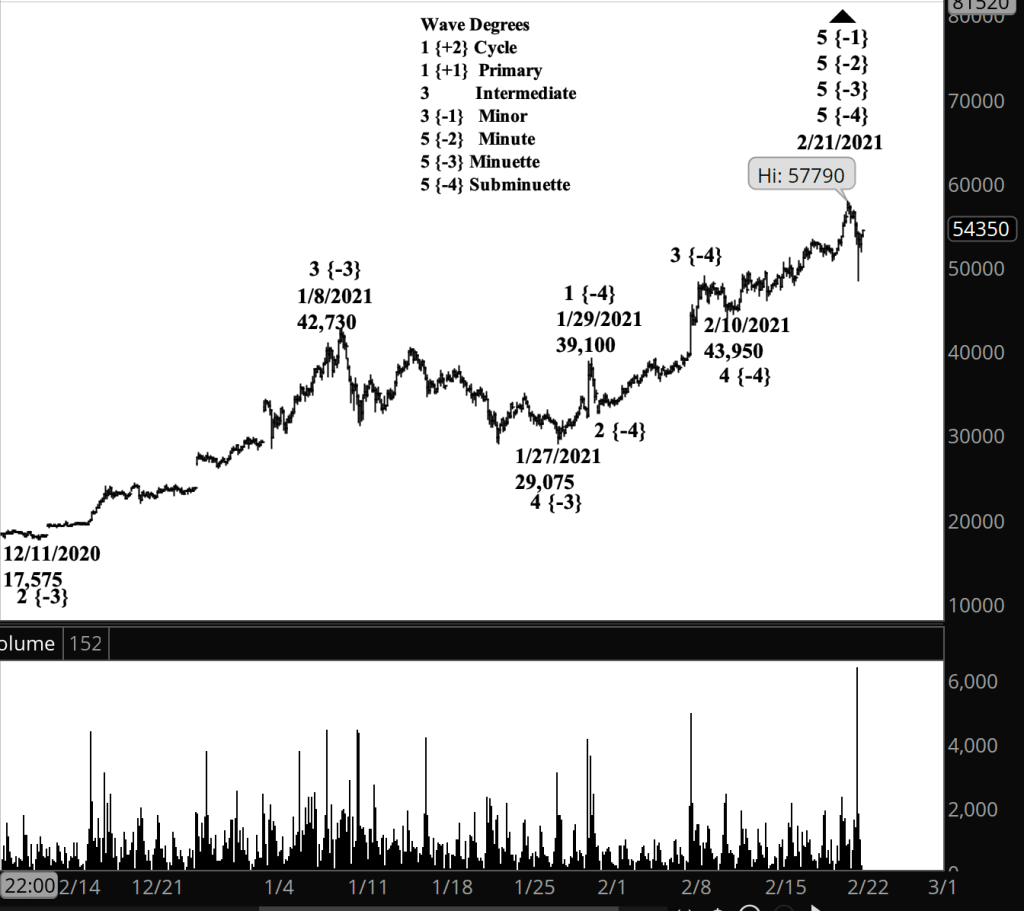
What’s happening now? Bitcoin futures fell below 50,000, reaching as low as 49,320 and then retreating upward.
What does it mean? The decline could be a correction within the rise from January 27 that hit a high of 57,790 on February 21.
What are the alternatives? It could also be the beginning of a significant downward movement that will carry the price into 30,000s and perhaps lower.
[Bitcoin futures at 3:11 p.m., 140-minute bars, with volume]
What does Elliott wave theory say? Under the rules of Elliott wave analysis, wave 5 of Minuette degree as met the minimum internal requirement: A five wave upward movement in which the middle wave is not the shortest. That’s not a guarantee that wave 5 is complete. The present dip down could reverse and move to yet a new higher high, or it could continue downward. A drop below 43,950, the end of Minuette wave 4, would strength the case that the February 21 high marks a significant reversal point. A drop below 29, 075, the low set on January 27, the start of wave 5 of Minuette degree, would make the reversal theory even more likely.
Half an hour before the closing bell. The S&P 500 reversed to the upside in trading today, and then reversed again, back to the downside. The analysis of this morning stands. I’ve updated the chart below.
Also, more resizing problems with the charts. Thanks, WordPress!
9:45 a.m. New York time
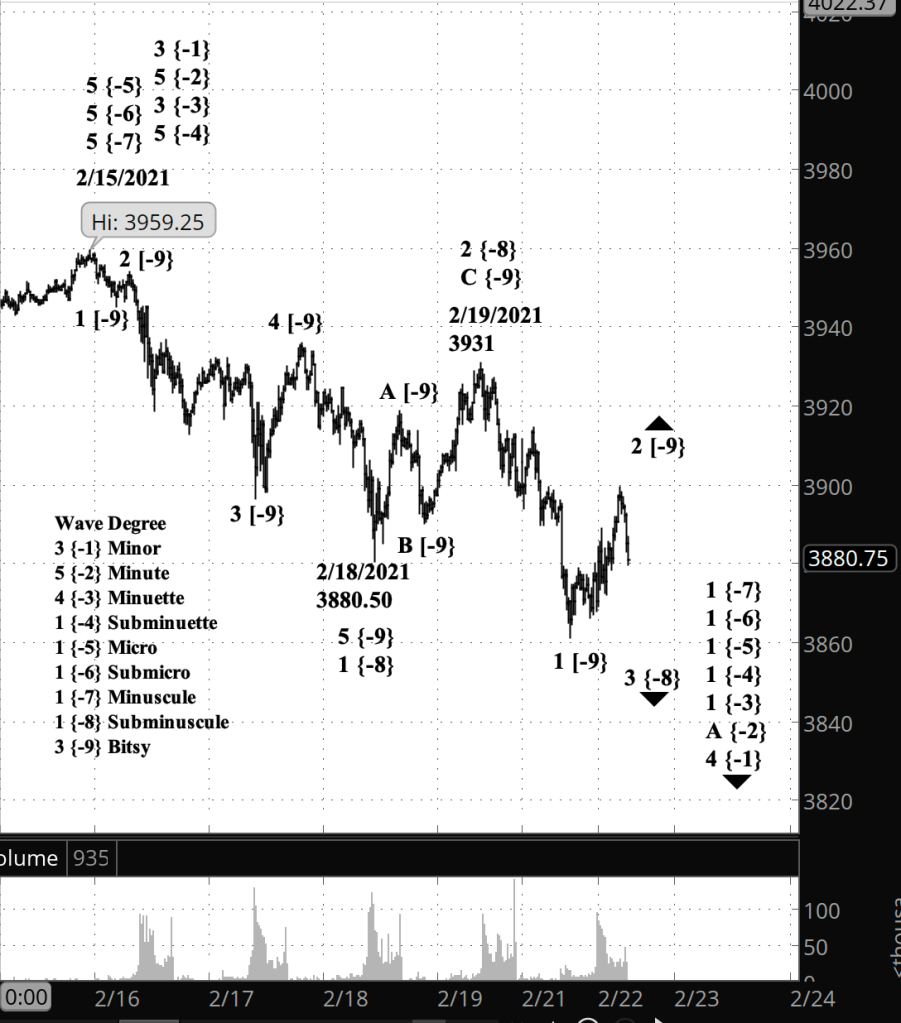
What’s happening now? The S&P 500 E-mini futures completed an upward correction within the decline that began on February 15 and has now resumed the downtrend.
What does it mean? The index and its derivatives are in the early stages of a downtrend that will eventually carry it around 2,000 points below its present levels.
What are the alternatives? If the price reverses and moves above the February 15 high — 3959.25 on the futures, 3950.43 on the index — then the uptrend that began on February 23, 2020 from 2191.86 on the index is still underway.
[S&P 500 E-mini futures at 3:30 p.m., 20-minute bars, with volume]
What does Elliott wave theory say? In overnight trading the futures moved below the February 18 low of 3880.50, which was the start of wave 1 of Subminuscule degree. Under the rules of Elliott wave analysis, if the price moves below the start of wave 1, then it’s not wave 2. That rule required that wave 2 be considered to have ended at the February 19 peak, 3931, as a result of the lower low.
All that has ensued since the February 15 peak are the early movements within a downward correction, wave 4 of Primary degree, and within it, from larger to smaller, an A wave of Minute degree and then a series of 1st waves, from Minuette down to Subminuscule.
The entire structure is within a Diagonal Triangle that began in December 2018, with each ensuing wave longer than the one that came before. So Primary wave 4 will eventually carry down to the lower boundary of the triangle, which presently in the 2080s and sinking daily.
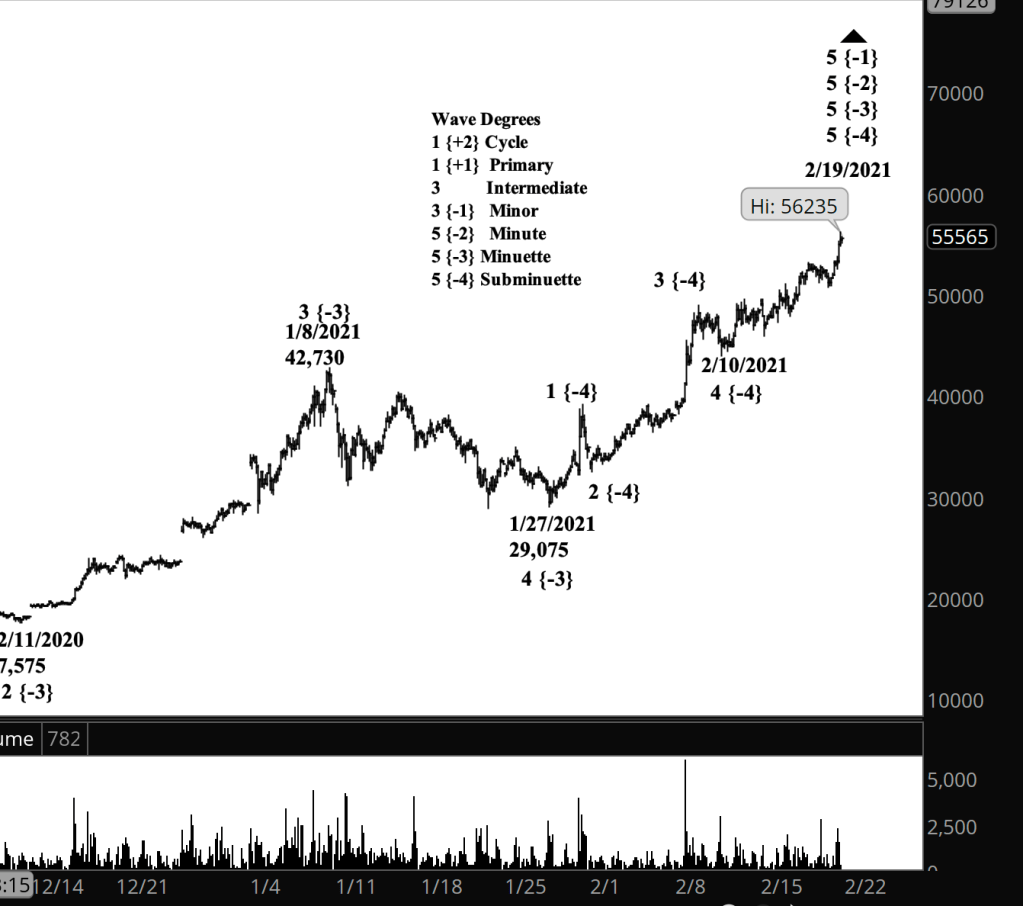
What’s happening now? Bitcoin futures continued the upward push that began on January 27 from 29,075, reach a high today (so far) of 56,235.
What does it mean? The rise since late January is the final leg of an uptrend that began on December 14, 2018 from 3120. It’s end will trigger a significant downward movement over the next few weeks and months, composed of the usual pattern of rises and falls.
What are the alternatives? The upward sprint from February 10 has fulfilled the minimum requirements of Elliott wave theory. Today’s high could be the end of the rise, or there could be more upside potential.
[Bitcoin futures, 135-minute bars, with volume]
What does Elliott wave theory say? The end of the rise will complete fifth waves all the way up to Primary degree, the degree that began in December 2018. If the ensuing decline is a correction, then the price over the long haul will remain above the December 2018 low of 3120. If the decline is a new downtrend, then the price will break below that level, although it will take significant time for that to happen.
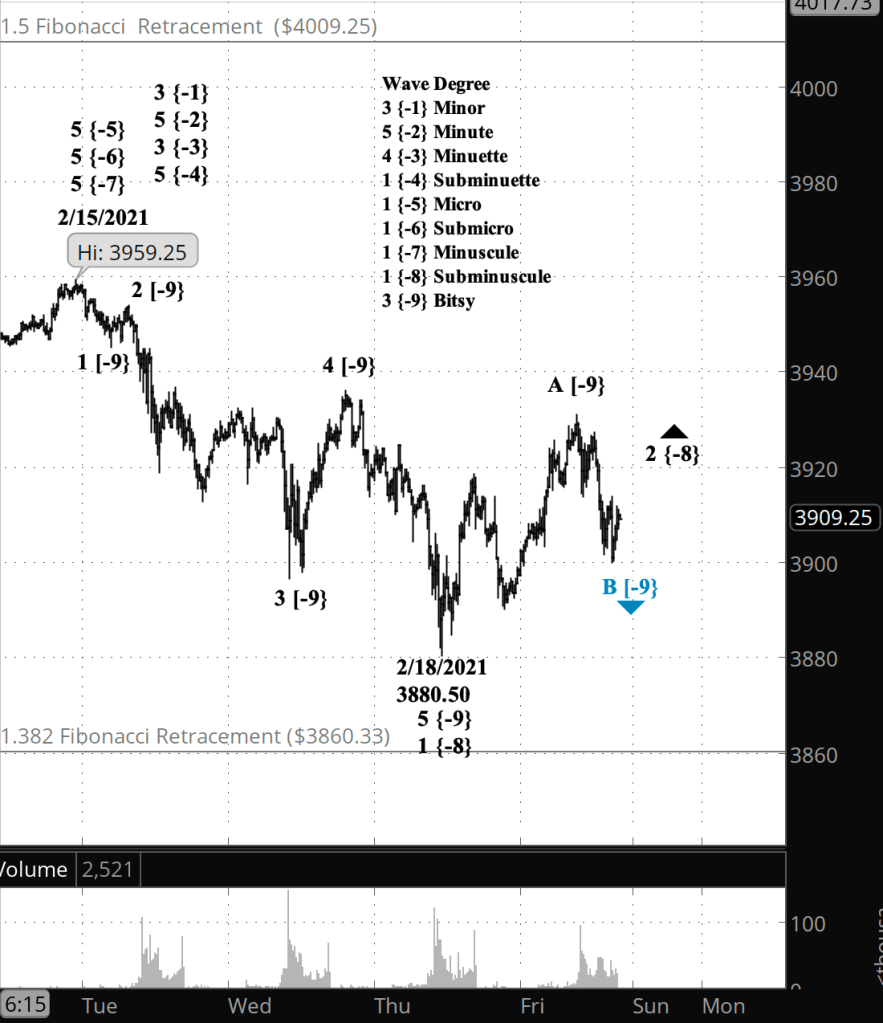
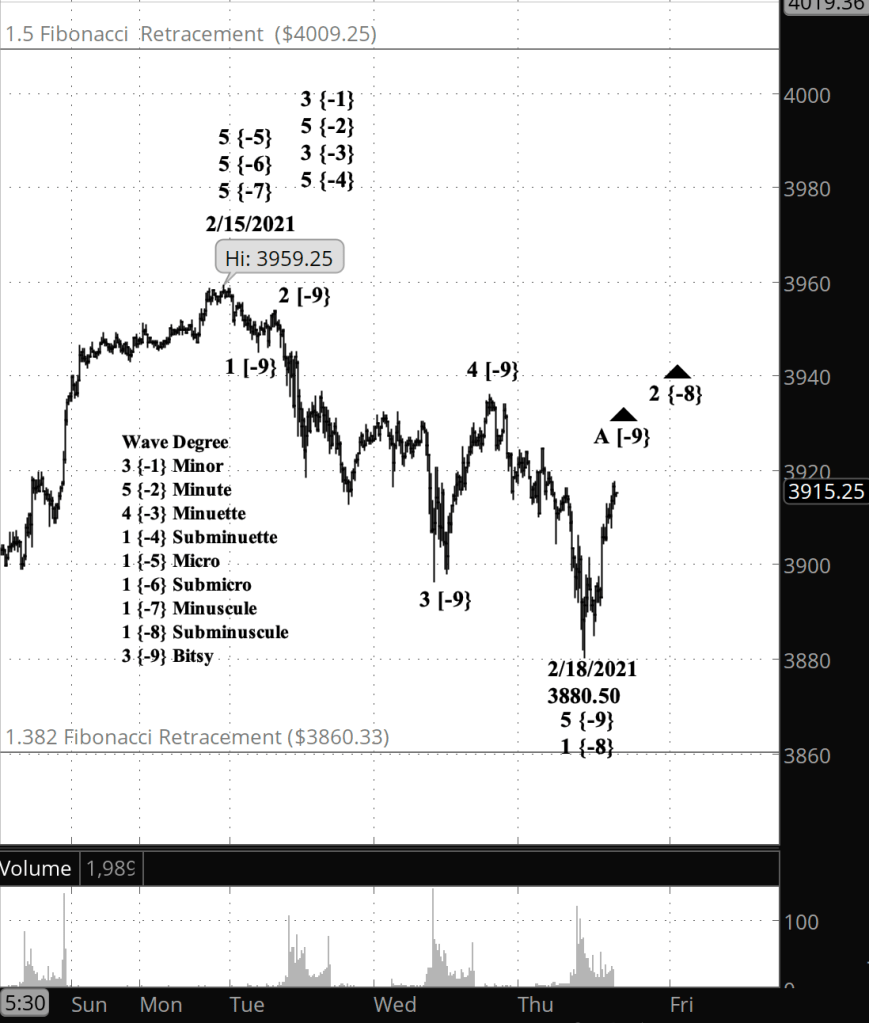
Half an hour before the closing bell. The S&P 500 completed the first leg, wave A of Bitsy degree, of the upward correction that began on February 18 and has embarked on the second leg, wave B of Bitsy degree. I expected the second wave to end above the start of the correction, 3880.50.
What’s happening now? The S&P 500 E-mini futures continues to rise in the first leg of a small scale upward correction within a larger downtrend that began on February 15.
What does it mean? The correction will remain below the February 15 peak of 3959.25 on the futures, 3950.43 on the index, and will be followed by further moves to the downside, of increasing significance.
What are the alternatives? If the price moves above the February 15 high, then the decline that followed is a correction within an ongoing uptrend.
[S&P 500 E-mini futures at 3:30 p.m., 15-minute bars, with volume]
What does Elliott wave theory say? Wave A of Bitsy degree has completed it’s 3rd wave internally and is correcting with wave 4. A final push upward will complete the 5th wave within Bitsy and begin declining Bitsy B, which will remain above the start of A, 3880.50 on the futures. A final wave C of Bitsy degree will push still higher while remaining below the February 15 high and will complete wave 2 of Subminuscule degree. The next move after Subminuscule 2 will be Subminuscule 3, a comparatively powerful wave at this small degree that will push below 3880.50, perhaps by quite a bit.
Half an hour before the closing bell. The S&P 500 completed the declining wave 1 of Subminuscule degree, at 3880.50 on the futures and 3885.03 on the index, and then reversed to the upside as it began a 2nd wave correction. Second waves tend to retrace much of the distance traveled by the preceding 1st wave, which began its decline from 3959.25. I’ve updated the chart.
10 a.m. New York time
What’s happening now? The S&P 500 E-mini futures continued their decline from the February 15 high, 3959.25, entering the final phase before an upward correction that, if it’s typical, will retrace much of that decline while remaining below the peak.
What does it mean? Under my principle analysis, the fall that began on February 15 is the beginning of a major decline. Declines begin small and expand their reach, except during panics, such as the rapid decline of a year ago. (See the long-term chart posted yesterday.) So after the present decline and the retracement that will follow, the price will resume its decline, following the same pattern we’ve seen so far: A five-wave decline, an upward correction, and another five-wave decline, with each decline wave internally showing a similar five-wave pattern. Ultimately, the price will reach into the 2000s.
What are the alternatives? It is possible to reach the chart to mean that the decline from February 15 is a correction and not the beginning of a downtrend. If that’s the case, the next move will likely be to the upside, just as with the principle analysis, but it will exceed the February 15 peak.
[S&P 500 E-mini futures at 3:30 p.m., 15-minute bars, with volume]
What does Elliott wave theory say? Under the principle analysis, the S&P 500 is in wave 1 of Subminuscule degree and within it, wave 5 of Bitsy degree, very small degrees indeed. Walking upward, Subminuscule 1 is a subwave nested within a series of 1st wave of increasingly higher degree. On the chart I’ve labeled the Bitsy degree with numbers, 1 through 5, as is the convention for movements in the direction of the direction of the trend.
Under the alternative count, the wave Bitsy wave 3 (labelled 3 {-9}) becomes Bitsy wave A of a downward correction, Bitsy 4 is wave B, and the present decline, labelled wave 5, is wave C, the final wave of the correction. The next move up under this scenario would resume the upward movement with five numbered waves to the upside.
The decision point is the peak, 3959.25 on the futures, 3950.43 on the index. The price will rise under both the principle and alternative scenarios. If the coming rise is a correction, the price will remain below the peak. If it’s a resumption of the uptrend, it will break above the peak.
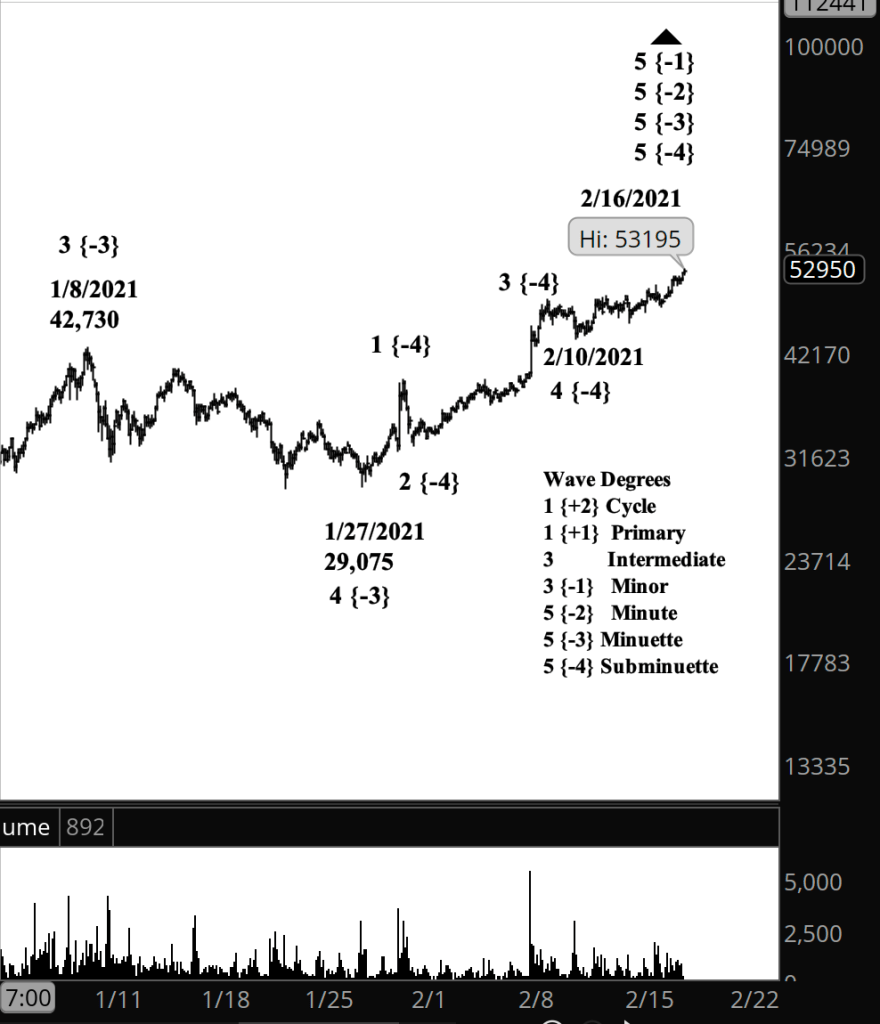
What’s happening now? Bitcoin futures reached a new high today, 53,195.
What does it mean? The price is in the last phase of the rise from January 27, from 29,075. I count that rise as being in its middle phase internally, so Bitcoin has more upside potential.
[Bitcoin futures at 3:38 p.m., 2-hour bars, with volume]
What does Elliott wave theory say? The rise since January 27 is wave 5 of Minuette degree, and the push up since February 10 is wave 5 of Subminuette degrees. Fifth waves have five waves internally. I count Subminuette 5 as being in its 3rd wave, which will be followed by a shallow downward correction, and a final push to the upside as the final wave within Subminuette 5.
Half an hour before the closing bell. The S&P 500 traded in a narrow range during the day, remaining above its morning low of 3896.50. I’ve updated the short-term chart below.
10:25 a.m. New York time
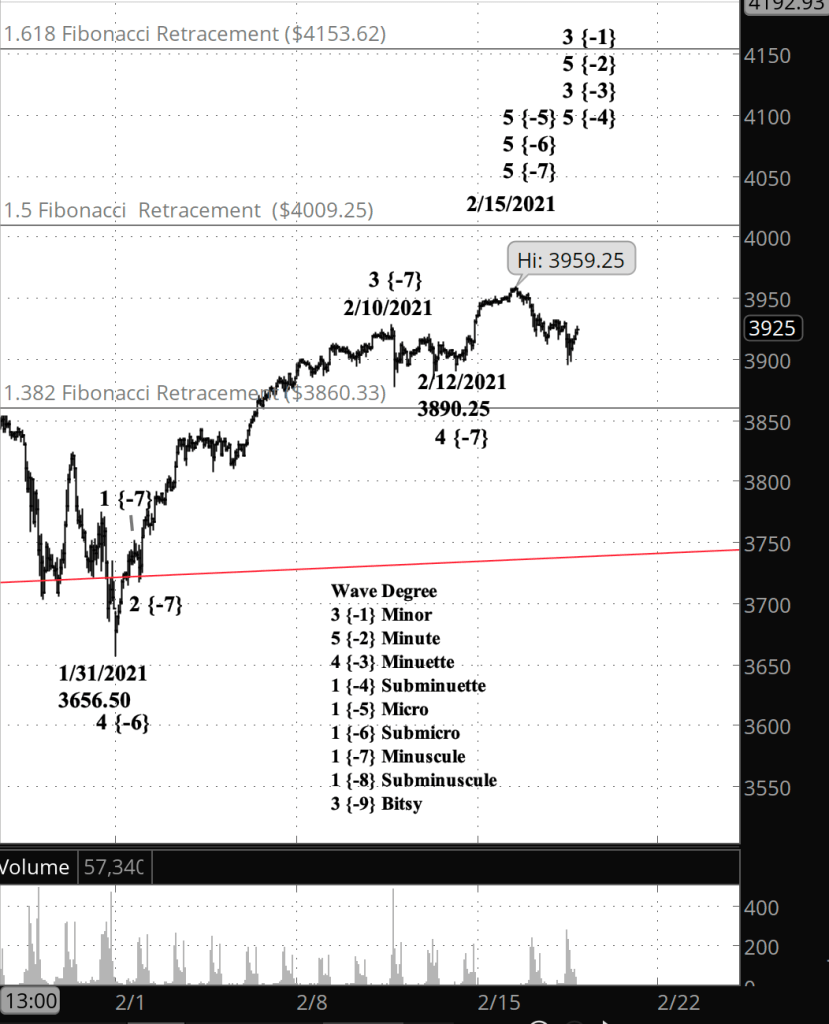
What’s happening now? The S&P 500 E-mini futures continued to decline from their February 15 peak of 3959.25 and had fallen nearly 63 points by the opening bell, to 3896.50.
What does it mean? The decline reinforces the conclusion that the rise that January 31, from 3656.50, ended with the February 15 peak. A move below 3890.25, the February 12 low from which the final rise within the larger rise began, would further reinforce that conclusion. If the rise from January 31 has indeed ended, then a major uptrend that began in February 2020, from 2191,86, has ended, and we can expect prices eventually to work their way down to the 2100s and below.
What are the alternatives? Although the rise from late January has met all of the requirements for completion, it’s possible that the current decline is a temporary pullback before the price resumes its rise, to higher highs.
[S&P 500 E-mini futures at 3:30 p.m., hourly bars, with volume]
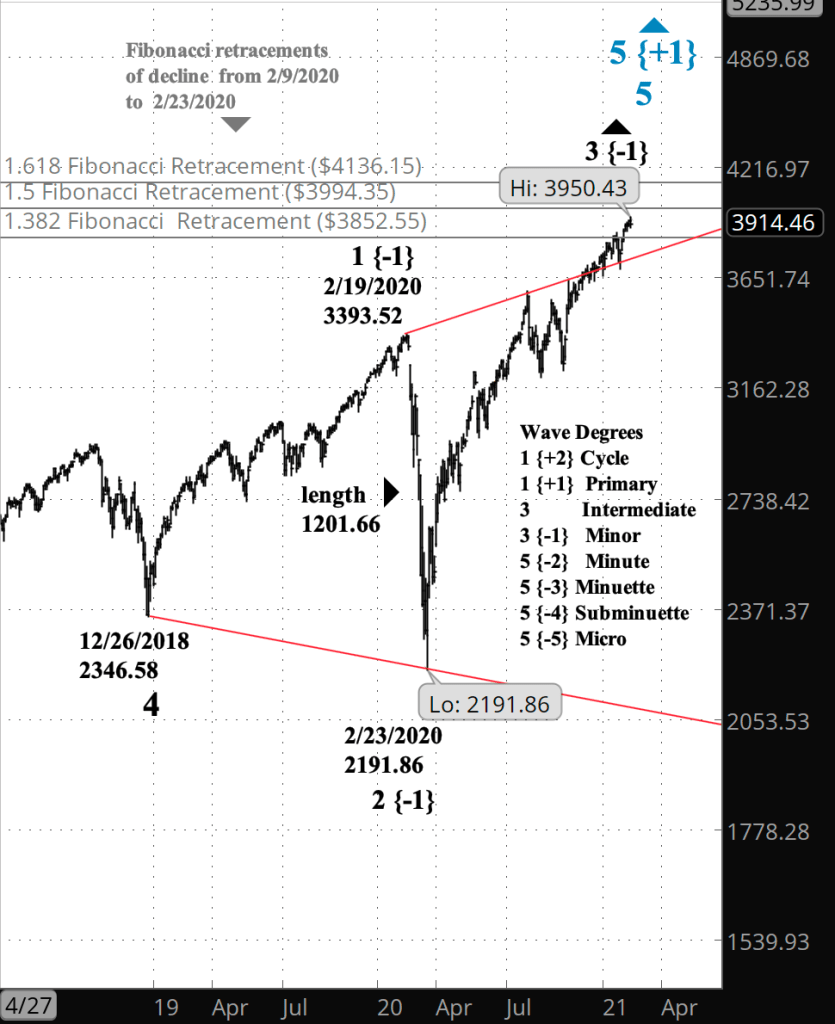
What does Elliott wave theory say? The decline from February 15 is in a very early, very low degree 1st wave, perhaps Subminuscule, perhaps even lower. It will be impossible to define the degree until there’s more context. It’s still very early days, as the long-term chart below of the S&P 500 index shows. At this scale, the decline since Monday isn’t even visible.
[S&P 500 index at 10:47 a.m., 2-day bars]
The large scale chart of the S&P 500 index shows that the peak of February 15 had pushed above the upper boundary of an expanding triangle that began in December 2018 from 2346.58. The “expanding” means that the boundaries of the triangle grow further apart over time, so the price can be expected to move below the prior low, 2191.86.
The February 15 high, wave 3 of primary degree, will be followed by the 4th wave decline of the same degree down to the lower boundary of the triangle, and then by a large rise back to the upper boundary, the triangle’s 5th and final wave at the Primary degree. It is when the 5th wave ends a new highs that we can mark the end of the triangle and the end of the rise that began in December 2018. The downtrend that will follow the end of Primary 5 will carry significantly below the 2300s.
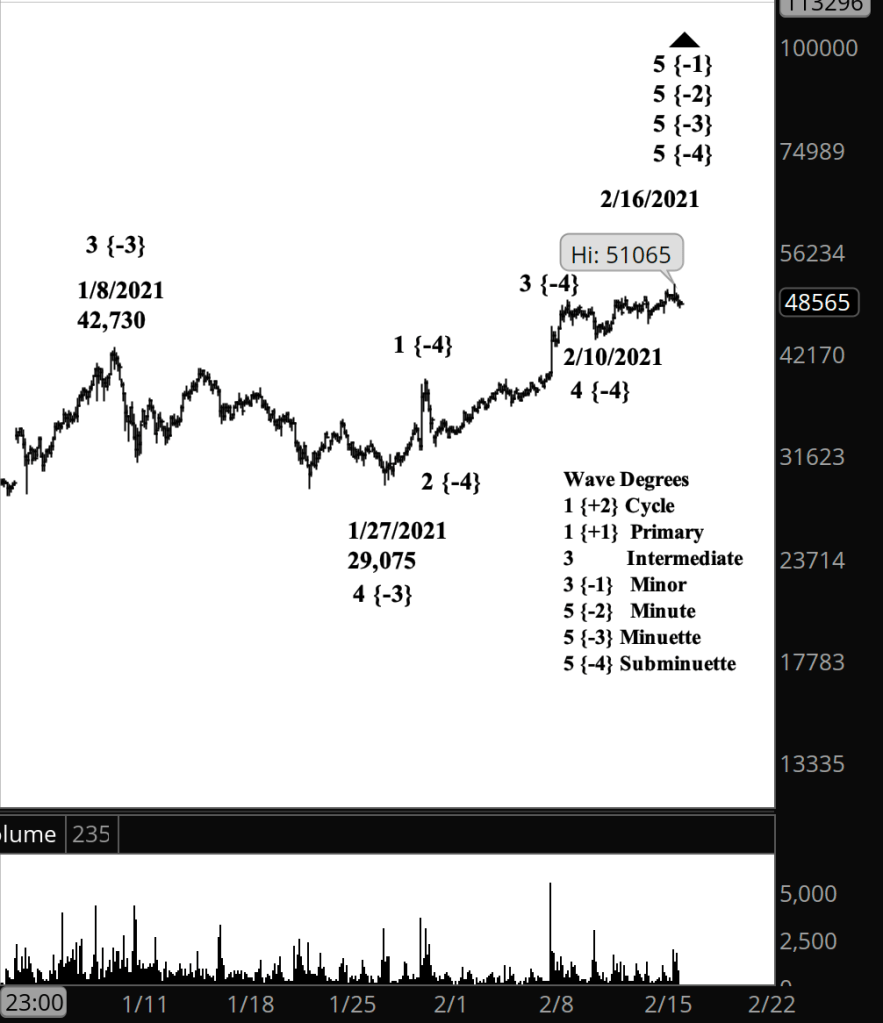
What’s happening now? Bitcoin futures hit a higher high of 51,065 in trading today, continuing the rise that began on January 27 from 29,9075.
What does it mean? The crypto currency is in its final upward push. One that movement is complete, it will begin a decline that is the early stage of a significant decline that will take back much of the rise from March 13, 2020, when the price bottomed out at 4210.
What are the alternatives? The final upward push could continue for a significant distance. It is unrestricted by any rule of Elliott wave analysis. As the baseball great Yogi Berra said, “It ain’t over ’til it’s over.”
[Bitcoin futures at 3:01 p.m., 2-hour bars, with volume]
What does Elliott wave theory say? The rise since January 27, beginning at 29,075, is wave 5 of Minuette degree. Within it, the futures are tracing out wave 5 of Subminuette degree, which began on January 10. The completion of Minuette 5 will also market the completion of wave 5 of a series of parent waves, up to Minor degree, the wave that began on March 13.
The trading history of Bitcoin doesn’t go back far enough to allow for a characterization of the coming decline. Is it the beginning of a new downtrend of Minor degree and its parent Primary degree? Or is it a downward correction within a continuing Primary degree rise? To reach that conclusion we’ll need to understand the pattern of the decline, as set out in the rules of Elliott wave analysis.


You must be logged in to post a comment.