Tuesday, February 16, 2021

3:30 p.m. New York time

Half an hour before the closing bell. The S&P 500 spent the day trading at about the same level it had reached at the opening bell. I’ve updated the chart below.

10:50 a.m. New York time

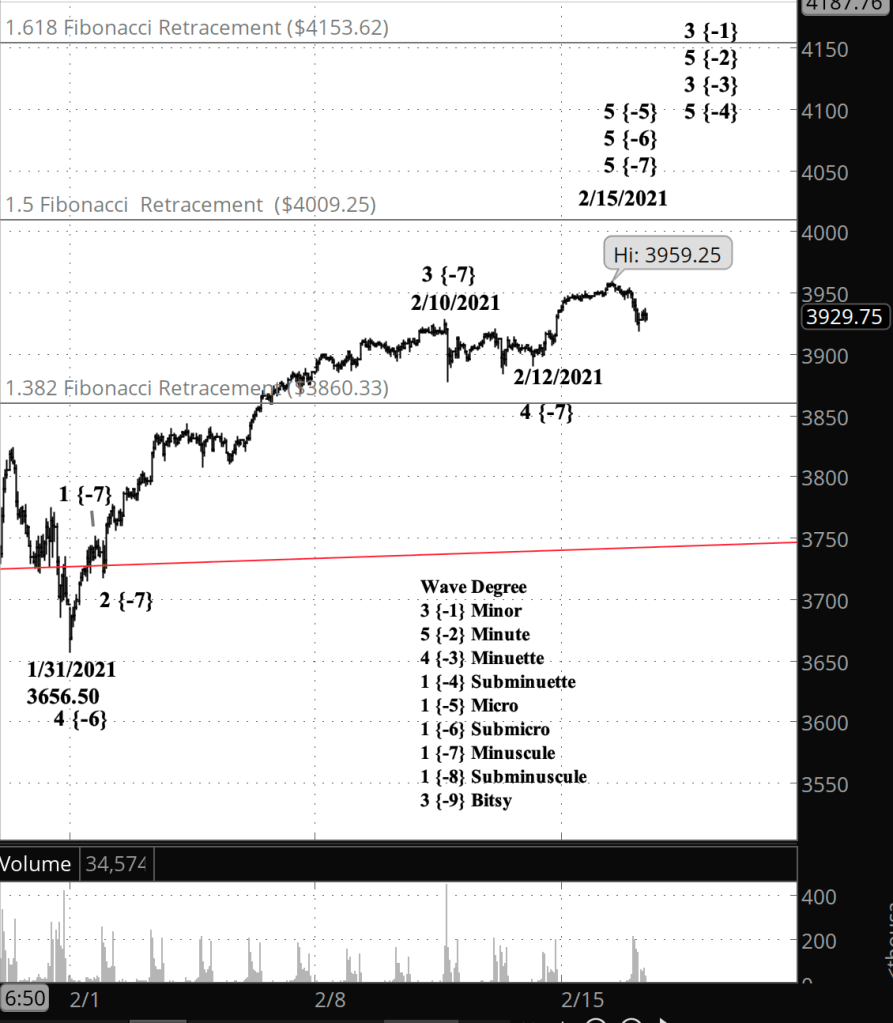
What’s happening now? The S&P 500 E-mini futures his a peak of 3959.25 in late trading Monday night and then began to fall, reaching 27 points below that high in the first hour after the opening bell. The peak on the index is 3950.43.

What does it mean? The decline, slight thought it is, meets the requirements for the first steps down after the rise from 3656.50 beginning January 31. If this principle scenario proves out, the price will decline significantly in the coming weeks and months, eventually reaching into the low 2000s.

What are the alternatives? But, we’ve seen this before with the S&P 500 in recent weeks: A high that has met all of the requirements for the end of the rise since January, a pullback, and then resumption of the rise to higher high. I’ve marked the chart according to the principle analysis, but I take this alternate scenario quite seriously. If the alternate proves out, then we’ll have a slight pullback, and then a push upward to a new high. What both scenarios agree on is that the rise from January 31, and indeed from February 23 of last year, when the price reversed from its low of 2191.86 on the index, and then carried up to where we are today, is in its last leg up and will be followed by a significant decline.
[S&P 500 E-mini futures at 3:30 p.m., 50-minute bars, with volume]

What does Elliott wave theory say? The rise from January 31 is wave 5 of Minuscule degree. I find 5th waves to be among the most ambiguous. It’s hard to call the end until the next wave is well underway. One reason is because 5th waves can extend for quite a distance before completion. Another is that a 5th wave can take a the form of a triangle rather than the standard five-wave pattern. A third reason is that if the preceding 3rd wave is longer than the 1st wave, as is normally the case, then the 5th wave has no limit in Elliott on how far it go, nor on how short it can be.

There’s a lot at stake with the end of this very low level 5th wave at the Minuscule degree, because its completion marks the end of 5th wave of larger degree, all the way up to Subminuette, the end of the 3rd wave of Minuette degree, and the end of the 3rd wave of Minor degree, that last degree having begun a year ago.

Read More »
Bitcoin Analysis

1:40 p.m. New York time

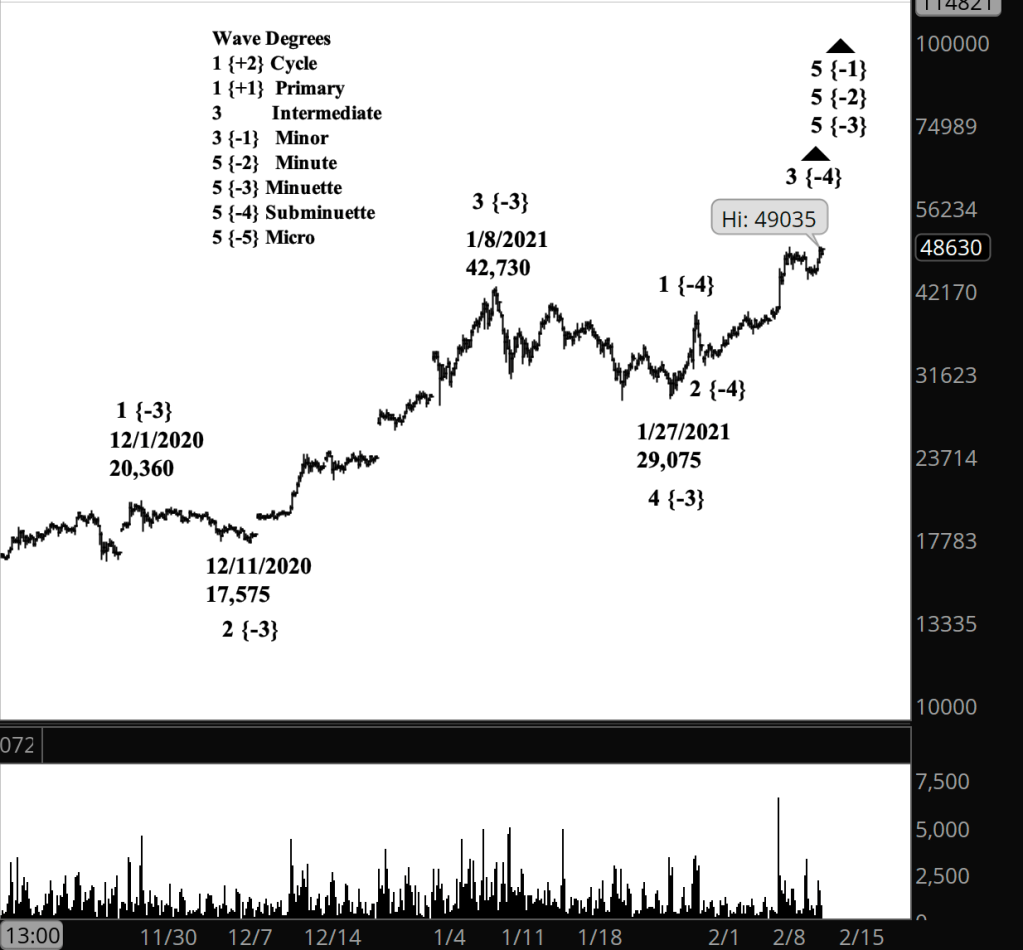
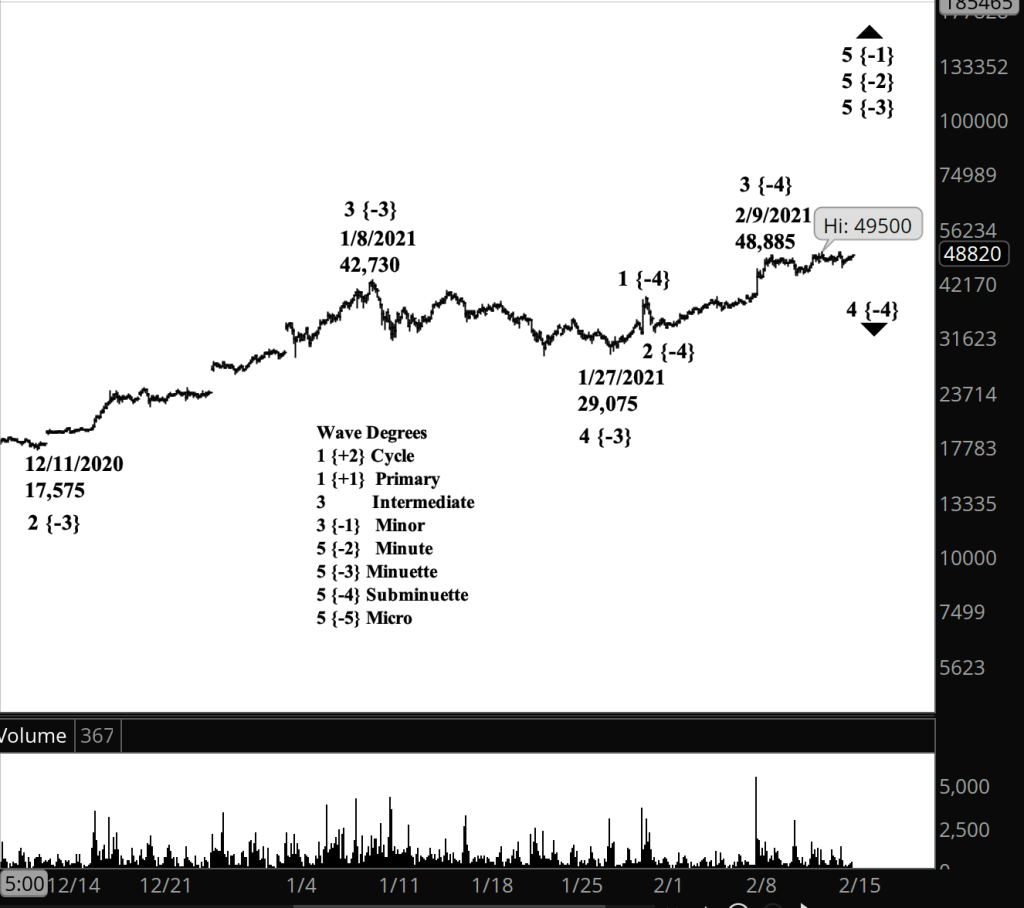
What’s happening now? U.S. markets are closed for the President’s Day holiday. However, Bitcoin futures traded overnight within a narrow range that has not yet challenged Thursday’s high of 49,500.

What does it mean? The middle wave of the rise since January 27 continues, internally tracing a shallow correction before rising to a new high.

What are the alternatives? The correction under Elliott’s rules could have ended on February 9. If so, Thursday’s high is an interim spot in a final push to the upside. Given the form of the chart, I think the alternative is less likely.

[Bitcoin futures at 1:37 p.m., 2-hour bars, with volulme]

What does Elliott wave theory say? The rise since January 27 is wave 5 of Minuette degree, and internally, my principal count is that the high of February 9 is the end of wave 3 of Subminuette degree and the beginning of a Subminuette 4th wave correction.

Read More »

Monday, February 15, 2021

10:25 a.m. New York time

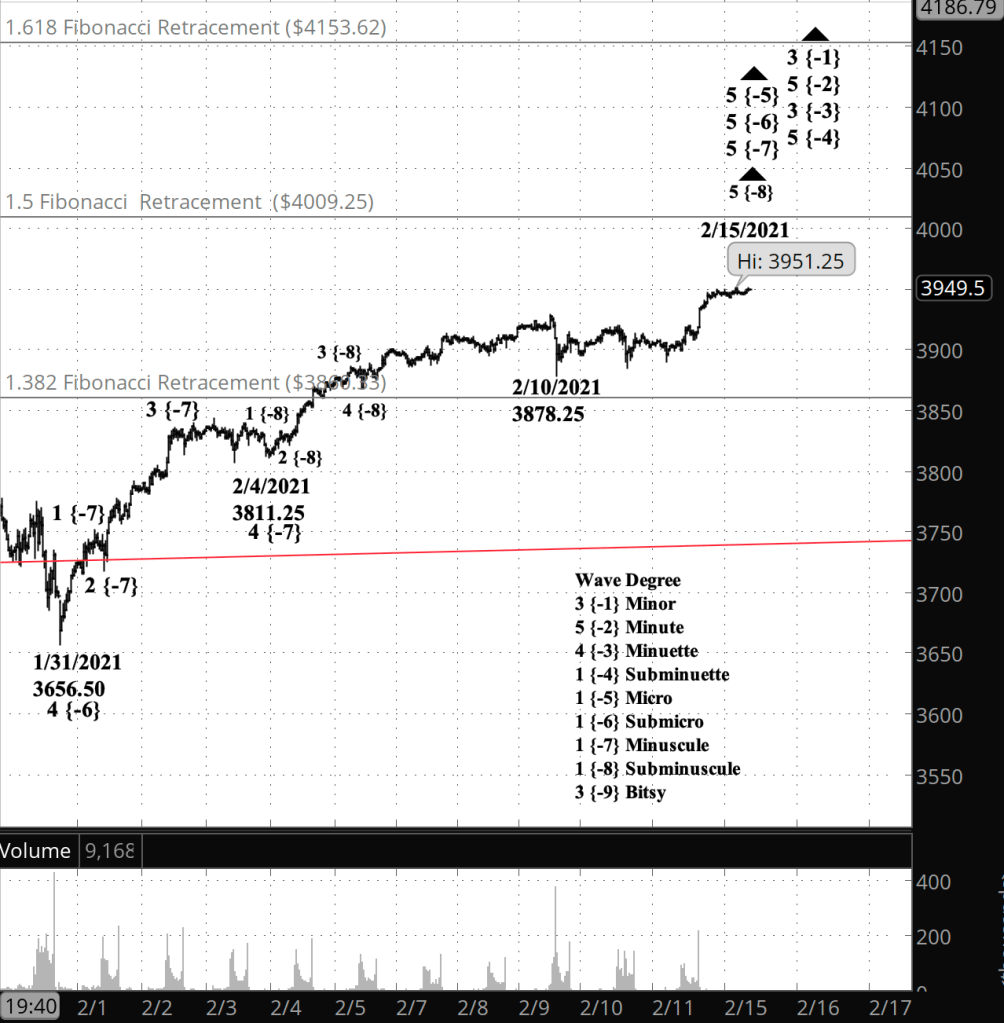
What’s happening now? U.S. markets are closed for the President’s Day holiday. However, the S&P 500 E-mini futures are trading and moved to a new high overnight, 3951.25, which is 16 points above Friday’s high. The holiday session traded in a very narrow range after rising to that higher level.

What does it mean? The uptrend that began on January 31, from 3656.50, is still underway. The most recent high is 58 points below the next Fibonacci level retracing the large decline of February 2020. That 1.50 Fibonacci level is a not-entirely-reliable price target for the end of the uptrend Once the uptrend is complete, it will reverse in to the early stages of a significant downtrend.

What are the alternatives? The uptrend is in its final stage, but it could very well extend to well beyond the Fibonacci target level. Or it could reverse tomorrow and start the downward journey. At this point there’s no sure to way to tell.

[S&P 500 E-mini futures at 10:22 a.m., 35-minute bars, with volume]

What does Elliott wave theory say? The final wave of a movement in the direction of a trend is the 5th wave. In this case, the 5th wave of Subminuscule degree is nested within a series increasingly larger 5th wave degrees stretching up four levels to wave 5 of Subminuette degree. So the end of Subminuscule 5 will trigger an avalanche of wave 5 completions. This illustrates the fractal nature of the markets.

Read More »

Bitcoin Analysis

3:20 p.m. New York time

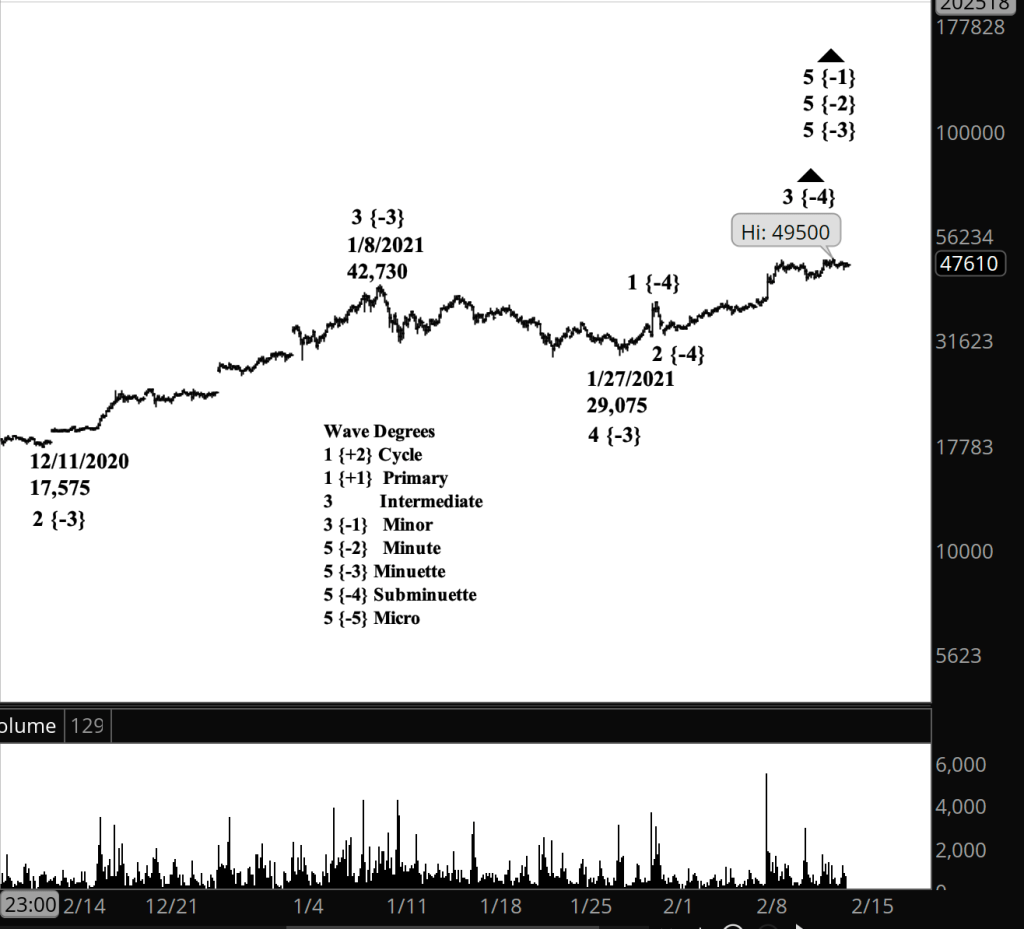
What’s happening now? Bitcoin remained below yesterday’s high, 49,500, staying within 3000 points of that peak.

What does it mean? The high is part of the middle wave of a rise that began January 27 from 29,075. The middle wave will be followed by a shallow pullback, and then a push to a new high. The middle wave will be followed by a shallow pullback and then a final push to the upside.

What are the alternatives? The middle wave could be complete at 29,075, although nothing in my analysis requires that the price won’t continue to rise before the middle wave is complete.

[Bitcoin futures at 3:30 p.m., 2-hour bars, with volume]

What does Elliott wave theory say? The present rise is wave 3 of Subminuette degree. Elliott’s rules require that the 3rd wave not be the short of three waves in the direction of the trend. Subminuette 3 is already longer than it’s 1st wave counterpart, and so there are nothing in Elliott that requires the wave to continue rising, nor anything that precludes a continued rise.

Subminuette 3 will be followed by a correction, wave 4 of Subminuette degree, and then a final 5th wave to the upside. Fifth waves can be short, over quickly, or can extend for a significant distance to the upside. It’s impossible to say at this point which scenario will play out.

Read More »

Friday, February 12, 2021

4:30 p.m. New York time

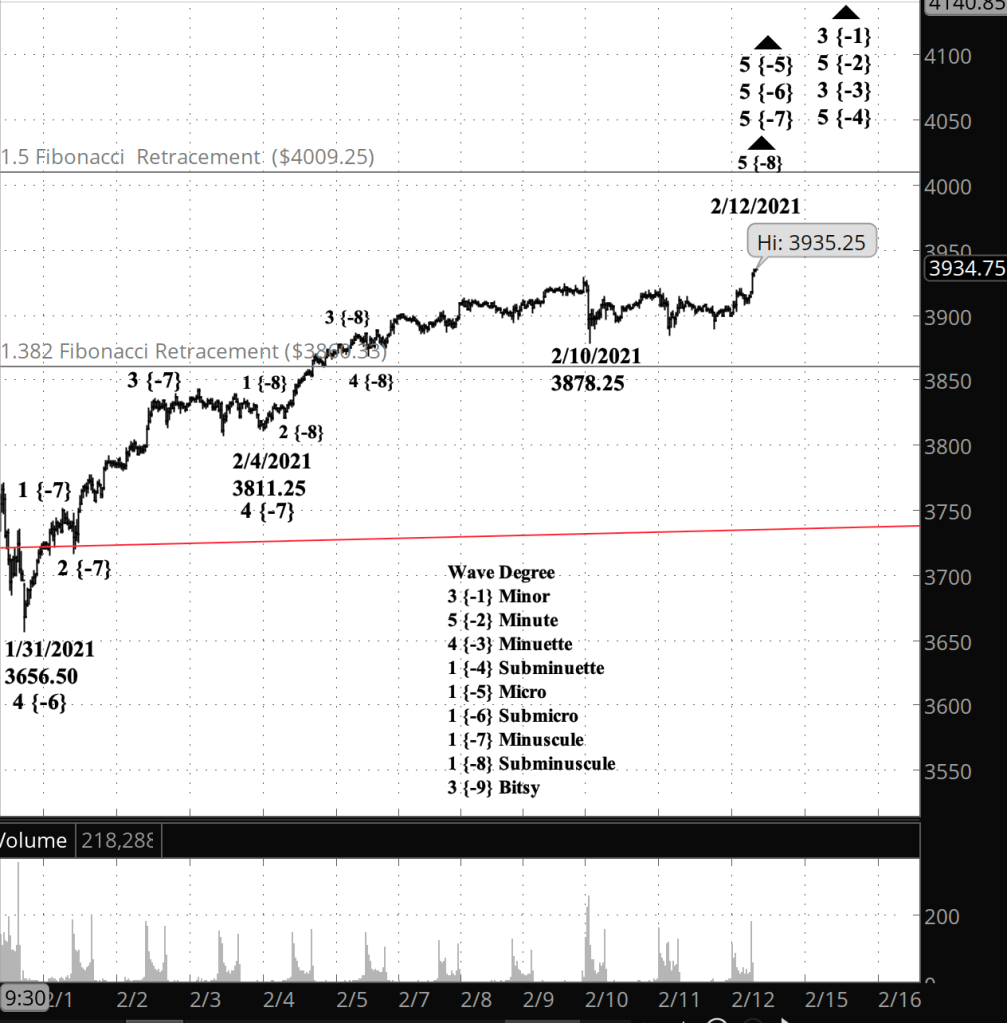
After the closing bell. A rapid rise in the last 20 minutes of trading carried the S&P 500 to a new high, 3935.25 on the futures and 3937.23 on the index, refuting my principle analysis and confirming the alternative. The rise that began January 31 is still underway. I’ve updated the chart.

3:30 p.m. New York time

Half an hour before the closing bell. The S&P 500 traded close to its opening price throughout the day. I’ve updated the chart.

9:35 a.m. New York time

What’s happening now? The S&P 500 E-mini futures continued to trade around 25-30 points below the high of 3928.50 attained on February 10. The equivalent high on the index is 3931.50.

What does it mean? My analysis is unchanged from yesterday. The February 10 peak was the end of the rise from January 31, and subsequent so-far-shallow decline is the first steps toward what will turn into a significant downtrend.

What are the alternatives? Although the February 10 peak satisfies all requirements in Elliott for completion of the rise, it is possible that there will be a final bump upward before the downtrend begins.

[S&P 500 E-mini futures at 4:30 p.m., 30-minute bars, with volume]

What does Elliott wave theory say? The decline so far is wave 1 of Subminuette degree, perhaps. I always find it impossible in the early stages of a trend change to determine precisely which degree I’m tracking. The decline so far lacks context.

The high of February 10 marked the endpoint of wave 5 of Submicro degree and cascades up the parent waves to wave 5 of Subminuette degree, which began December 21, 2020 from 3596. Up one degree, it is the end of wave 3 of Minuette degree, which began November 12, 2020 from 3525.50.

Read More »

Bitcoin Analysis

3:20 p.m. New York time

What’s happening now? Bitcoin futures rose slightly to a new high as it continued a sideways pause that began December 8.

What does it mean? By my primary count, the price is continuing an upward movement within a late-stage uptrend that began March 13, 2020 from 4,210. It has just completed a shallow correction before the final upward push.

What are the alternatives? The rise has met the requirements of that final upward push. However, there is nothing in Elliott wave analysis that requires the final upward move to be truncated. Often such movements can cover a large distance.

[Bitcoin futures at 3:21 p.m., 3-hour bars, with volume]

What does Elliott wave theory say? Today’s high is within wave 3 of Subminuette degree within wave 5 of Minuette degree. The completion of Minuette 5 will cascade up the degrees and will mark the end of wave 5 of Minor degree, which began April 13, 2020.

Fifth waves can be truncated under Elliott, they can trace the normal five waves in the direction of the trend, or they can extend for a large distance. There is no way to know for sure at this point which sort of 5th wave is in the cards.

Read More »

Thursday, February 11, 2021

3:30 p.m. New York time

Half an hour before the closing bell. The S&P 500 continued small-degree movements during the day. This morning’s analysis stands. I’ve update the chart below.

9:35 a.m. New York time

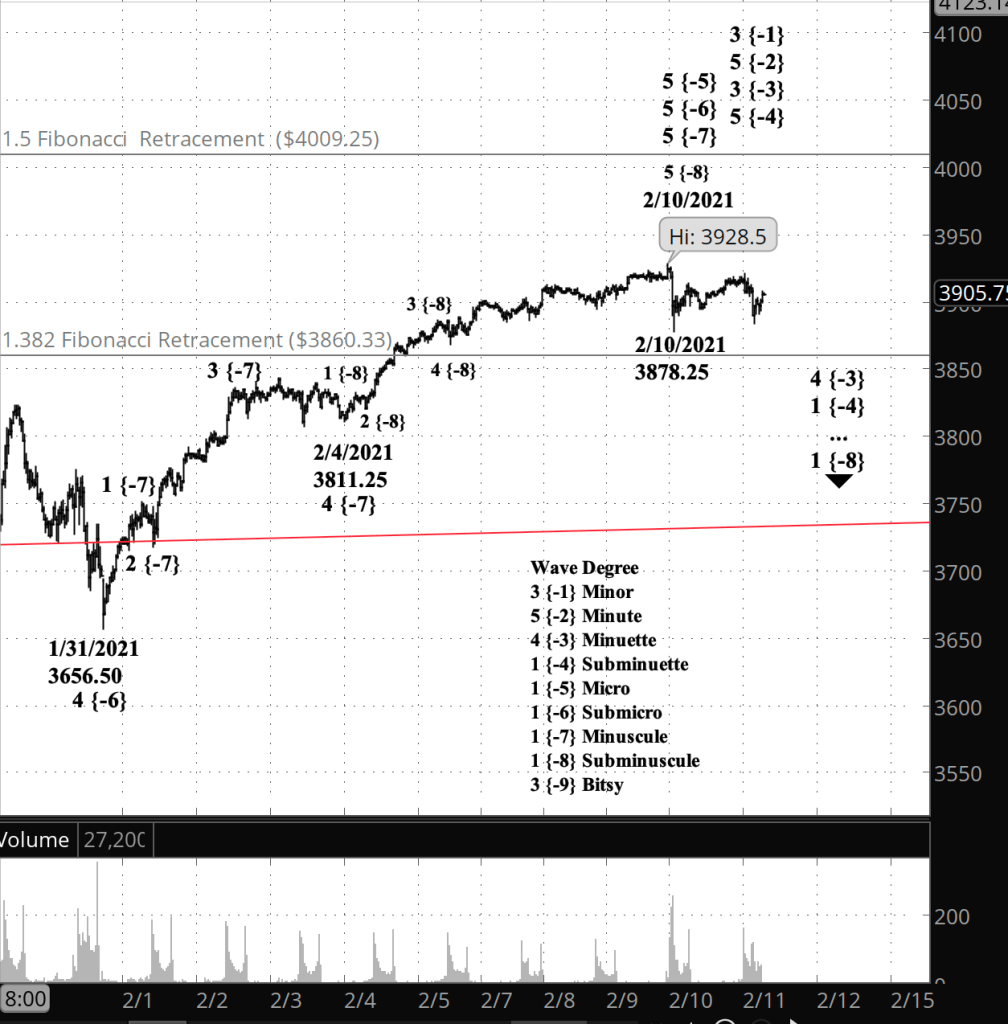
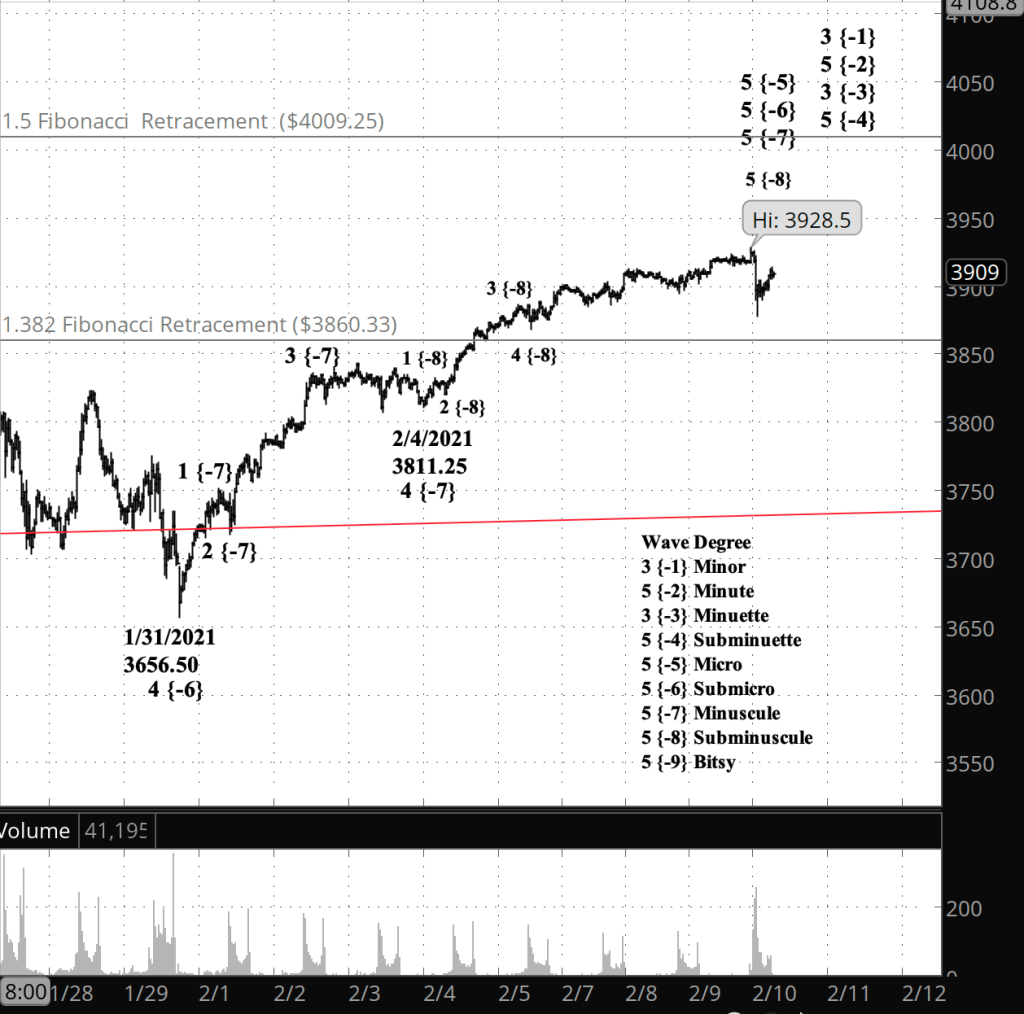
What’s happening now? The S&P 500 E-mini futures rose from its February 10 low, 3878.25, and at the opening bell was trading at 3916.25, which is 12.5 points below the February 10 high, 3928.50.

What does it mean? By my principle count, the February 10 high ended the rise from January 31, and the subsequent decline and bounce are the early steps in a downtrend that will correct that rise and eventually far larger uptrends. In other words, it’s a big deal for traders.

What are the alternatives? If the price remains below 3928.50, then principle count stands. If it moves above, then the rise from the end of January is still underway and the downtrend has not yet begun.

(Another giant chart, as the WordPress editor’s resizing function fails.)

[S&P 500 E-mini futures at 3:30 p.m., 30-minute bars, with volume]

What does Elliott wave theory say? Under the principle count, the February 10 high completes the 5th wave of Subminuscule degree, and cascades up through the parent waves to a completion of wave 5 of Subminuette degree, wave 3 of Minuette degree, wave 5 of Minute degree and wave 3 of Minor degree. The decline that began yesterday is the beginning of wave 1 of a very small degree, the first building block of what will be a major decline.

Under the alternative count, the decline is a low-degree correction within wave 5 of Subminuscule degree as the uptrend continues.

Read More »

Bitcoin Analysis

9:50 a.m. New York time

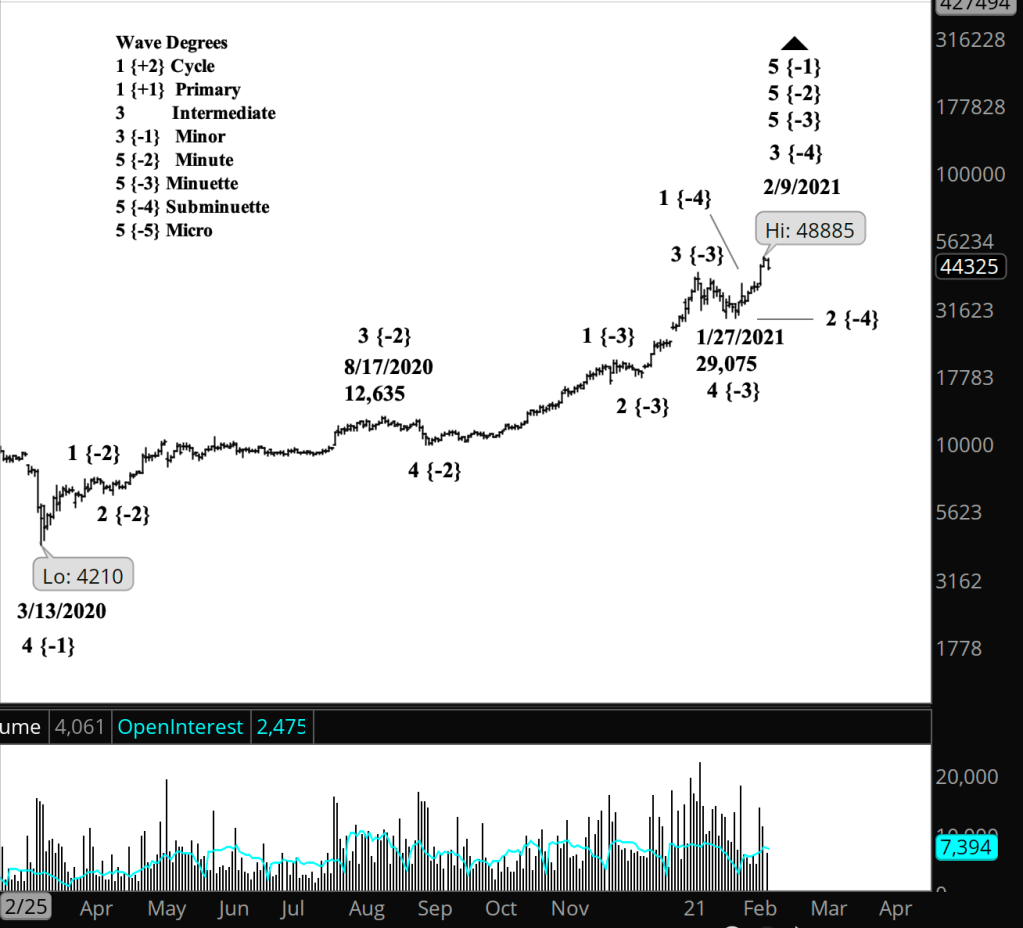
What’s happening now? Bitcoin futures reached a higher high of 48,885 on February 9 and then pulled back. A trader I admire today suggested that the high was a signal to buy Bitcoin.

What does it mean? Bitcoin has been in an uptrend since January 27, from 29,075, a 68% rise in 13 days. By my count the uptrend is present in its middle stages, meaning there is a, probably shallow, correction ahead, followed by a push to higher highs. Once that rise is complete, it will mark the beginning of a significant decline, correcting the rise from March 13, from 4210.

What are the alternatives? Elliott wave counts are often ambiguous. It’s possible that today’s high is the end of the rise and the beginning of the correction, although by my count that’s not the case.

[Bitcoin futures at 9:46 a.m., daily bars, with volume]

What does Elliott wave theory say? By my principle count, Bitcoin is in wave 3 of Subminuette degree within wave 5 of Minuette degree within wave 5 of Minute degree. All of that is unfolding within wave 5 of Minor degree, which began on March 13, 2020.

So is the trader I admire right? I never recommend trades and am not doing so here. However, for an active trader interested in short-term results and nimble at making exit calls, 5th waves can be great opportunities. They sometimes extend for quite a long time. Under the rules of Elliott wave analysis, a 3rd wave can’t be shortest wave of the three waves moving in the direction of the trend (1st, 3rd and 5th). Wave 3 of Minute degree is already longer than Minute wave 1, so with Minute wave 5, in theory, the sky is the limit.

Or not. Minor wave 5 could be a truncated stump of a wave, and the correction could begin within a few days. Elliott wave analysis isn’t a prediction tool. It provides “You Are Here” marker and assesses the possible moves that lie ahead. Useful information, but anyone looking for predictions would do better to buy a crystal ball.

Read More »

Wednesday, February 10, 2021

3:30 p.m. New York time

Half an hour before the closing bell. The S&P 500 fell quickly in the morning, falling 50 points to 3878.25 in 15 minutes of trading. That movement strengthens the case for the principle analysis. Chart updated.

9:40 a.m. New York time

What’s happening now? The S&P 500 E-mini futures shot up to a higher high of 3928.50 in the hour before the opening bell. The price had moved above yesterday’s high in a sideways movement but rose to that new high in four minutes of trading before the index opened.

What does it mean? The rise from January 31 continued after yesterday’s pullback, a scenario described in yesterday’s alternate analysis. When the rise is complete, the S&P 500 will reverse into a downtrend that will eventually drain the optimism from the marketplace. The brevity of the upward at 8:30 a.m. New York time suggests the possibility of an exhaustion move, a sudden move in the direction of the trend that marks its end.

What are the alternatives? The principle and alternate analyses are the same as yesterday. Principle: The higher high marks the end of the upward trend. Secondary: A retracement before the upward trend continues.

(Once again the WordPress editor refuses to size charts properly. So, big chart.)

[S&P 500 E-mini futures at 3:32 p.m. New York time, 30-minute bars, with volume]

What does Elliott wave theory say? The 8:30 a.m. spike under my principle analysis completes wave 5 of Subminuscule degree within wave 5 of Minuscule degree, and 5th waves up to Minute degree, which is one degree lower than wave 3 of Minor degree. However, there is nothing in Elliott that guarantees that Subminuscule 5 is complete, and also doesn’t guarantee that it’s not yet complete. Ambiguity rules.

Read More »

Wednesday, February 9, 2021

An earlier version of this post, published prematurely, showed an incomplete analysis that differs significantly in its conclusions from this final version.

3:30 p.m. New York time

Half an hour before the closing bell. The S&P 500 rose to 3912.25 on the futures, two points below the overnight high. If it remains below that high, then the primary analysis prevails. If it moves above that high, then the alternative analysis prevails. I’ve updated the chart below.

10:20 a.m. New York time

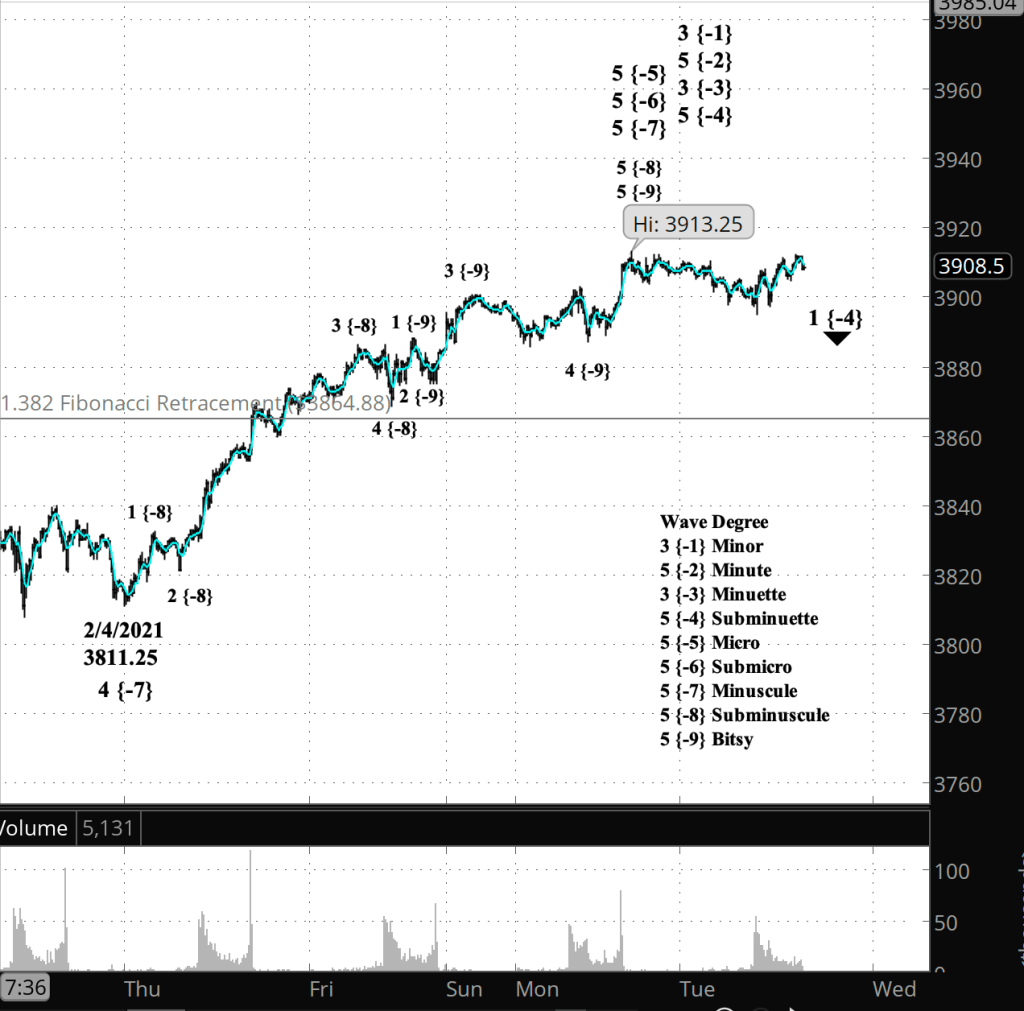
What’s happening now? The S&P 500 E-mini futures stretched up to a higher high in overnight trading, 3913.25 on the futures and 3915.77 on the index.

What does it mean? I see the high as having completed the final wave of the five waves in a movement in the direction of the trend. The completion of the rise will cascade up the degrees and will initiate a significant deadline in price.

What are the alternatives? Market movements are often (usually?) ambiguous, and today’s new high is no exception. The final wave may be extending, leading to still higher highs before it is complete.

[S&P 500 E-mini futures at 3:30 p.m., 12-minute bars, with volume]

What does Elliott wave theory say? I’ve superimposed a 4-day simple moving average on the chart to smooth out the fluctuations so as to make it easier to pick out the waves of Subminuscule degree, marked with the {-8} subscript on the chart. I’ve had to make up a name for waves smaller than Subminuscule and have chosen “Bitsy”, as in the children’s word “itsy-bitsy”. By my count, the overnight high completes wave 5 of Bitsy degree within wave 5 of Subminuscule degree. Under my principle count, the decline that follows is the tentative beginning, not of a correction, but of a new downtrend.

The completion of Bitsy 5 within Subminuscule 5 will trigger completion of the rise all the way up to Subminuette degree, and will be completion of wave 3 of Minuette degree.

Read More »