Half an hour before the closing bell.The S&P 500 moved to a slightly higher high — 3903 on the futures and 3909.92 with 30-minutes left in the regular trading session. It’s low for the day was only 16 points on the futures, 17 points and a fraction on the index. A drowsy day on Wall Street. I’ve updated the chart below.
9:45 a.m. New York time
What’s happening now? The S&P 500 E-mini futures reached a higher high in overnight trading and then pulled back in a shallow, short-term correction. The high is 3900.50 on the futures and 3905.74 on the index.
What does it mean? By my count the S&P 500 has one more push to the upside before the larger trend begins a decline.
What are the alternatives? There’s no built-in limit to the upward move. It could rise quite a distance before the uptrend is exhausted. The excellent pattern recognition software in our brains tend see each higher high as the end of the trend, but it’s not necessarily so.
[S&P 500 E-mini futures at 3:30 p.m., 20-minute bars, with volume]
What does Elliott wave theory say? The last push up to the higher high is a very small level, wave 5 of Subminuscule degree, and internally, one degree lower, I think wave 5 is it’s 4th wave, with a final upward movement ahead.
Working our way up the degree ladder, Subminuscule 5 is a subwave of wave 5 of Minscule degree within wave 5 of Submicro degree within wave 5 of Micro degree within wave 5 of Subminuette degree with wave within wave 3 of Minuette degree. So completion of the tiny wave below Subminuscule, so small a degree that it lacks a name, will trigger completion of a series 5th waves up to Subminuettee degree, which began on December 21.
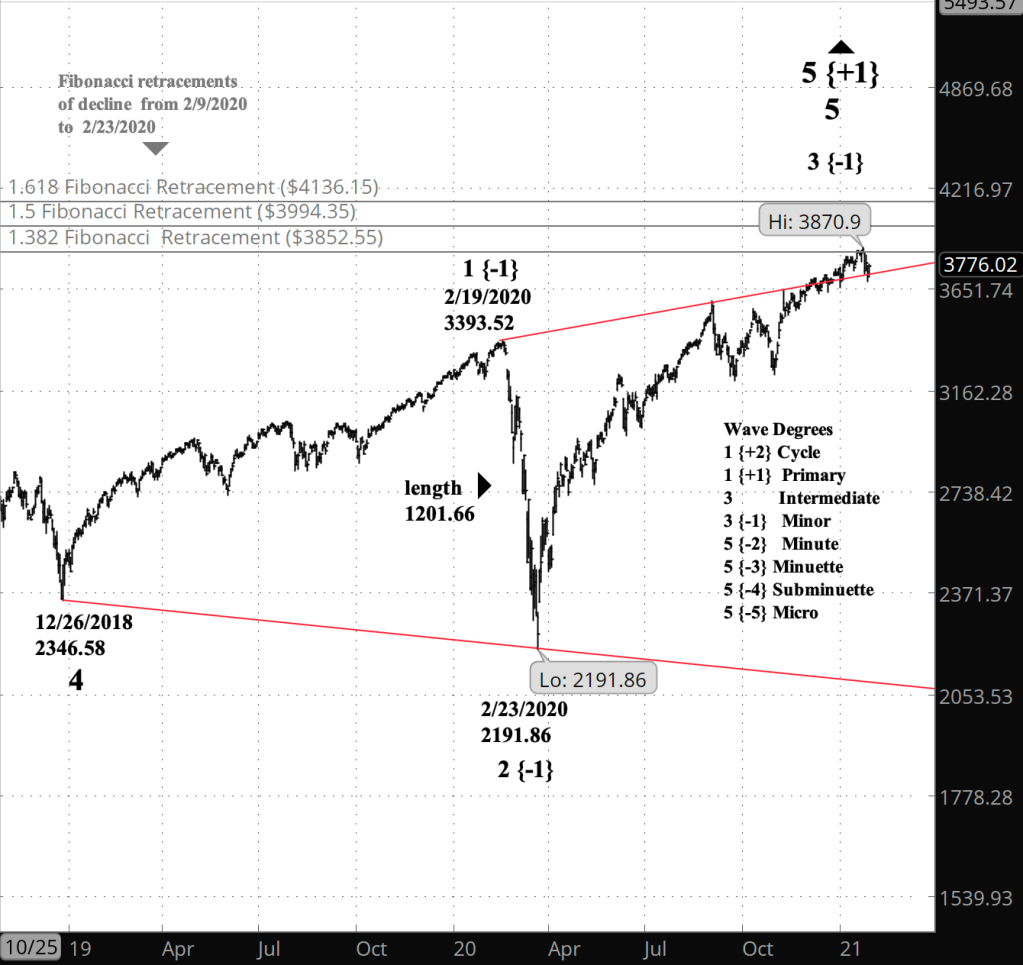
Half an hour before the closing bell. The S&P 500 rose a bit higher, to 3888.25 on the futures, 3894.56 on the index. I’ve updated the shorter-term chart posted this morning, and am adding, here, a longer-term chart showing the full Diagonal triangle that began in December 2018.
[S&P 500 index at 3:26 a.m., daily bars]
10:15 a.m. New York time
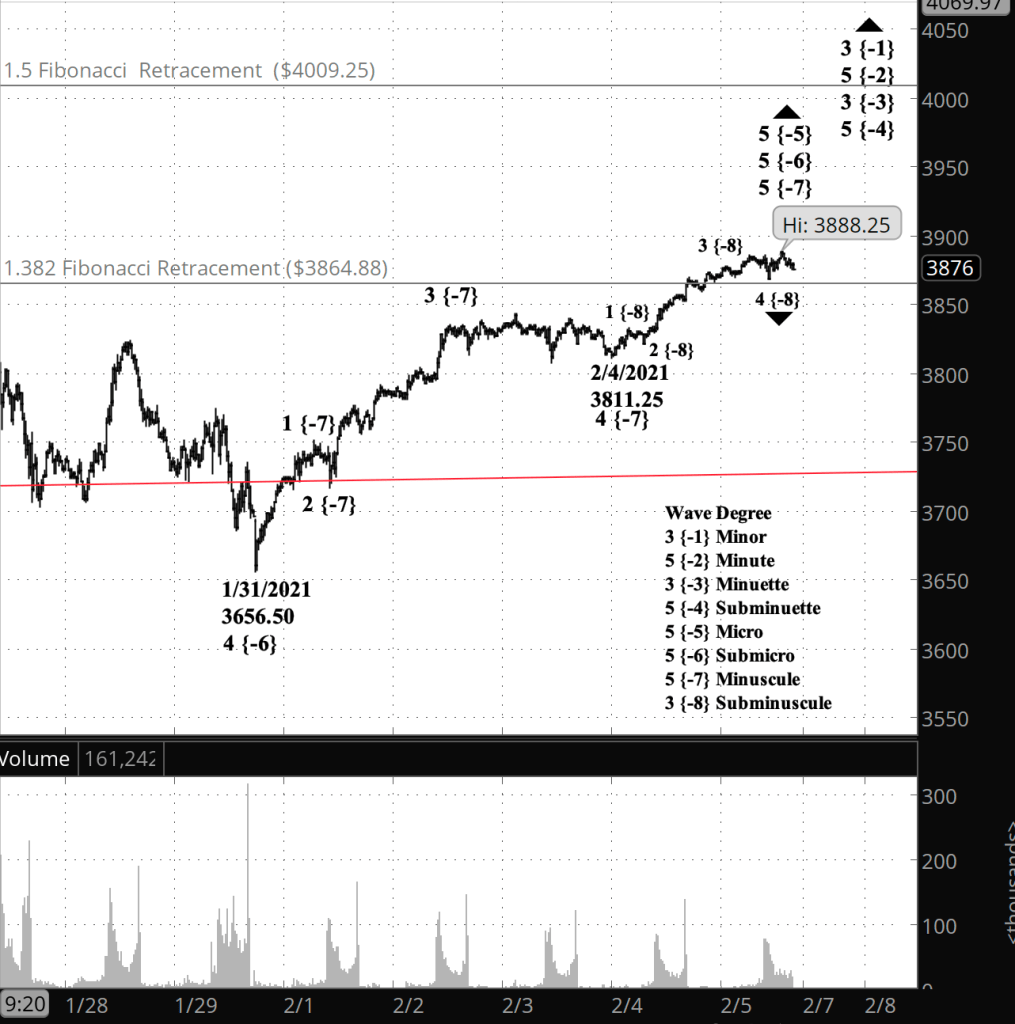
What’s happening now? The S&P 500 E-mini futures continued to rise in overnight trading, piercing the 1.382 Fibonacci retracement of the sharp decline in February 2020. The highest level so far today is 3886.25.
What does it mean? The rise by my count is final movement in the low-level uptrend that began on January 21 from 3656.50.
What are the alternatives? The alternatives lie in the question, how far along is the rise that began February 4, the beginning of the present very low level movement. By my count it is midway through the rise, but other counts are defensible. So there’s some ambiguity in the chart.
Trading strategy. My short iron condor position on IWM has followed the S&P 500, rising sharply and moving above the upper boundary of my profit zone, at 220. The position is three weeks away from mandatory exit under my rules, which happens 21 days before expiration. I’ll wait a bit in the hope of gaining greater clarity as to the extent of the rise.
[S&P 500 E-mini futures at 3:30 p.m., 20-minute bars, with volume]
What does Elliott wave theory say? I’ll concentrate on the rise since February 4, the beginning of wave 5 of Minuscule degree within wave 5 of Submicro degree … and all the way up to wave 5 of Subminuette degree. The completion of the very low-level 5th wave that began on the February 4 will cascade up the degrees to a turning point of significance to traders.
Internally, I count Minuscule 5 as having completed wave 3 of Subminuscule degree and embarked on wave 4.
One thing to remember is that 5th waves sometimes extend, and that could give the price significant upside, perhaps to the next major Fibonacci retracement level, the 1.5, at 4009.25. More often, however, 5th waves complete their five internal waves and exit the stage.
Submicro wave 5 has taken a day to complete three of its five internal waves.
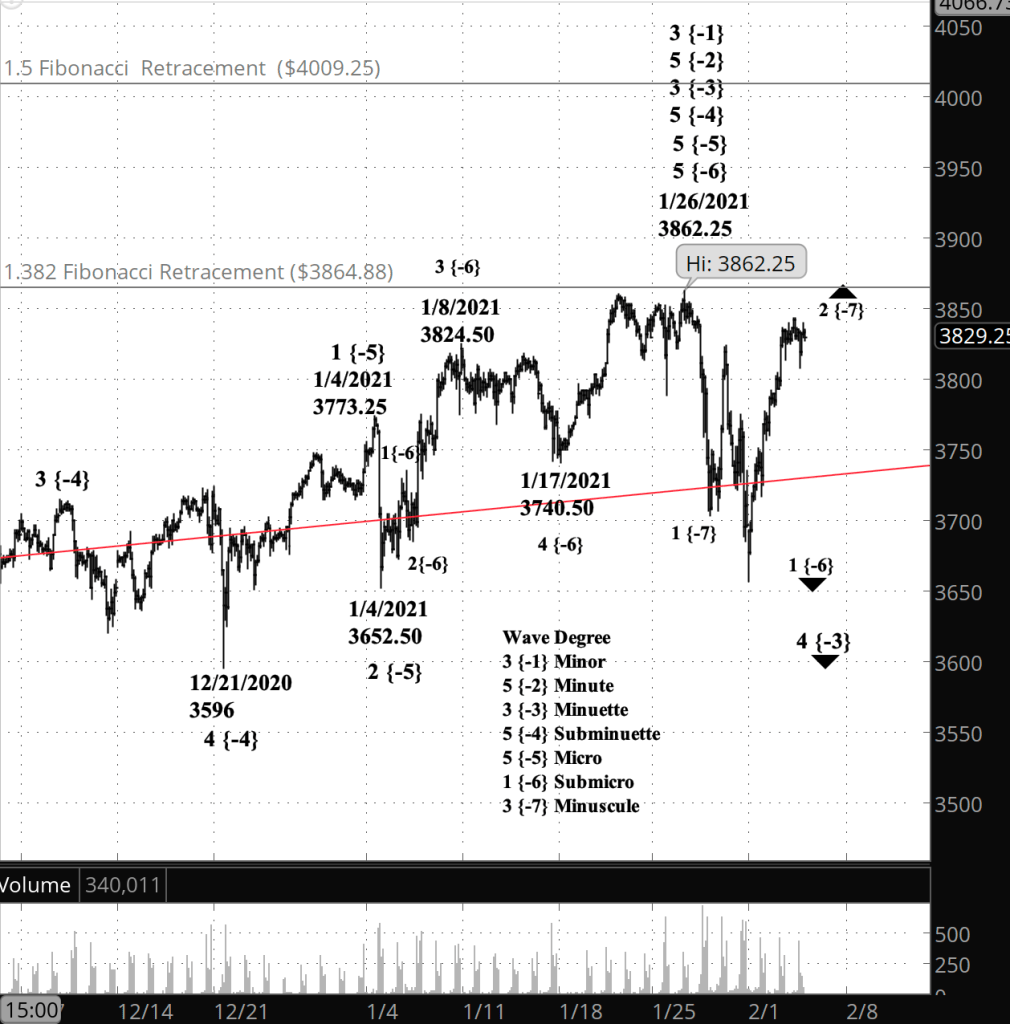
The last half hour. In the last half hour of the regular trading session, the S&P 500 moved to a new high, triggering my alternate analysis. Here’s a chart showing the push up to 3869.75 on the E-mini futures, 3872.42 on the index. I’ve renumbered the waves as follows: The end of wave 4 of Submicro degree moves from January 17 to January 31, and the rise from January 31 is relabelled as wave 5 of Submicro degree, which is still in progress.
[S&P 500 E-mini futures at 4:31 p.m., 2-hour bars, with volume]
3:30 p.m. New York time
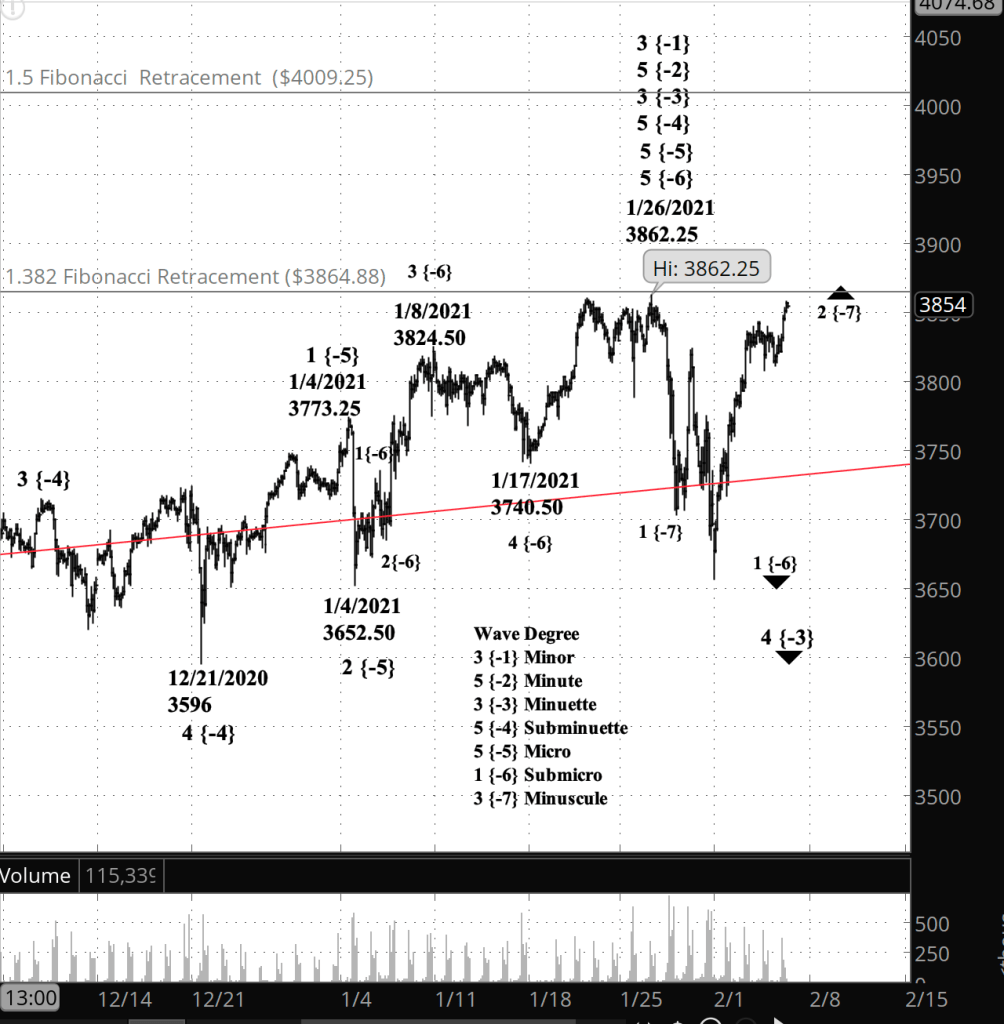
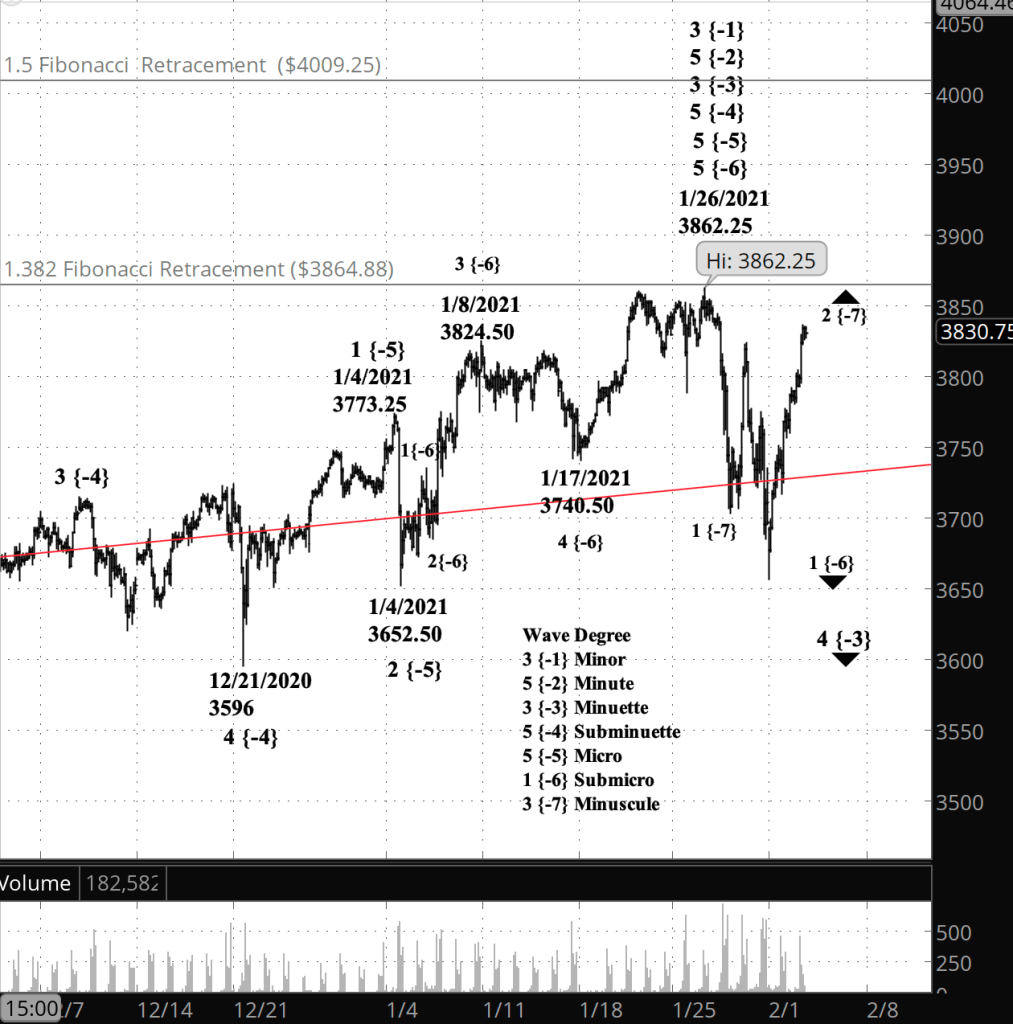
Half an hour before the closing bell. The S&P 500 rose during the regular trading session, reaching a high during the day of 3857.75 on the E-mini futures, 3684.81 on the index.The price in either case remained below the high set on January 26 of 3862.25 on the futures, 3870.90 on the index, and so I continue to count the rise from January 31 as an upward correction within downtrending wave 1 of Submicro degree. I’ve updated the chart.
10 a.m. New York time
What’s happening now? The S&P 500 E-mini futures continued to dawdle along the same levels as yesterday, staying between 3811 and 3841 in overnight trading.
What does it mean? Unchanged from Wednesday: The upward correction that began on January 27 has reached an end, and the next move will be an enthusiastic decline that will carry the price below 3656.
What are the alternatives? Also unchanged: A pause is a balance between buy and sell orders. If the buy side strengthens, then the correction will continue its upward course. A move above 3862.25 on the E-mini futures (3870.90 on the index) would force a re-analysis of the chart.
(The chart below shows the analysis before today’s new high triggered the alternative analysis. See the chart above for the new wave numbering.)
Also, the WordPress image resizing function is still broken, so… giant chart.)
[S&P 500 E-mini futures at 3:30 p.m., 2-hour bars, with volume]
What does Elliott wave theory say? And also unchanged: The present wave is C of Minuscule degree, the final subwave of wave 2 of Submicro degree. If the correction is indeed over, the next move will be wave 3 of Submicro degree, a declining wave in the direction of the trend. Third waves typically are the most powerful of the waves that make up a trending move.
I exited my iron condor options spread position on IWM 15 days before expiration, for a $1.99 credit per contract/share, a profit before fees of $56 per contract. Shares were trading at $213.56, up $1.40 from the entry level. The implied volatility rate stood at 20.1%, 4.1 points below the 24.2% entry rate.
[IWM at 2:04 p.m., 20-minute bars, with volume]
My decision to exit was based on Elliott wave analysis. At entry I had interpreted the chart to mean that price had reached the end of an upward correction — wave 4 of Subminuscule degree — when in fact the price followed an alternate interpretation, that the peak was actually ended the first wave (A) of the rise, The options position grew increasingly less profitable as the price climbed to 226.79, the Subminuscule 4. The price then began to works its way down in a resumption of the main trend, wave 5 of Subminuscule degree. At that point analysis told me the price would become profitable, eventually. The only question was one of timing — would it return to profitability before the options expired, a question of duration upon which Elliott can offer no advice. The position returned to profitability today, as Subminuscule 5 fell sharply, and I exited. The two vertical lines on the chart mark when I entered and when exited.
The position was skewed toward the downside, meaning I had set the upper short strike price at 220, or delta 36, rather than unskewed delta 16, which would have been around 236. Had I built an unskewed structure, the position would have remained profitable throughout. Skewing gave greater potential profit, a necessity to make the trade worthwhile during a low implied volatility period.
Shares rose by 0.7% over 29 days for a 11.3% annual rate. The options position produced a 14.1% return for a 177.1% annual rate.
Update 2/26/2021
This is 20 days prior to options expiration for this short iron condor spread on IWM. By my rules I would normally close the position today. It is unprofitable, although trading within the profit zone, below the short call strike price of 220..
I’ve decided to hedge my rule and hold the position over the weekend, based on Elliott wave analysis. IWM is now in a 4th wave of Subminuscule degree. The 5th wave that will follow shortly will bring the price further down into the profit zone, reducing the cost of exit to profitability. Or so my theory goes.
Here’s the chart, IWM at 2:25 p.m., 5-minute bars, with volume:
Analysis 2/3/2021
I have entered a short iron condor spread on IWM, using options that trade for the last time 44 days hence, on March 19. The premium is a $2.27 credit per contract share and the stock at the time of entry was priced at $212.14.
The implied volatility rank (IVR) stands at 24.2.
Premium:
$2.27
Expire OTM
IWM-iron condor
Strike
Odds
Delta
Long
225.00
76.0%
26
Break-even
222.27
71.5%
31
Short
220.00
67.0%
36
Puts
Short
188.00
81.0%
16
Break-even
185.27
83.0%
14
Long
183.00
85.0%
12
The premium is 45.4% of the width of the position’s wing.
The profit zone covers a 4.8% move to the upside and a 14.5% move to the downside, for a total range of 19.3%.
The risk/reward ratio is 1.2:1, with maximum risk of $273 and maximum reward of $227 per contract.
Strategy. I set the wings of the iron condor based on Elliott wave analysis of the IWM chart, which shows the January 25 high, $217.91, to be the peak of an uptrend, and the subsequent decline to be the beginning of either a new downtrend. I set the short put, the lower boundary of my profit zone, below the end of wave 1 to the downside, at 203.25 set on January 29. The subsequent upward move is a wave 2 correction.
Half an hour before the closing bell. The S&P 500 dropped quickly by 27 points to 3804 in the first hours after the opening bell, and then returned to its overnight range. A small whiff of storm and fury, signifying nothing. I’ve updated the chart below.
10:55 a.m. New York time
I’ve entered a short iron condor position on IWM, with the options expiring March 19, and posted an analysis, IWM Trade.
Note the new titling convention. Going forward I’ll be using “Analysis” in the title when I analyze but don’t trade, as with the recent GME analyses I’ve posted. I’ll be using “Trade” in the title when I enter a position.
9:35 a.m. New York time
What’s happening now? The S&P 500 E-mini futures barely budged overnight, trading within a 20-point range around 3830. The price declined slightly with the opening bell.
What does it mean? The pause suggests that the upward correction that began on January 27 has reached an end, and the next move will be an enthusiastic decline that will carry the price below 3656.
What are the alternatives? A pause is a balance between buy and sell orders. If the buy side strengthens, then the correction will continue its upward course. A move above 3862.25 on the E-mini futures (3870.90 on the index) would force a re-analysis of the chart.
[S&P 500 E-mini futures at 3:30 p.m., 2-hour bars, with volume]
What does Elliott wave theory say? The present wave is C of Minuscule degree, the final subwave of wave 2 of Submicro degree. If the correction is indeed over, the next move will be wave 3 of Submicro degree, a declining wave in the direction of the trend. Third waves typically are the most powerful of the waves that make up a trending move.
My trading strategy. I choose my options trades from among liquid exchange-traded funds having implied volatility ranks of 25 or above. It’s a lower volatility period in the markets, so I have only one choice: SLV with a rank of 41. There has been a sudden upward gap in SLV that has introduced directional uncertainty for the near term, so I’ll focus on the next lower acceptable symbol, IWM, at 24.1 and attempt to build a trade with sufficient potential for profit.
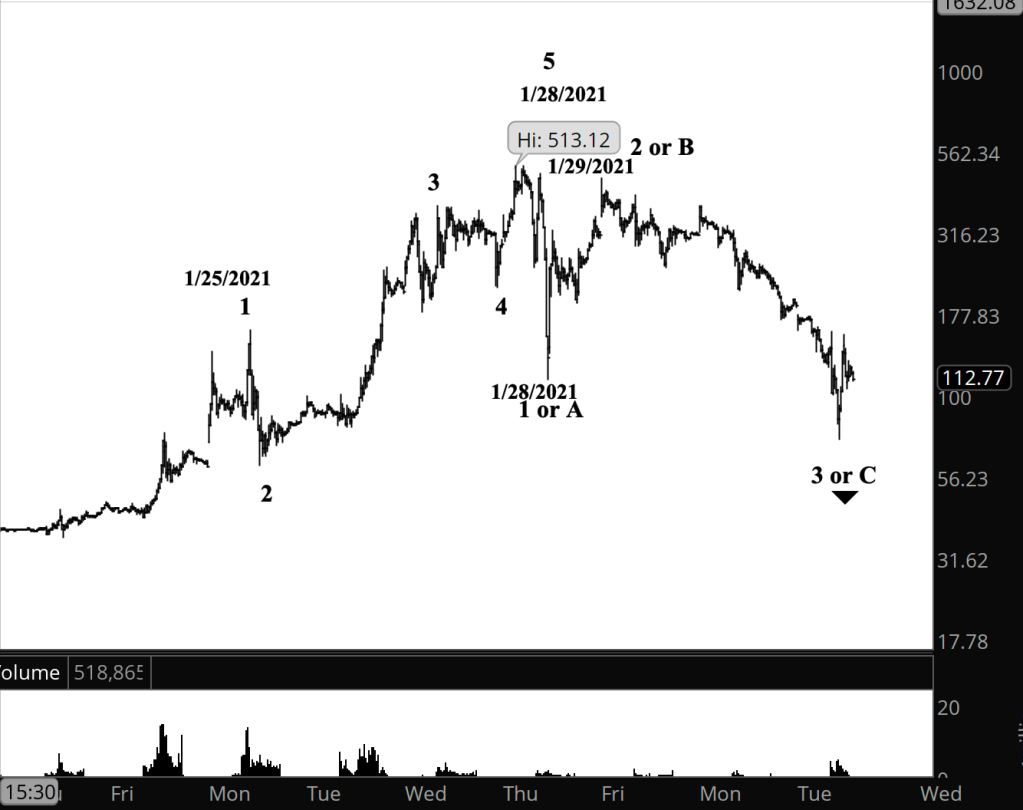
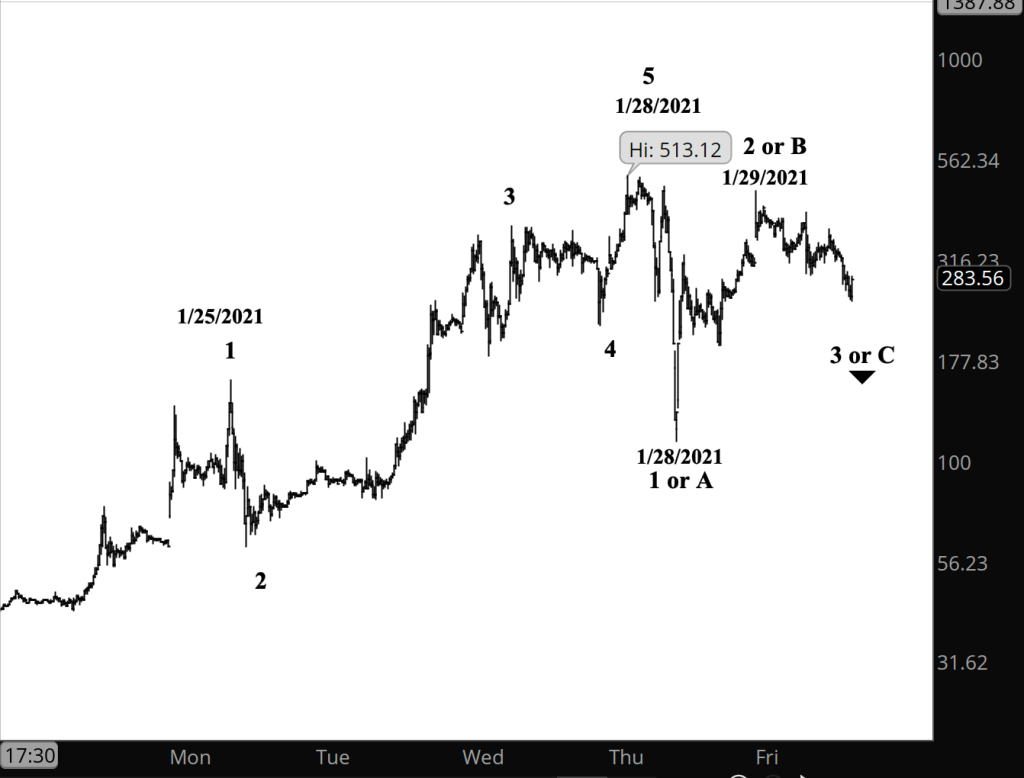
GME has continued its decline from a high of 470 on January 29 and has hit a low of 74.22 so far today. If the price continues to decline, without a significant upward bump, then GME is on a new downtrend. If the price reverses, then either the correction has ended and GME will move to new highs, or the correction is taking a compound form and the net trend will be sideways.
I think the new downtrend scenario is the most likely, given the power of the decline. But there’s nothing in the Elliott wave analysis so far that would make it a certainty.
The Elliott wave analysis shows that GME is in the 3rd wave of its downward movement from its January 28 peak of 513.12. That peak was wave 5 (of indeterminate degree; I haven’t done the degree analysis). The decline that followed is in its 3rd wave, which is either wave 3 of a new decline or wave C of a correction.
The price remains above the previous low, which was 17.05 on January 11.
Half an hour before the closing bell. The S&P 500 hit a high for the day at midday, of 3835.75 on the E-mini futures, and has remained at close to that level up to the present. I’ve updated the chart below.
1:10 p.m.New York time
I’ve posted an Elliott wave analysis of GME. Fun while it lasted.
11 a.m. New York time
What’s happening now? The S&P 500 E-mini futures continued to rise in overnight trading, exceeding the high of January 28 as it continues an upward correction within the downtrend that began on January 26.
What does it mean? The move above the January 28 high eliminates any probability that the correction has been completed. The present rise is most likely the final wave of the correction. It will be followed by a powerful push to the downside.
What are the alternatives? If the price pushes above 3862.25, the high of January 26, then the downtrend is in fact a correction within the uptrend that began on February 23, 2020.
[S&P 500 E-mini futures at 3:30 p.m., 2-hour bars, with volume]
What does Elliott wave theory say? The higher high set in overnight trading is wave C of Subminuscule degree within wave 2 of Minuscule degree. We’re talking very small patterns here, yet in Elliott wave analysis, large patterns are built from increasingly smaller patterns, with all degrees following the same rules.
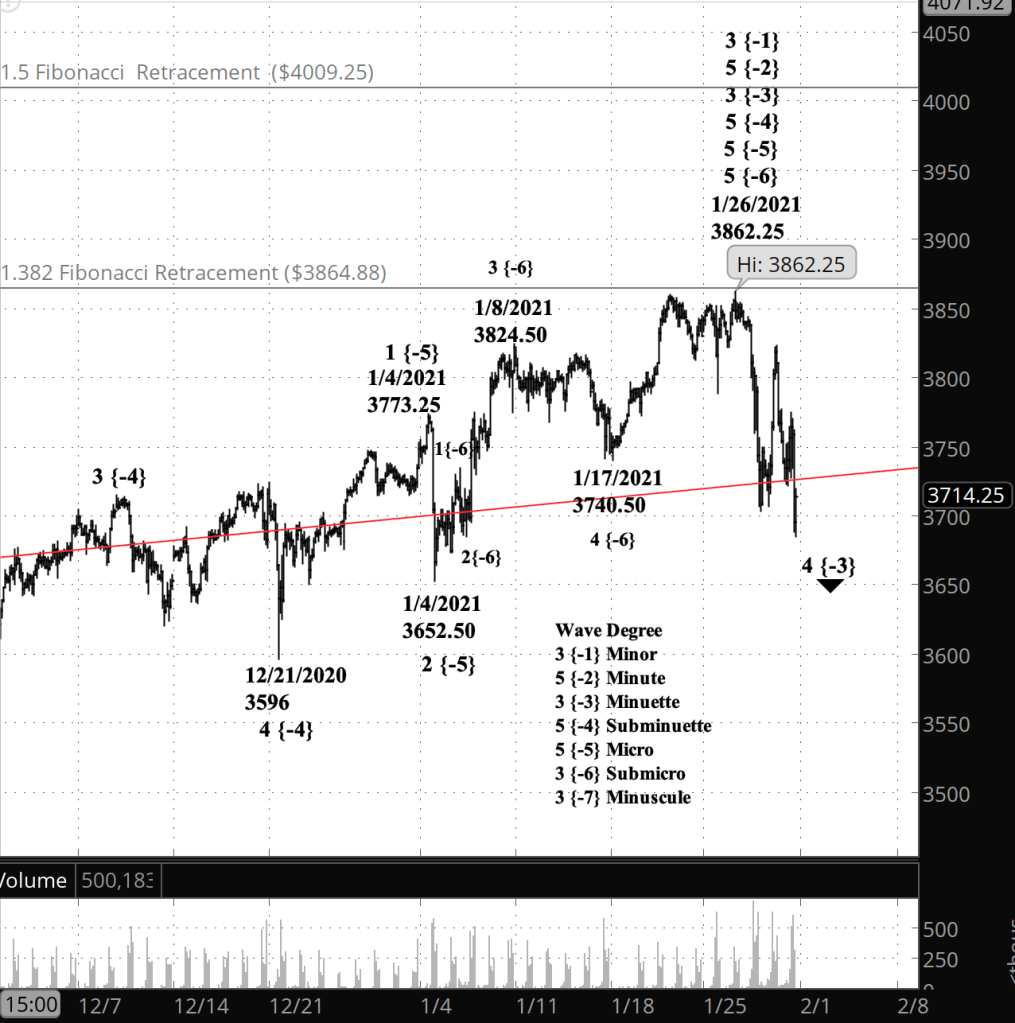
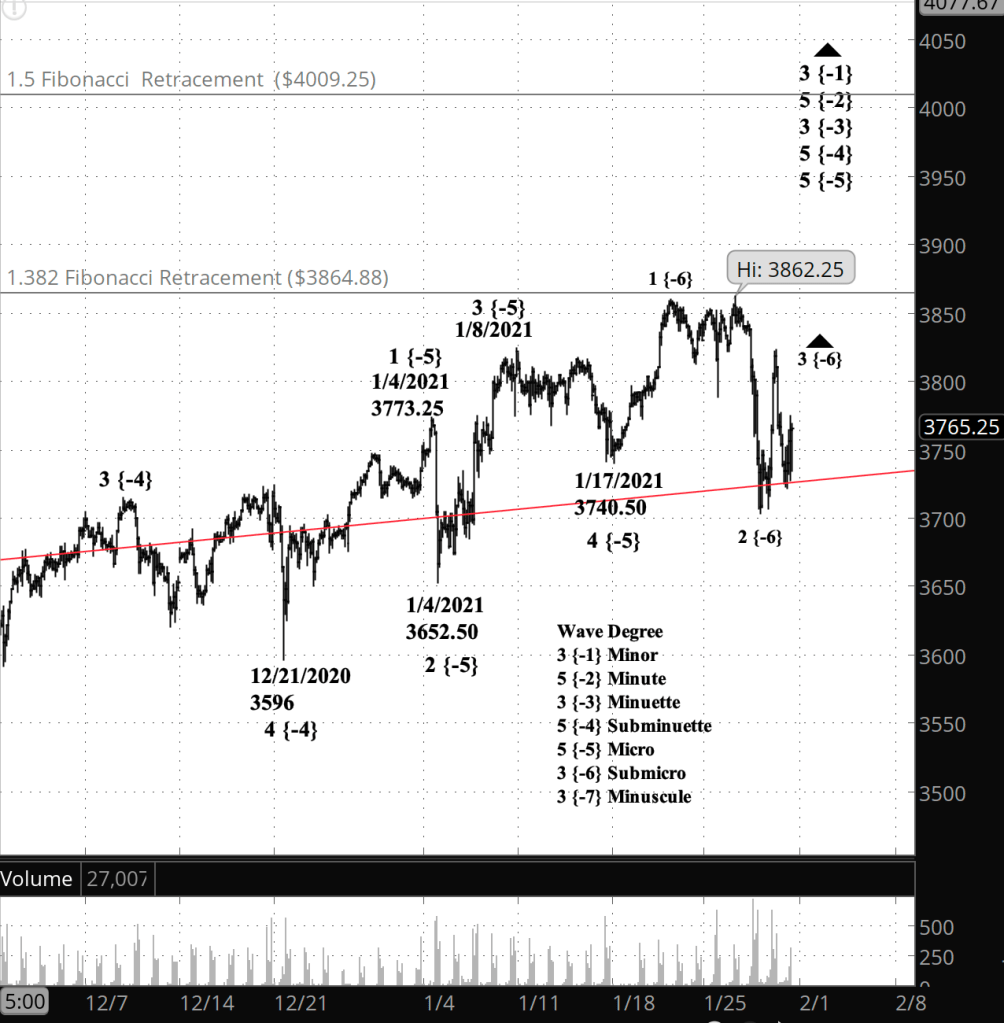
The end of Minuscule wave 2 will be followed by Minuscule 3 to the downside, which will be powerful enough at that small degree to leave no doubt that the trend is down. This is all happening within Submicro wave 1 and is a part of the much larger wave 4 of Minuette degree.
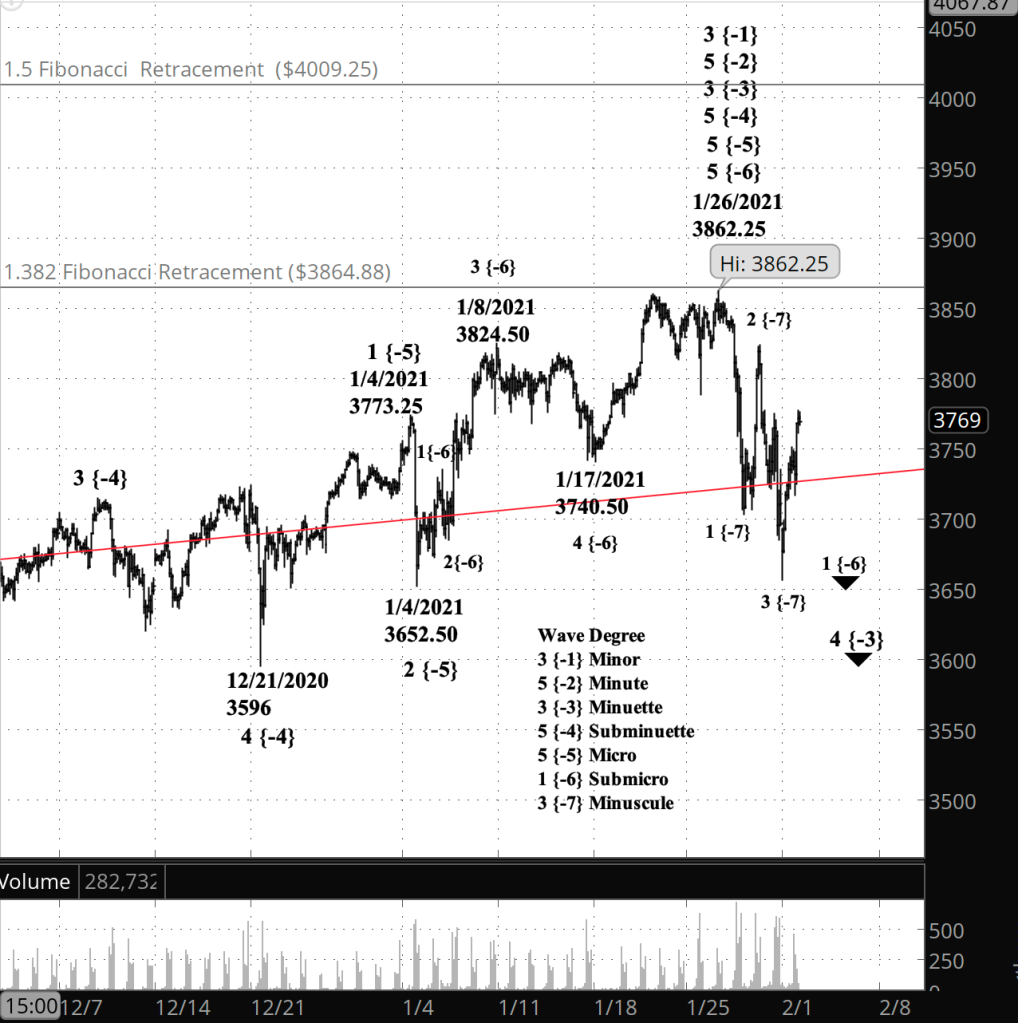
Half an hour before the closing bell. The S&P 500 continued to work through a rising counter-trend correction within the first Submicro degree wave of a downward move that began on January 26. I’ve updated the charts below.
9:50 a.m. New York time
What’s happening now? The S&P 500 E-mini futures continued to work their way lower, in a series of lower highs and lower lows — the classic definition of a downtrend. After reaching a low of 3656.50 in overnight trading, the price retraced upward by 95 points. The decline began on January 26 from 3862.25, which is 5% above the the low so far.
What does it mean? The decline is the beginning of a large-scale downtrend that will eventually work its way down around 2000. But there will be much drama to be seen between now and then.
[S&P 500 E-mini futures at 3:30 p.m., 2-hour bars, with volume]
What does Elliott wave theory say? The downtrend that began on January 26 is wave 1 of Submicro degree. Within Subicro 1, wave 3 of Minuscule degree appears ready to begin its decline after a 2nd wave retracement to the upside.
The price has hit the 1.382 Fibonacci retracement of the decline that began on February 19, 2020 and ended four days later, 1,202 points lower. The decline was part of a Diagonal Triangle pattern that began in December 2018. The red line on the chart is the upper boundary of that triangle, and the lower boundary at present is at about 2100.
The rise since February 23, 2020 has been wave 3 of Minor degree, and the decline that began January 26, 2021 is wave 4 of Minor degree. Fourth wave correction tend to be shall in a normal five-wave trend. However, in triangles the price bounces between boundaries set at the beginning of waves 1 and 3 and the beginning of wave 2. The 4th wave in this instance will carry the price a great distance so that reaches or comes close to the lower boundary of the Diagonal Triangle. Here’s a big-view chart that shows the entire S&P 500 index triangle so far.
What’s happening now? GME continues to conform to Elliott wave analysis, having completed two waves of what will prove to be a three-wave pattern if the decline is a correction within a larger uptrend, or a five-wave pattern if the decline is the beginning of a downtrend.
What does it mean? The price began its 3rd wave down early in the trading session. If the decline is a correction, then the wave is wave C. Once it’s complete, then the next move should be up to new highs. If the decline is a new downtrend, then the wave is wave 3. One it is complete, then the path down will be a long one, and the price might never again see its January 28 peak.
I’ve done a couple of analyses of GME, which has proven to be the subject of an epic street action, and one with far reaching consequences. Today’s analysis may be read here. And yesterday’s is here.
The consequences, I suspect, will come in the form of new regulations. People speak of free markets, but the American stock, options and futures exchanges aren’t among them. They are highly regulated components of the country’s economy. So what form would new regulations take? One will probably be to take the index trading halts on falling indexes that came from the Crash of 1987 and apply them to individual stocks, limiting intra-day movements in both directions. Another might be some limits on short-selling, although as much as Elon Musk might wish it, short selling will surely not be abolished outright.
In any case, as reminiscent of Les Miserables as the /r/WallStreetBets Rebellion of 2021 was, the outcome will surely be the same. The Powers That Be will keep control. We can bet on that with 100% certainty.
2:25 p.m. New York time
Revision of the count. Given the degree of decline today, I’ve done a complete reworking of the count. It pushes the Micro degree labels for waves 3 and 4 down to Submicro degree, treating the high of January 8 as the end of Submicro wave 3, the low of January 17 as the end of Submicro wave 4, and the high of January 26 as the end of Submicro wave 5.
That small-wave completion also cascades up to higher degrees, marking the end of (from smaller degree to larger) of Micro wave 5 within Subminuette wave 5 within Minuette wave 3. The decline from the January 26 high — 3862.25 on the E-mini futures and 3870.09 on the index — is the early stages of wave 4 of Minuette degree, a correction that, if it followed the typical 4th wave pattern, will be shallow rather than steep.
Here’s the revised chart.
[S&P 500 E-mini futures at 2:23 a.m., 2-hour bars, with volume]
10:10 a.m. New York time
What’s happening now? The S&P 500 E-mini futures continued to work their way upward in overnight trading in the middle stage of an uptrend that began December 21.
What does it mean? Completion of the middle stage, which began January 27, will be followed by a correction — most likely a shallow one — and then a push up to a new high. The end of that may be at one of the Fibonacci levels retracing the powerful February to March fall of last year. The 131.8% level, at 3864.88, has been touched, and the next one up is the 150.0% level at 4009.25
[S&P 500 E-mini futures at 10:10 a.m., 2-hour bars, with volume]
What does Elliott wave theory say? The present rise is wave 3 of Submicro degree, and internally I see it as being in having completed a subwave, 3 of Minuscule degree, in overnight trading and embarked on a corrective subwave, Minuscule 4. This is all within wave 5 of Micro, whose completion will cascade up the degrees and also mark the end of wave 3 of Minuette degree, which began November 12, 2020 from 3525.20
My trading strategy. The window is open for entering a position built from options expiring March 19. Under my rules I have until February 9 to enter, with February 2 — Tuesday of next week — being the ideal entry point.
Honestly, there are not a lot of great choices. My rules require an implied volatility rank (IVR) — a comparison of a stock’s implied volatility to its previous levels — of 25 or greater. I also tend to prefer exchange-traded funds (ETF) rather than having to navigate the drama of earnings announcements.
My ETF choices meeting that IVR requirement are SLV 66.2, IWM 33.1 and QQQ 30.7, GLD 28.0. The S&P 500 ETF, SPY, is below my minimum, at 24.0.







You must be logged in to post a comment.