GME Analysis (just for fun)

12:05 p.m. New York time

Elliott wave analysis is based on the premise that stock prices represent the thinking of groups of people, which in turn mirrors the public mood. The pattern of a stock chart represents the stereotypical ways in which that mood fluctuates. The great practitioner of Elliott wave analysis, Robert Prechter, has characterized it as herding behavior.

The Great /r WallStreetBets Short Squeeze on GME, which sent the gaming company stock soaring by orders of magnitude, has reversed. The pattern of the rise fits perfectly into an uptrending Elliott wave pattern. Wave 5, of course, is the end of the rise. The ensuing movement to the downside is either the beginning of a new downtrend, or a correction within a continuing uptrend. An article on what happened may be found here. And here’s a chart showing the analysis. (I have no idea what the degree of the waves are, so I’ve used the wave numbers without a subscript.)
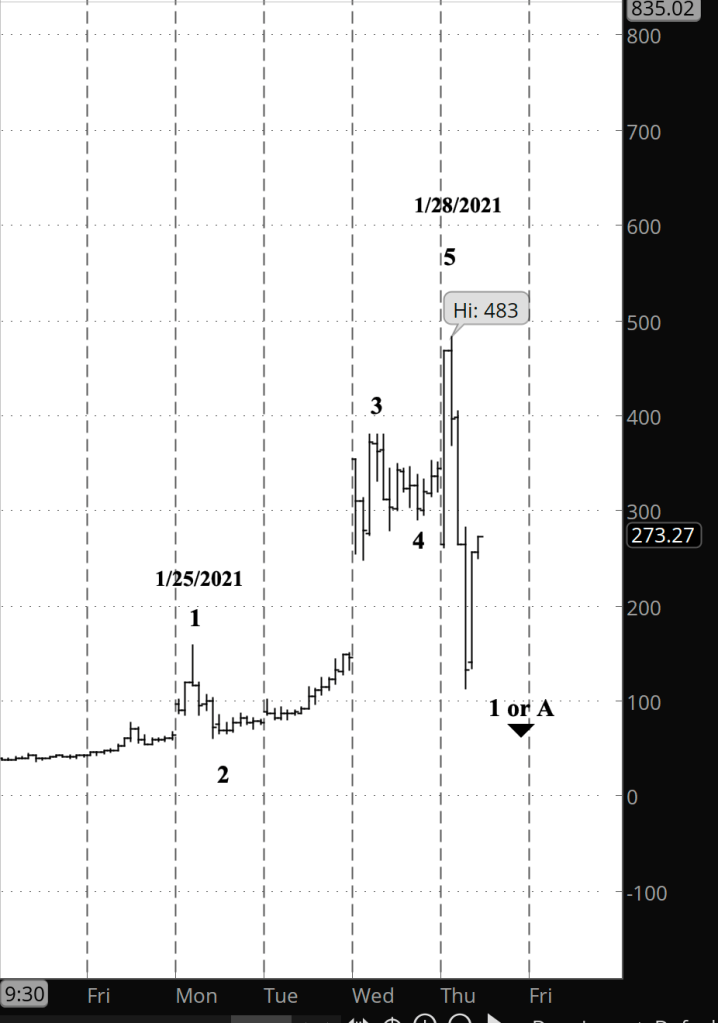
[GME at 12:04 p.m., 30-minute bars]

I’m fascinated by normality of the chart. This rise was the equivalent of a street action, group protest against the short-seller of hedge funds. It has been aptly described as a popular rebellion of private traders against the rich and powerful. And yet, this revolutionary act followed the same rules as a rise in AAPL, TSLA or the S&P 500: Three waves in the direction of the trend, with the middle wave — the 3rd wave — not being the shortest of the three, and two counter-trend corrections. It all played out in six days, with the price rising to 11 times the starting price before dropping after financial companies blocked GME stock purchases. And despite the rebellious motives behind the rise and the regulatory stomping on the brakes that end it, the chart followed the rules discovered in the 1930s by R.N. Elliott.

By Tim Bovee, Portland, Oregon, January 28, 2021
Read More »

Thursday, January 28, 2021

3:30 p.m. New York time

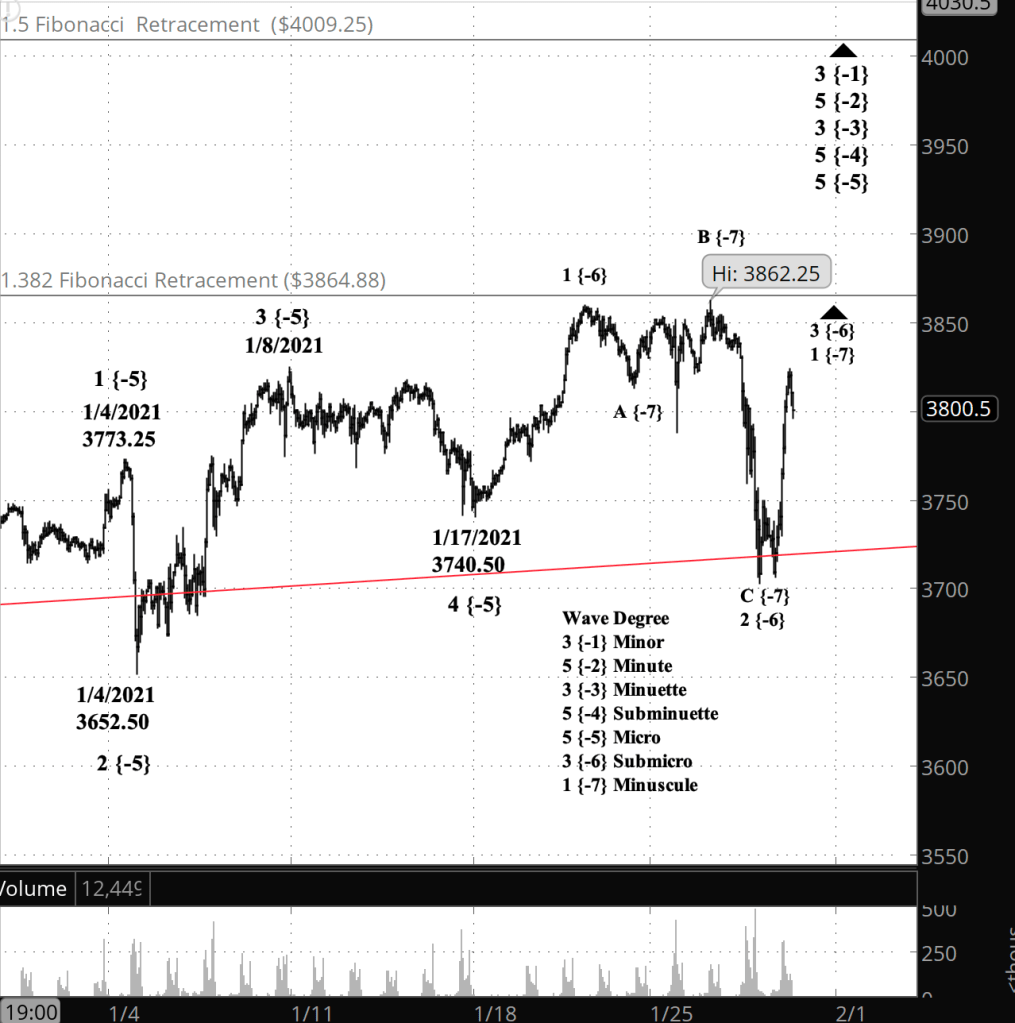
Half an hour before the closing bell. The S&P 500 E-mini futures peaked at 3823.50 and then reversed. I count that long rise as wave 3 of Subminuscule degree within wave 1 of Minuscule degree. The very low level correction, a 4th wave, that has begun will be shallow, and then the rise will resume in a 5th and final wave. I’ve updated the chart below.

9:45 a.m. New York time

What’s happening now? The S&P 500 E-mini futures declined after the closing bell yesterday to 3703.50 and then reversed, climbing back to the 3775 at the opening bell today and then continuing to rise.

What does it mean? Yesterday’s low marks the end of the downward correction that began January 26 from a 3862.25 high. The subsequent rise will exceed that high, perhaps reaching the region of 4009.25, which is the 50% retracement level of the decline that ended February 23, 2020.

[S&P 500 E-mini futures at 3:30 p.m., hourly bars, with volume]

What does Elliott wave theory say? The January 27 low marks the end of wave C of Minuscule degree and its parent, wave 2 of Submicro degree. Wave 3 of Submicro degree, rising in the direction of the trend, is now underway and appears to be in the 3rd subwave of Submicro 3.

Within ascending order of degree, all of this is happening within wave 5 of Micro degree within wave 5 of Subminuete degree within wave 3 of Minuette degree within wave 5 of Minute degree within wave 3 of Minor degree. Minor 3 began on February 23, 2020.

Read More »

Wednesday, January 27, 2021

3:30 p.m. New York time

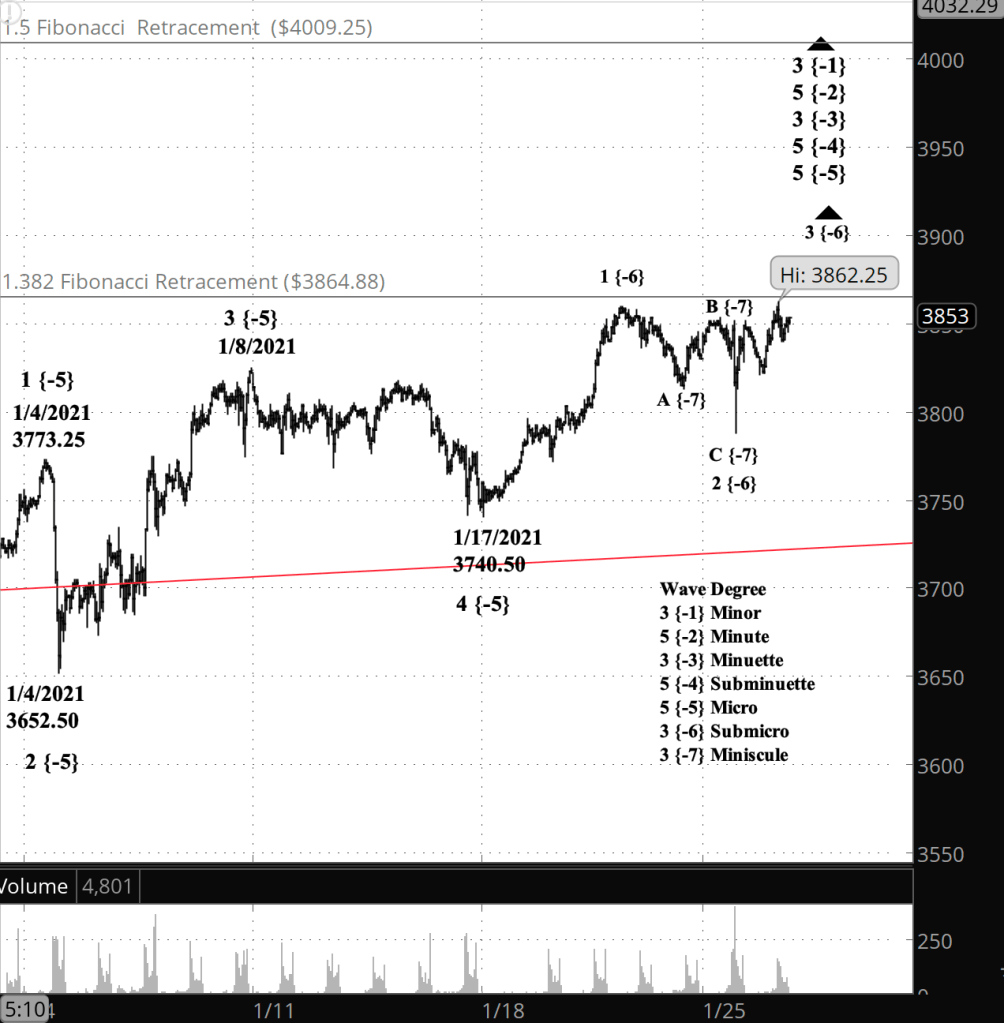
Half an hour before the closing bell. The S&P 500 E-mini futures from last night set lower highs for 10 hours, set one (barely) higher high in the next hour, and then resumed lower highs for the next three hours, another higher high in one hour, and then two hours of lower highs to the present moment. Which, all-in-all, could be seen as a weakening of the decline, perhaps signaling that a reversal is near. I’ve updated the chart below.

9:45 a.m. New York time

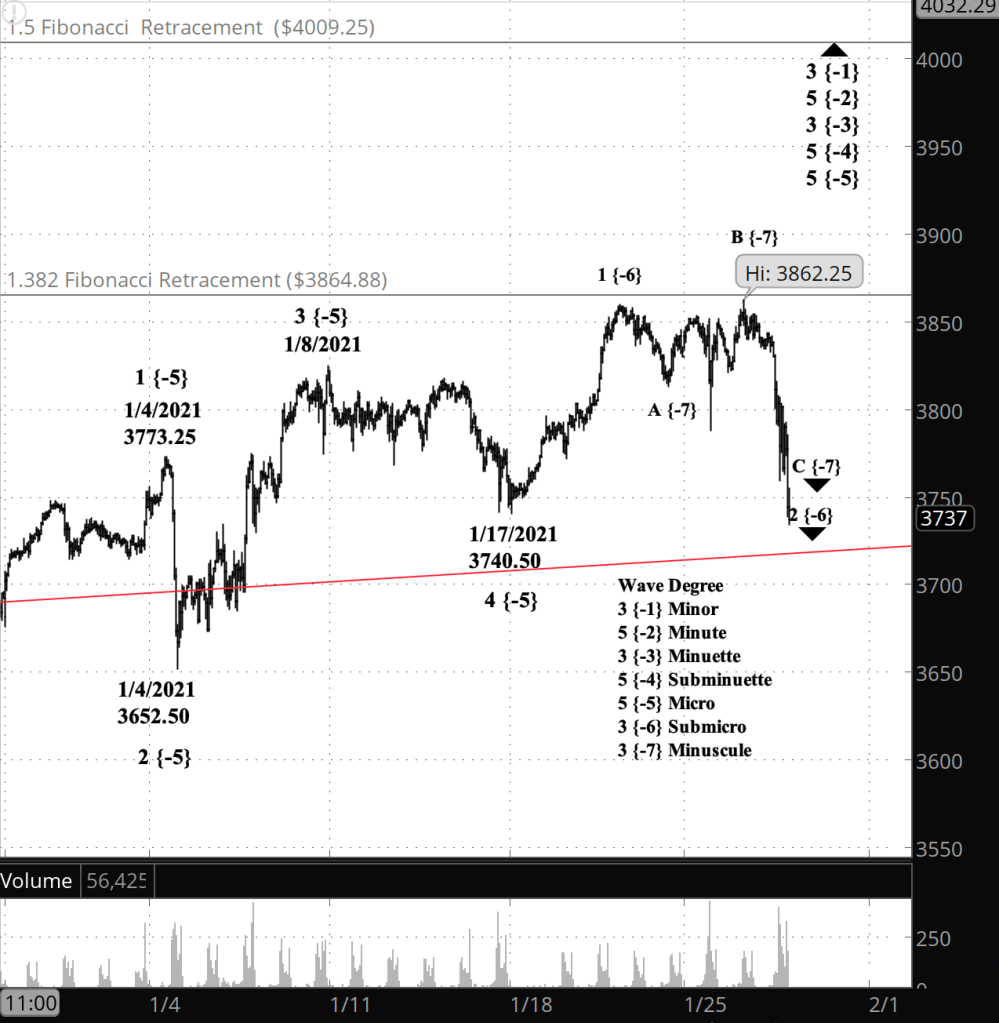
What’s happening now? The S&P 500 E-mini futures dropped sharply from yesterday’s high of 3862.25, reach 3775.25 in early trading.

What does it mean? The decline forces a reassessment of yesterday’s analysis. Under the new labelling, the correction that began January 17 is still underway. I set out my reasoning in the Elliott wave theory section below.

[S&P 500 E-mini futures at 3:30 p.m., hourly bars, with volume]

What does Elliott wave theory say? The reassessment suggests that the A-B-C waves described yesterday as being of the Minuscule degree are in fact one degree lower, at the Subminuscule level, and that the parent form — wave 2 of Subminuette degree — is still underway. The rest of the analysis remains unchanged: The end of Minuscule wave C will be followed by one of two options: 1) Wave C will concluded wave 2 of Subminuette degree and will be followed by a rise to new highs as Subminuette wave 3. Or, 2) wave C will be followed rise that will fall short of new highs, a separator wave between two correction patterns in a compound structure as Subminuette wave 2 continues. I consider the second options to be unlikely; compound structures are more often seen in 4th waves.

Read More »

Tuesday, January 26, 2021

Half an hour before the closing bell. The S&P 500 remains close the the 1.382 retracement level of the rise since February 23. On the E-mini futures chart I count the upward movement as being in a 3rd wave internal to wave 3 of Submicro degree. Here’s a big-picture chart showing three Fibonacci retracement price targets. The red lines are a long-running Diagonal Triangle I’ve also updated the near-term chart, below, with the red line showing the upper boundary of the triangle.

[S&P 500 index at 3:25 p.m., daily bars]

9:40 a.m. New York time

What’s happening now? The S&P 500 E-mini futures before the opening bell came with half a point of the high set of 3859.75 set on January 20. As the bell rang, the price moved above that level to a new high.

What does it mean? The move above the January 20 high confirms that the low-level correction ended on January 25 and a new movement to the upside is underway. It has hit the lowest Fibonacci target.

[S&P 500 E-mini futures at 3:30 p.m., 50-minute bars, with volume]

What does Elliott wave theory say? My principle count sees the rise as wave 3 of Submicro degree. Internally, Submicro 3 appears to be in its 3rd wave of Minuscule degree. Third waves are usually the strongest of the three waves that move in the direction of a trend. This is all happening, from smaller movements to larger, within wave 5 of Micro degree within wave 5 of Subminuette degree within wave 3 of Minuette degree within wave 5 of Minute degree within wave 3 of Minor degree.

My trading strategy. Today is the first day for entering positions using options that expire March 19. The enter period will run through February 9, within the midpoint — the ideal entry date — being February 2.

Read More »

Monday, January 25, 2021

3 p.m. New York time

An hour before the market close. The S&P 500 rapidly dropped during the day to the 61.8% Fibonacci retracement level and then reversed. I’ve updated the chart below, marking the day’s decline as wave C of Miniscule degree, possibly culminating the 2nd wave correction of Submicro degree. Cautionary note: The rise following Miniscule wave C has yet to set a higher high and so cannot yet be labeled as the beginning of wave 3 of Submicro degree.

10:05 a.m. New York time

What’s happening now? The S&P 500 E-mini futures rose overnight but remained below the January 21 peak of 3859.75 in the middle wave of a three-wave a correction of the rise since January 17.

What does it mean? Prior to the rise, the price declined from the peak to a Fibonacci level, 38.2%. The rise retraced nearly all of the decline. It will be followed by another decline, perhaps down to the Fibonacci 50% or 68.8% retracement levels, the two lines below 31.8% on the red Fibonacci grid.

[S&P 500 E-mini futures at 3 p.m., 50-minute bars, with volume]

What does Elliott wave theory say? The price movement since last week’s peak has taken the form of a Zigzag, a corrective wave: wave A of Miniscule degree with five subwaves and wave B with three subwaves. The subsequent decline, Miniscule wave C, will have five subwaves. All of this is happening within wave 2 of Submicro degree. We’re looking at very small movements here.

Once wave C is complete, there are two alternatives. Usually for 2nd waves, a Zigzag will complete the correction and the market will rise to a new high, in this case as wave 3 of Submicro degree. A correction can also take a compound form, with two corrective patterns back to back separated by an X wave, which would be rising in this case. My opinion is that compounding is unlikely, but that’s not the same as impossible. If the future rise after Miniscule C reaches a new high, then it’s part of Submicro wave 3. If it reverses without reaching a new high, then it’s a Miniscule degree X wave.

The two gray Fibonacci levels on the chart are possible price targets for Submicro wave 3. No guarantees, but waves often reverse at Fibonacci levels.

The small movements discussed above are part of an upward movement that began February 23, 2020. The full positioning of Miniuscule wave C would be that it is a subwave of wave 2 of Submicro degree within Micro wave 5 within Subminuette 5 within Minuette 3 within Minute 5 within Minor 3.

My trading strategy. My next options trading window begins Tuesday, January 26 (that’s tomorrow) and will remain open until February 9.

Read More »

Friday, January 22, 2021

3:30 p.m. New York time

Half an hour before the closing bell. The S&P 500 climbed midway through the session, around noon, and then fluctuated in a sideways range as the closing bell approached. I’ve updated the chart below.

9:40 a.m. New York time

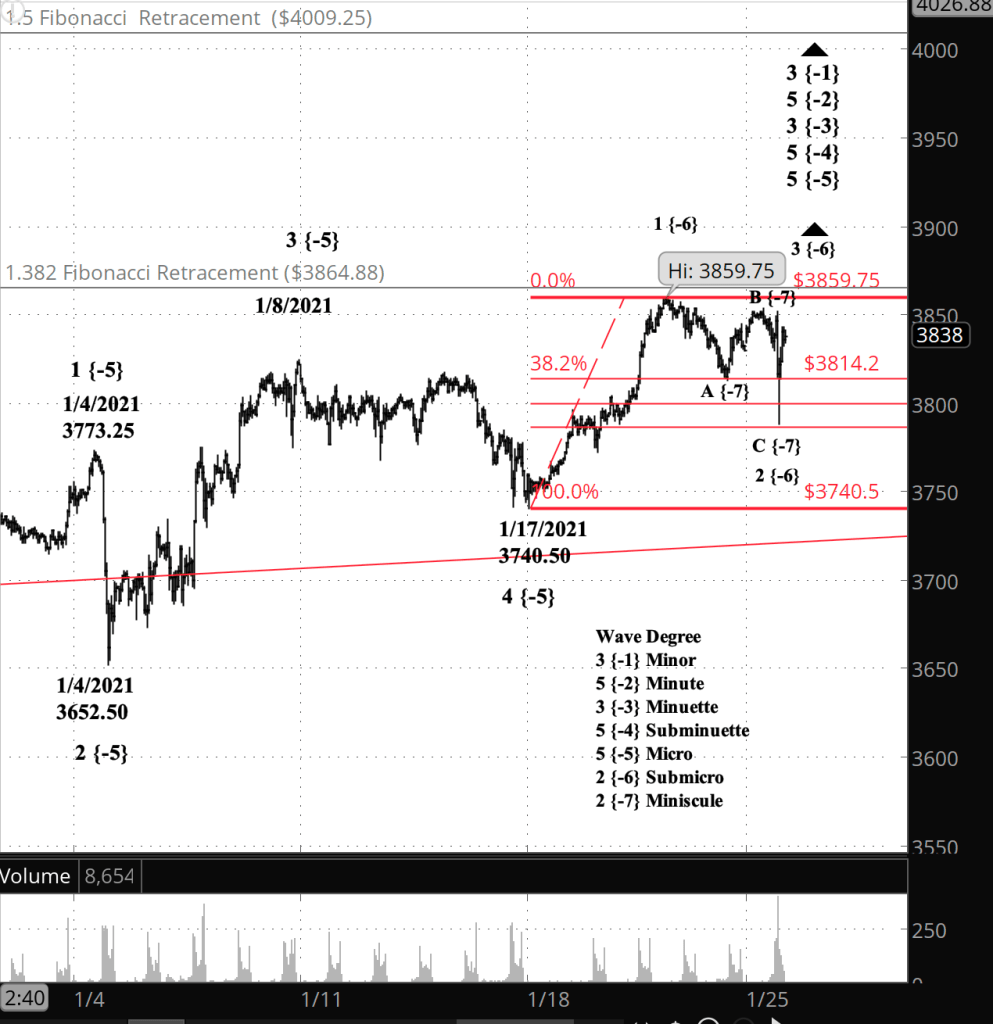
What’s happening now? The S&P 500 E-mini futures continued to decline overnight and has retraced 38.2% of the previous rise since January 17. That level is a Fibonacci percentage, one of several points where reversals are common. And indeed, as the opening sounded, the price rose a bit. (I’ve superimposed a Fibonacci grid, in red.)

What does it mean? The decline has been large enough to persuade me that the high of 3859.75 on January 21 is indeed the end of the rise and the beginning of a decline, which was my principle analysis in yesterday’s post. The decline could go further, but if I squint my eyes, the correction internally appears to have traced three waves and so has met the minimum requirements for a correction. However, the internal waves seem overly small to me, so my expectation is that there will be more downside.

[S&P 500 E-mini futures at 3:30 p.m., 50-muinute bars, with volume]

What does Elliott wave theory say? The decline, beginning on January 21 from 3859.75, is wave 2 of Submicro degree. It will be followed by a wave 3 rise to higher highs, then a shallow correction followed by a 5th wave push up even higher. Submicro 5’s completion will mark the end of wave 5 of Micro degree and Subminuette degree, and wave 3 of Minuette degree.

Read More »

Thursday, January 21, 2021

3:30 p.m. New York time

Half an hour before the closing bell. The S&P 500 continued a shallow and slow slide, leaving the choice between the principle analysis and the alternative still up in the air. I’ve updated the chart below.

10:20 a.m. New York time

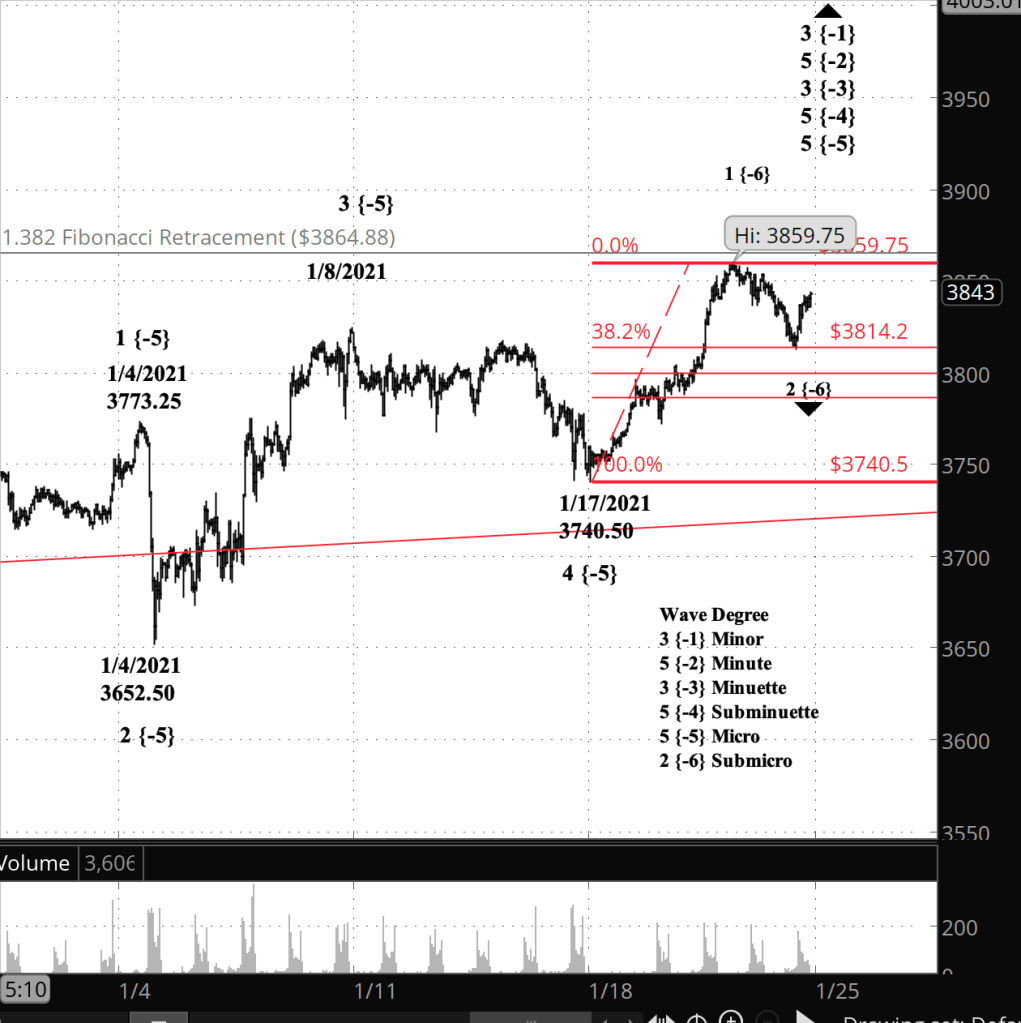
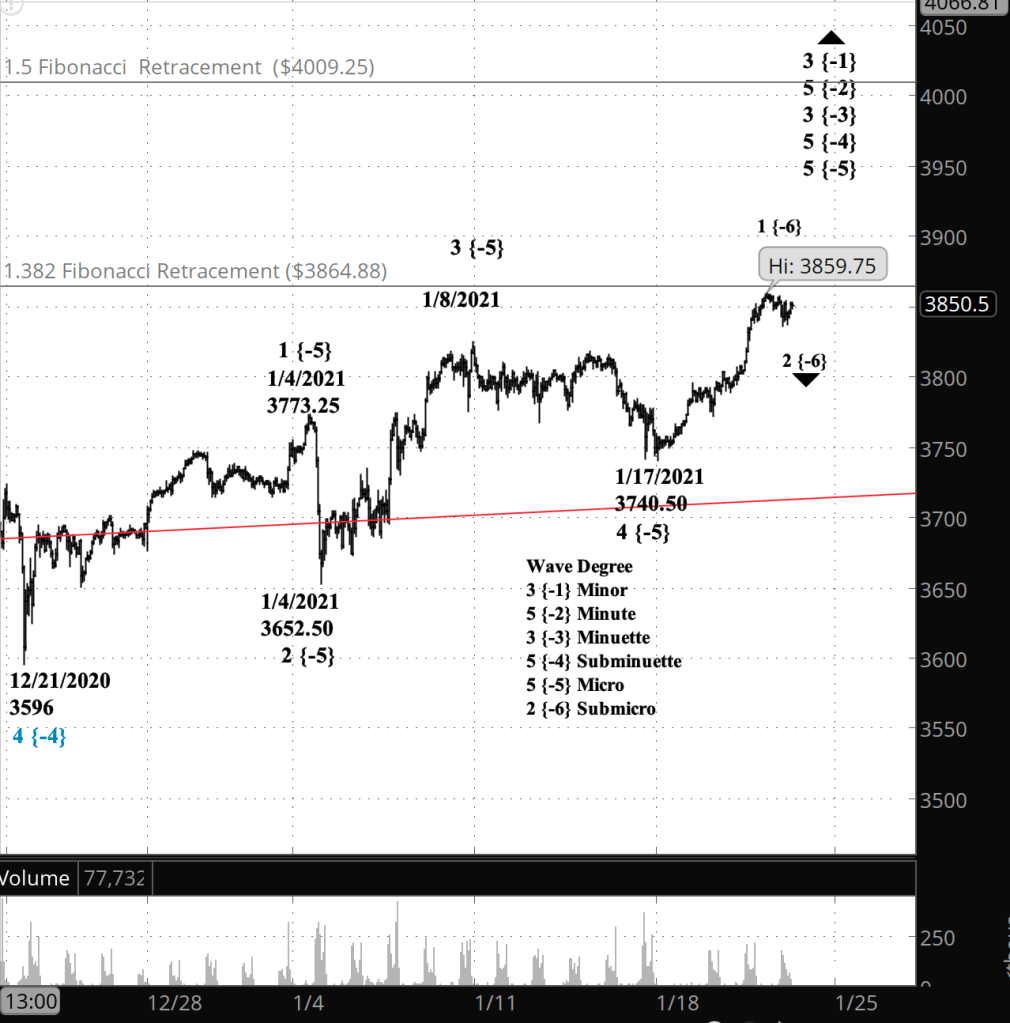
What’s happening now? The S&P 500 E-mini futures hit a peak overnight of 3859.75 and dropped back a little. The peak was five points below the 1.382 Fibonacci level, a common turning point for prices.

What does it mean? The peak by my principle count marks the end of the first leg of the rise that began January 17 from 3740.50. It will be followed by a correction, likely a Zigzag pattern that will take back much of that rise before resuming an upward course to still higher prices.

What is the alternative? The first leg rise may in fact not yet be over. If that’s the case, then the S&P 500 will quickly see a resumption of the rise without the intervention of any significant correction

[S&P 500 E-mini futures at 3:30 p.m., hourly bars, with volume]

What does Elliott wave theory say? Whether my principle or my alternative count prevails depends upon how we read the internal structure of the rise since October 17, which was wave 1 of Submicro degree. A first wave has five waves internal to it, stairstepping up to the end. If five waves are complete, then the next move will be wave 2 of Submicro degree. If the peak represents the end of wave three within Submicro 1 — the alternative count — then there will be a final push to the upside — Submicro wave 5 — after a shallow and brief Submicro wave 4 correction is complete.

Which count prevails depends upon how far the present decline travels. The further it goes below the overnight peak, the more likely that the principle count will prevail.

This is all happening within (smaller to larger) wave 5 of Micro degree within wave 5 of of Subminuette degree within wave within wave 3 of Minuette degree within wave 5 of Minute degree within wave 1 of Minor degree. The end of Micro 5 will trigger a 4th wave correction two degrees higher, within the Minuette degree, which will be seen as a potentially significant market reversal.

Read More »

Wednesday, January 20, 2021

12:30 p.m. New York time

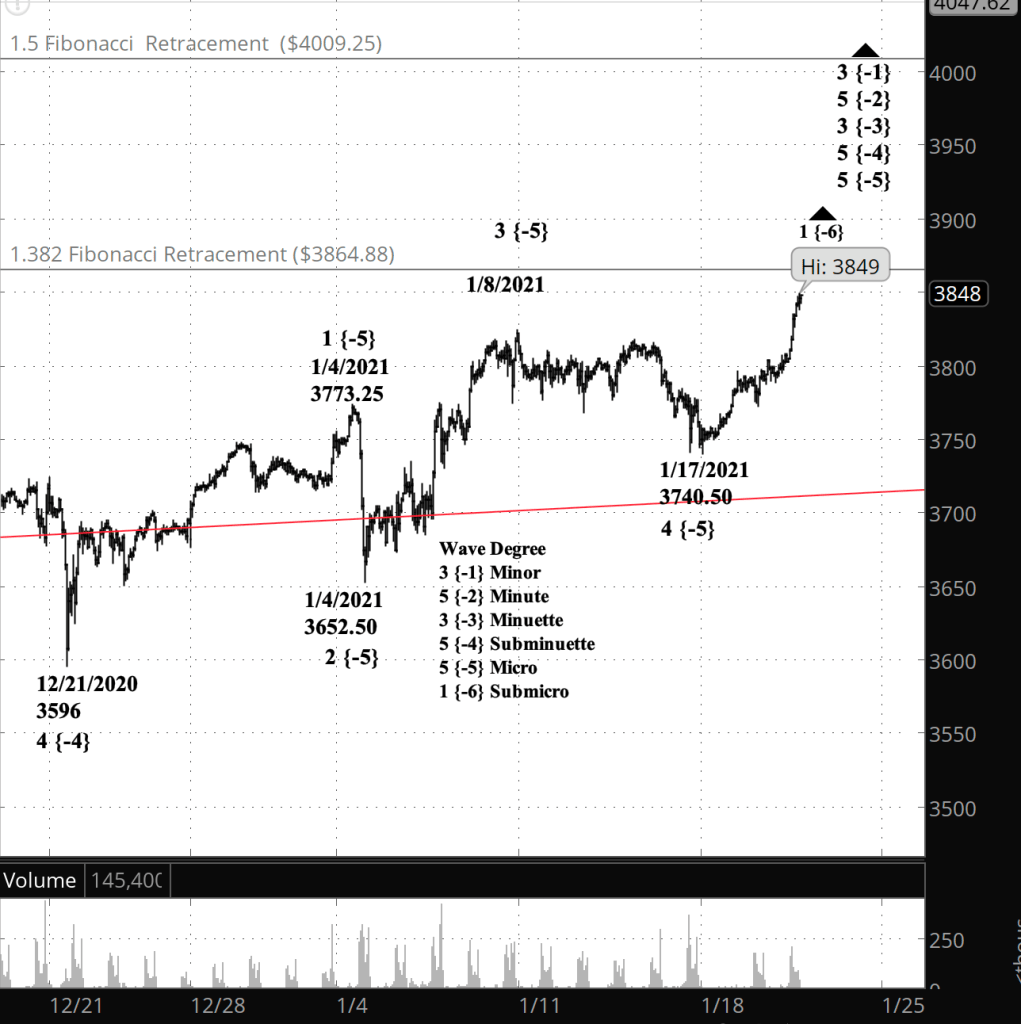
Half an hour before the closing bell. The S&P 500 continued its rise throughout the trading session. The E-mini futures had reached a high of 3849 as the closing bell approached, and the index, a high of 3856.25. The index broke above the 1.382 Fibonacci retracement level. By my principle count, wave 1 of Submicro degree continues, within wave 5 of Micro degree. I’ve updated the chart below.

9:55 a.m. New York time

What’s happening now? The S&P 500 E-mini futures continued to rise overnight, reaching a high of 3816.25 by the opening bell.

What does it mean? The upward push, when complete, will mark the end of the middle wave up within the rise that began October 30 from 3225. One possible endpoint would be the 1.382 Fibonacci retracement level, at 3864.88, although the rise could go higher. The end of the middle wave will be followed by a downward correction, although likely a shallow one.

[S&P 500 E-mini futures at 3:30 p.m.. New York time, 1-hour bars, with volume]

What does Elliott wave theory say? The rise overnight is wave 1 of Submicro degree within wave 5 of Micro degree within wave 5 of Subminuette degree within wave 3 of Minuette degree, all within wave 5 of Minor degree. The shallow correction that will follow the end of this rise will be wave 4 of Subminuette degree.

Read More »

Tuesday, January 19, 2021

12:30 p.m. New York time

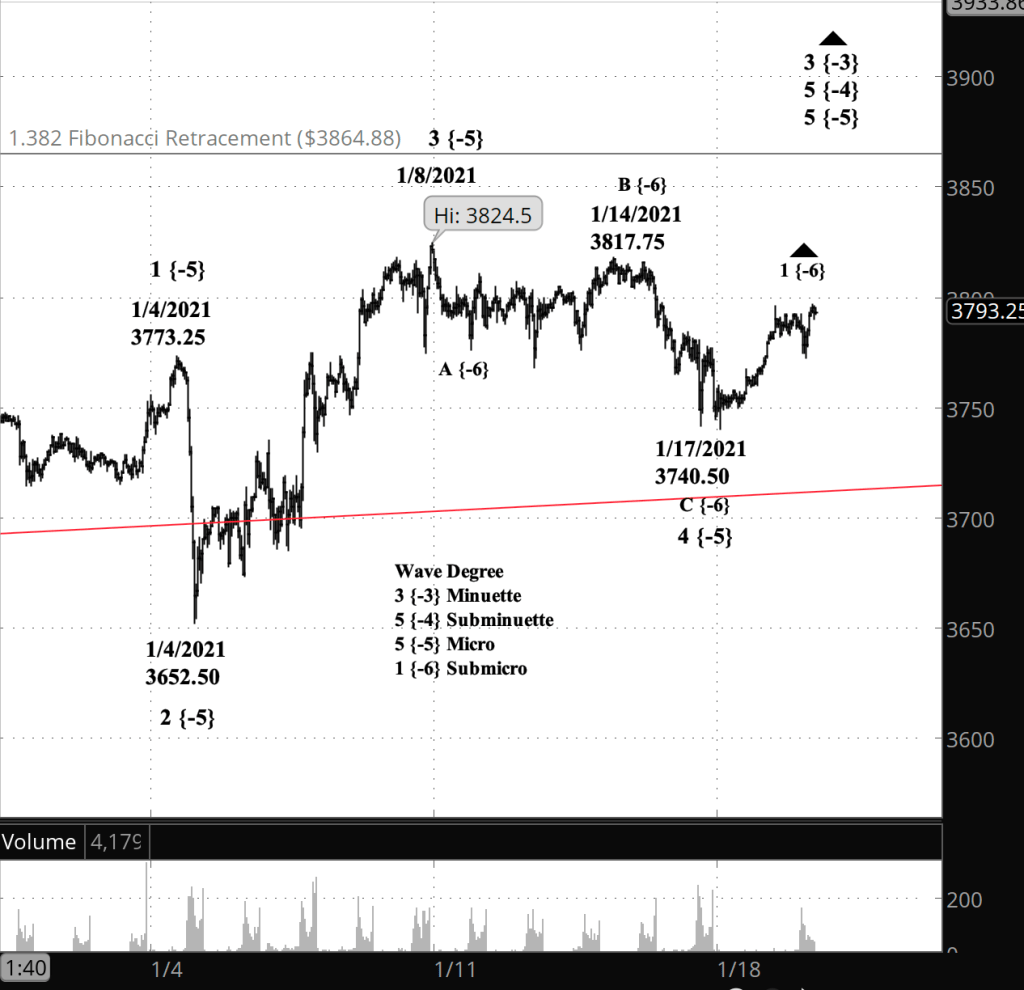
Half an hour before the closing bell. The S&P 500 E-mini futures continued to rise, reaching what can be counted as a 5th and final subwave wave of wave 1 of Submicro degree. I’ve updated the chart below.

9:35 a.m. New York time

What’s happening now? The S&P 500 E-mini futures continued the rise that began on January 17 from 3740.50.

What does it mean? The rise is the beginning of the end of the uptrend that began in October 2020. It will be followed by a downward correction, although a shallow one, likely reaching below 3000 and perhaps into the 2700s.

What is the alternative? The rise could be separating two, back-to-back corrective patterns. If that’s the case, then rise will be followed by a second corrective pattern.

[S&P 500 E-mini futures at 3:30 p.m., 40-minute bars, with volume]

What does Elliott wave theory say? Under my principle count, the rise from January 17 is wave 1 of Submicro degree within wave 5 of Micro degree within wave 5 of Subminuette degree, all of that happening within wave 3 of Minuette degree. Submicro wave 1 appears to be in its 4th subwave.

The alternative count labels the rise from January 17 as wave X of Submicro degree, a separator wave that will be followed by a three-wave corrective pattern (A-B-C) or a five-wave Triangle structure.

Read More »

Monday, January 18, 2021

9:52 a.m. New York time

Market holiday. Markets in the United States are closed today for the holiday honoring Martin Luther King. The S&P 500 E-mini futures were traded overnight in other countries.

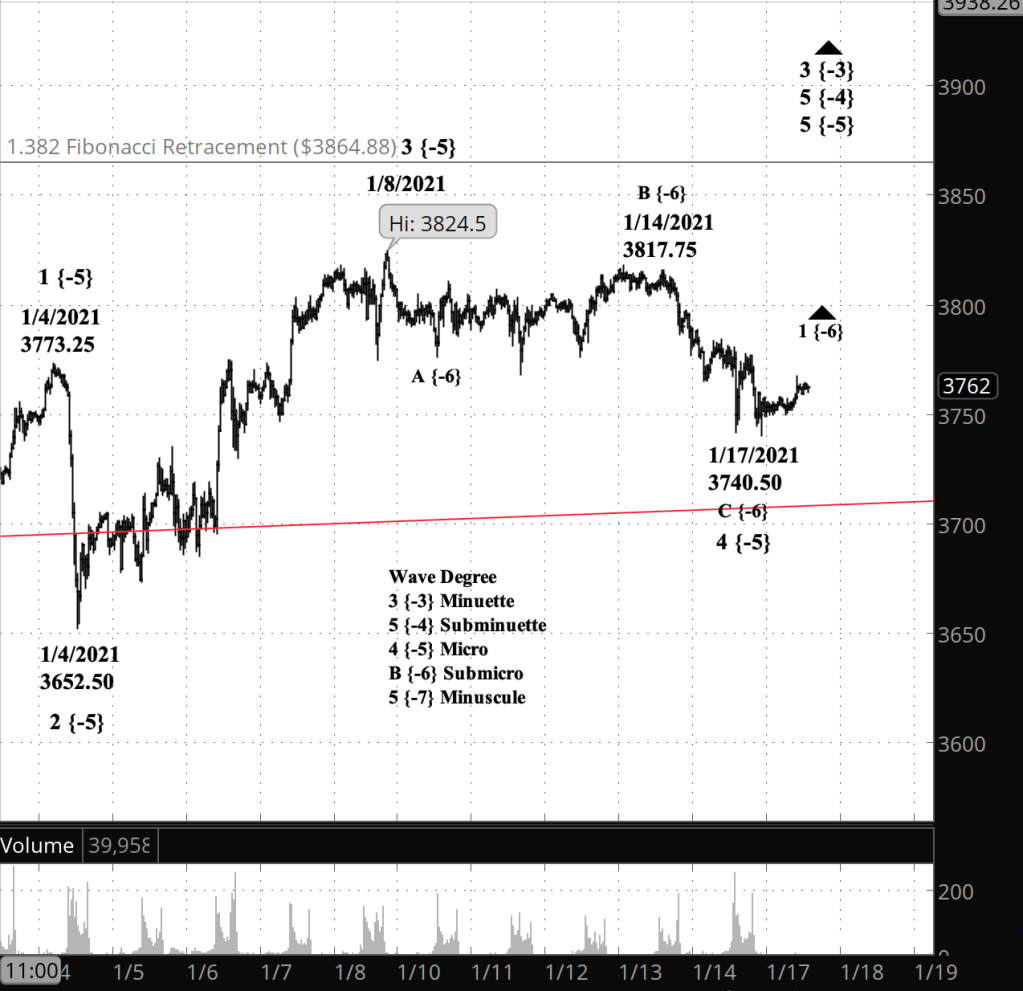
What’s happening now? The S&P 500 E-mini futures reversed at 3740.50 in overnight trading on January 17 after a decline that began on January 14 from 3817.75.

What does it mean? The reversal marks the start of a final uptrend within the larger rise that began October 30 from 3225.

What is the alternative? The rise that began overnight might be a separator between two corrective patterns, which is called a compound correction. It could also be that the downtrend that began January 14 is still in progress.

[S&P 500 E-mini futures at 9:51 a.m., 30-minute bars, with volume]

What does Elliott wave theory say? The large uptrend that began October 30 is wave 3 of Minuette degree. By my principle count, the reversal overnight marked the end of wave C of Submicro degree within wave 4 of Micro degree within wave 5 of Subminuette degree. It is the beginning of wave 5 of Micro degree.

An alternative count sees the correction as developing into a compound structure. Last night’s reversal under this view marks the beginning of wave X of Submicro degree, which will separate the A-B-C pattern just completed from another, not yet visible corrective pattern.

I’ve marked the chart as though the overnight low was indeed an end to Submicro C, but in fact it could still be underway. If that’s the case, then the down-pointing arrow that had appeared the chart’s “C {-6}” label will need to be restored, and likewise on the “4 {-5}” label.

My trading strategy. The next options entry period under my rules begins on January 26 and lasts through February 9, with February 2 being the midpoint, 45 days before expiration on March 19.

Read More »