3:30 p.m. New York time
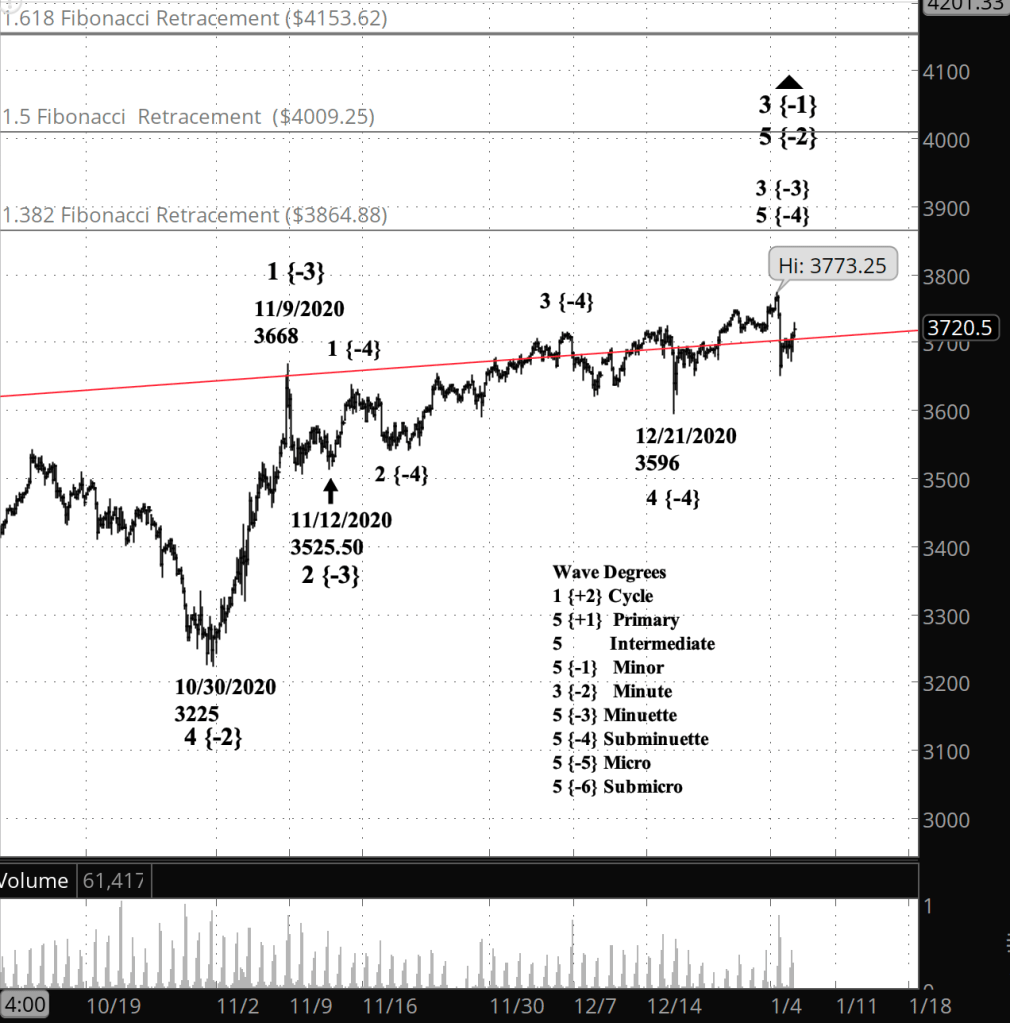
Half an hour before the closing bell. Close up, the S&P 500 has retraced nearly all of its decline. The question remains open whether the rise is the start of wave 5 of Micro degree or the beginning of a wave X, separating two corrective patterns.
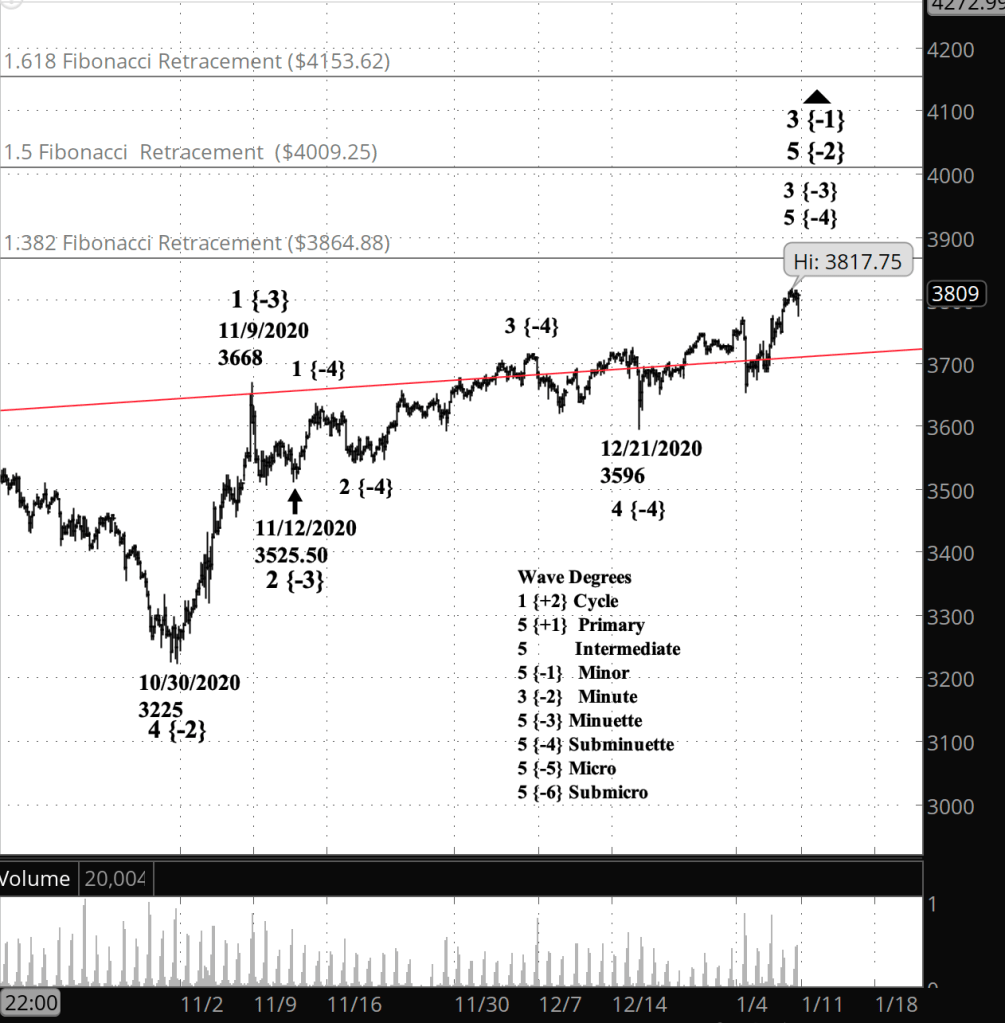
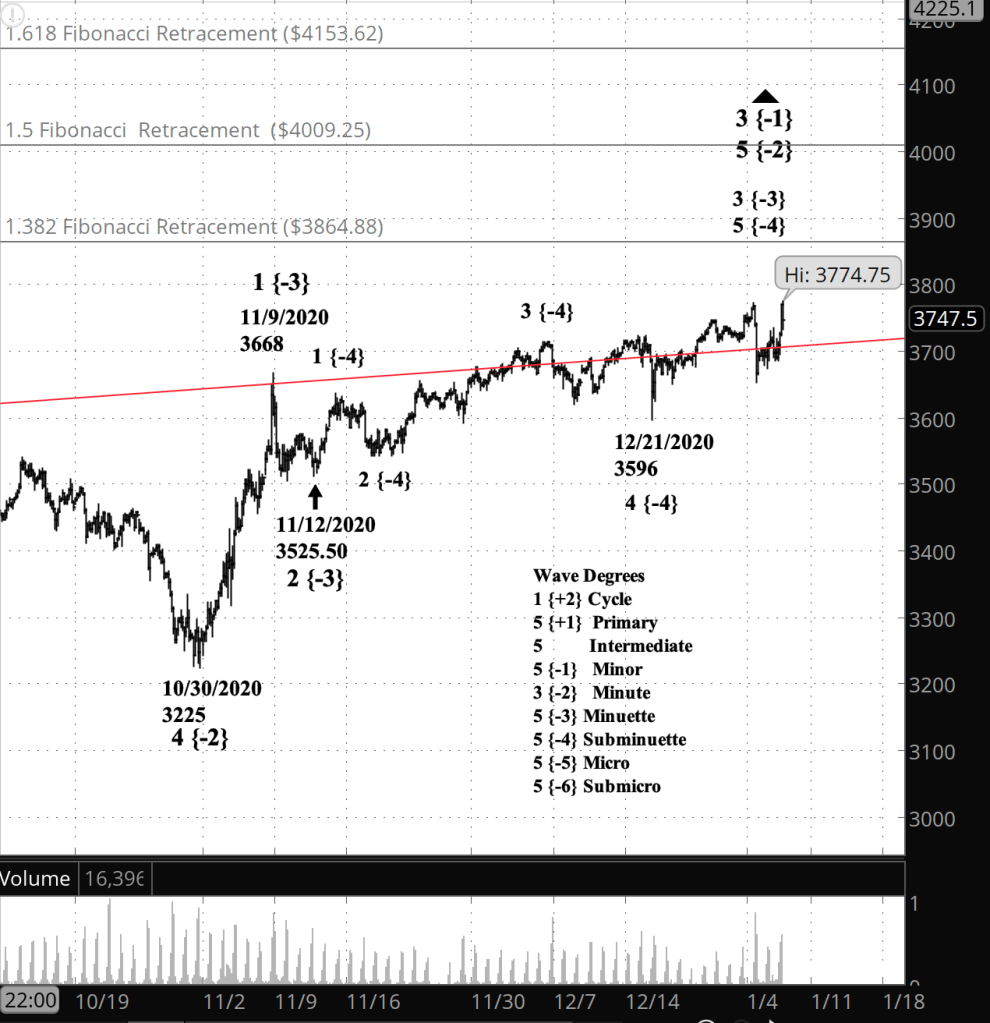
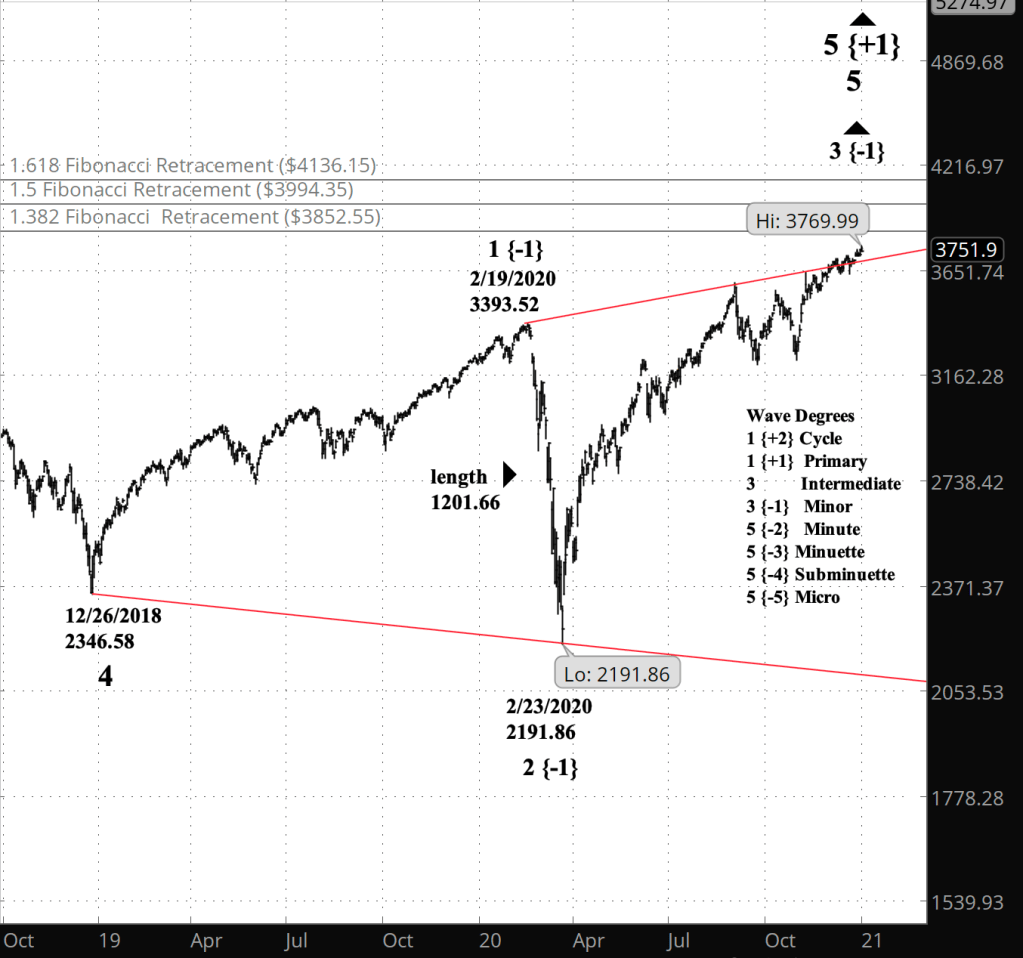
Big picture, the S&P 500 remains below the 1.382% Fibonacci retracement level, which would be a typical turning point for the rise since February 23.
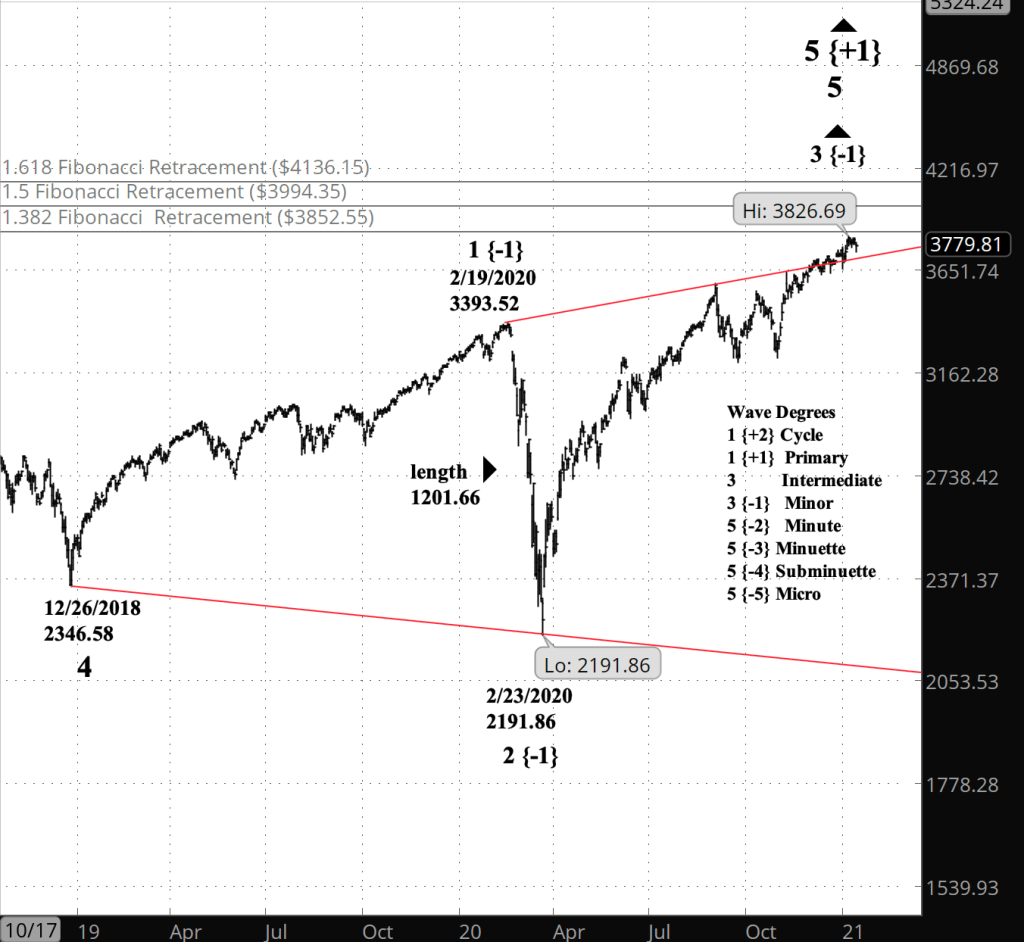
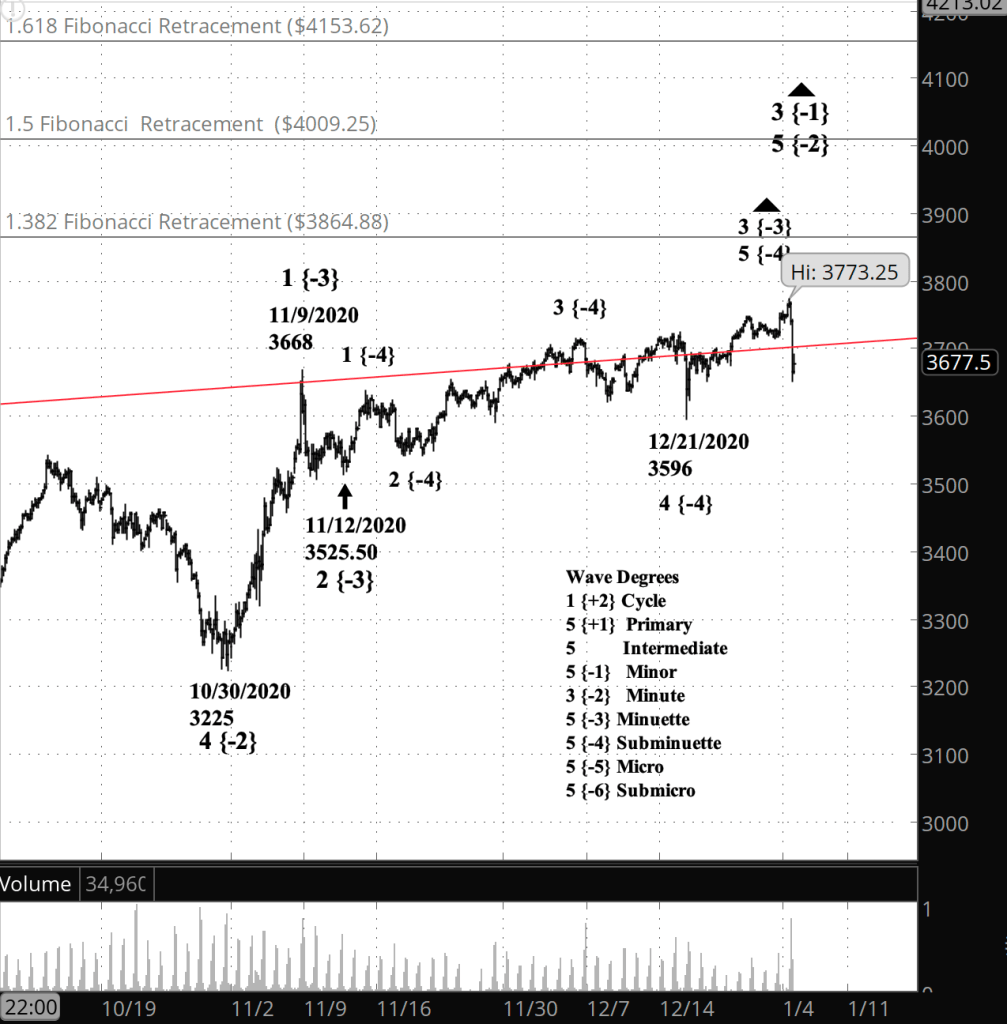
I’ve updated the near-term chart below. I’ve also corrected the last graf Elliott wave discussion to label the red line as the upper boundary (not lower) of the Diagonal Triangle that began in December 2018.
10:40 a.m. New York time
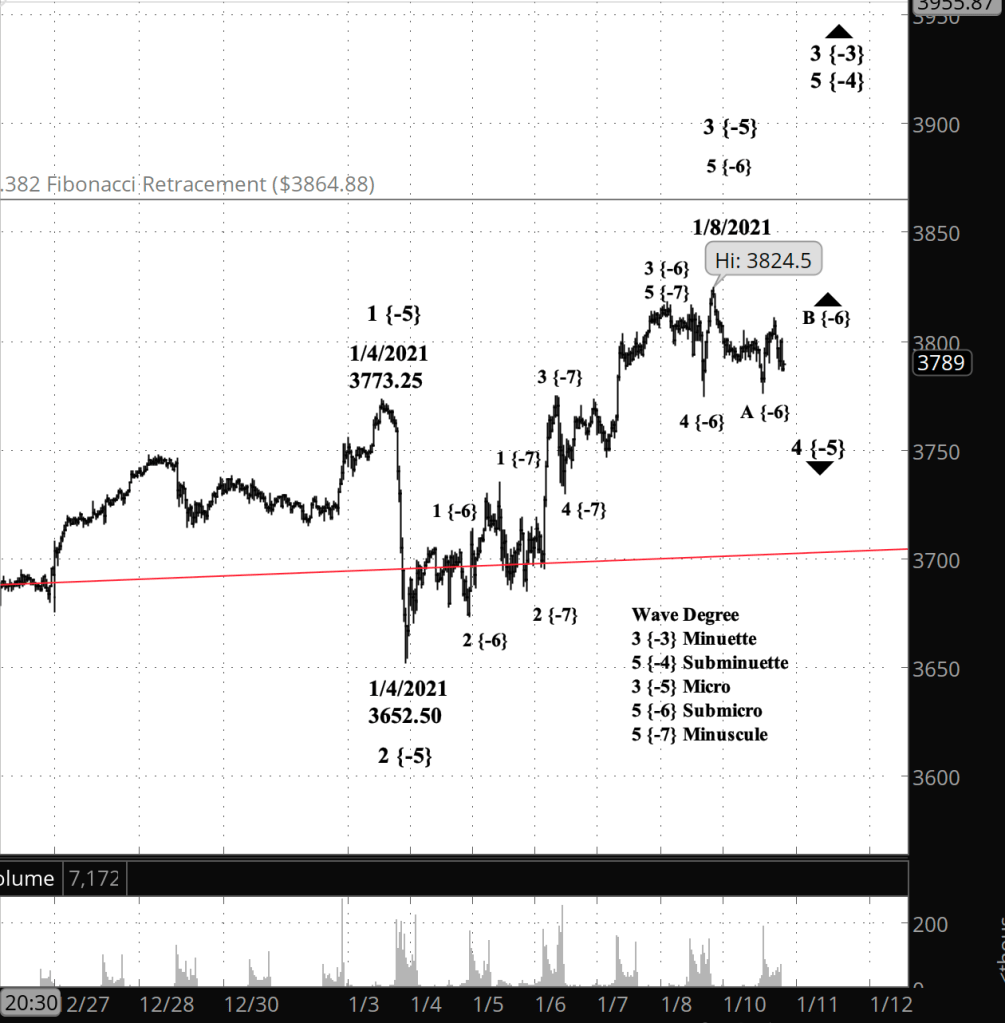
What’s happening now? The S&P 500 E-mini futures fell at the opening, entering the third and final segment of the correction that began January 8.
What does it mean? The end of the correction will be followed by either a rise that will be the end of the uptrend that began January 4, or will rise and form a second corrective pattern in a compound correction.
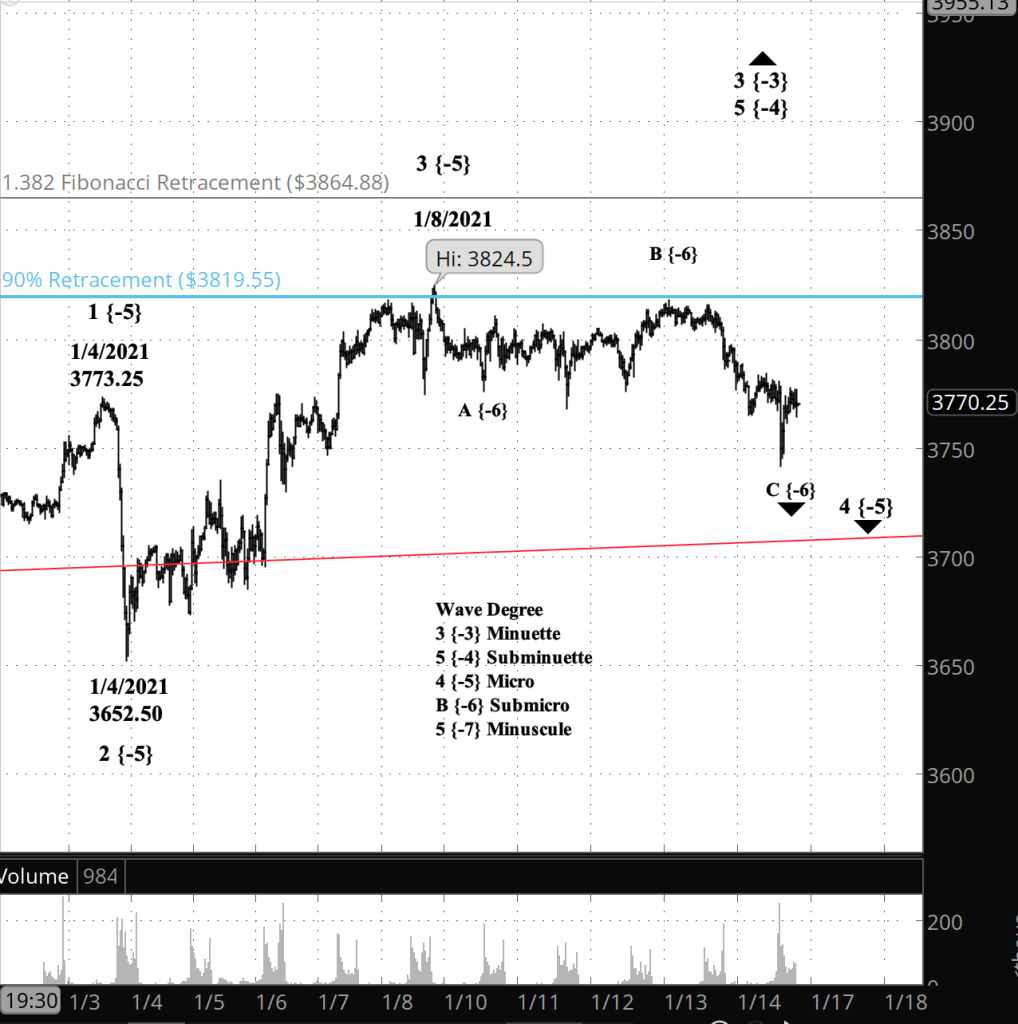
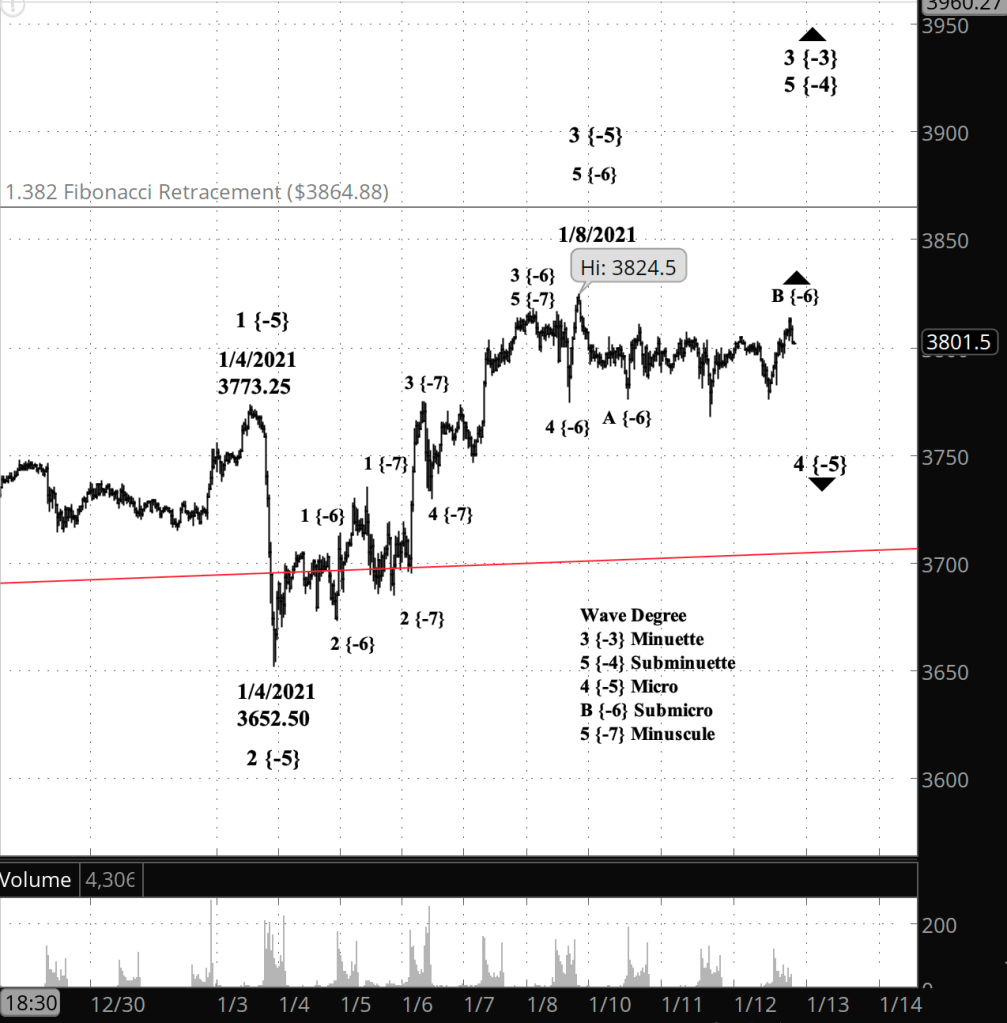
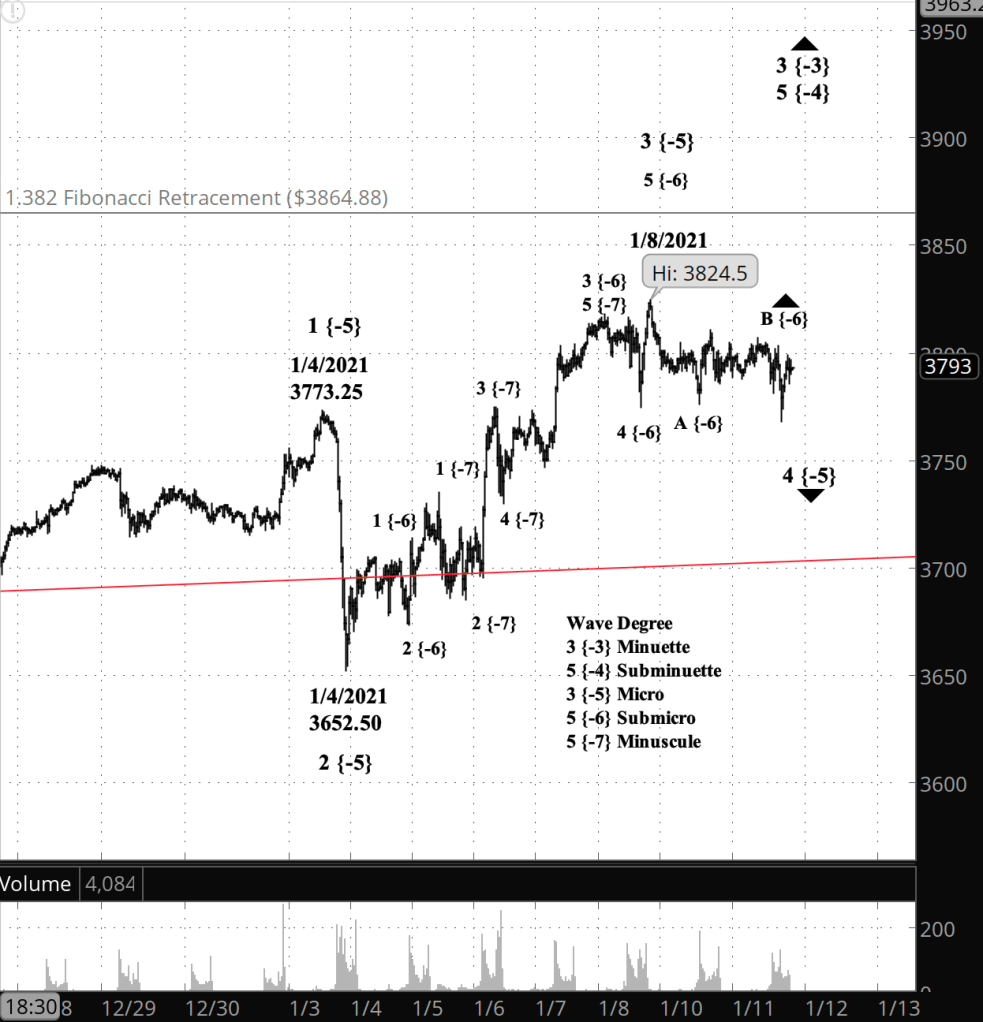
What does Elliott wave theory say? The present wave down is wave C of Submicro degree within wave 4 of Micro degree. The chart contains an anomaly, discussed yesterday, that casts doubt on the wave 4 analysis. Wave B failed to retrace 90% the preceding wave A, which is required under the Elliott wave rules for a Flat pattern.
I can’t see a clear alternative count to the Flat pattern. So perhaps instead of a Flat, the correction is a Zigzag, with 5-3-5 as the pattern within the A, B and C waves.
In any case, the magnitude of the fall suggests that Subminuette wave C has begun, making the question moot. Moving on.
The target for the parent wave, the 4th of Minuette degree, is to move back below the red line, which the upper boundary of a Diagonal Triangle that began in December 2018. So we’re looking at the lower 3700s as a start.
Read More »



You must be logged in to post a comment.