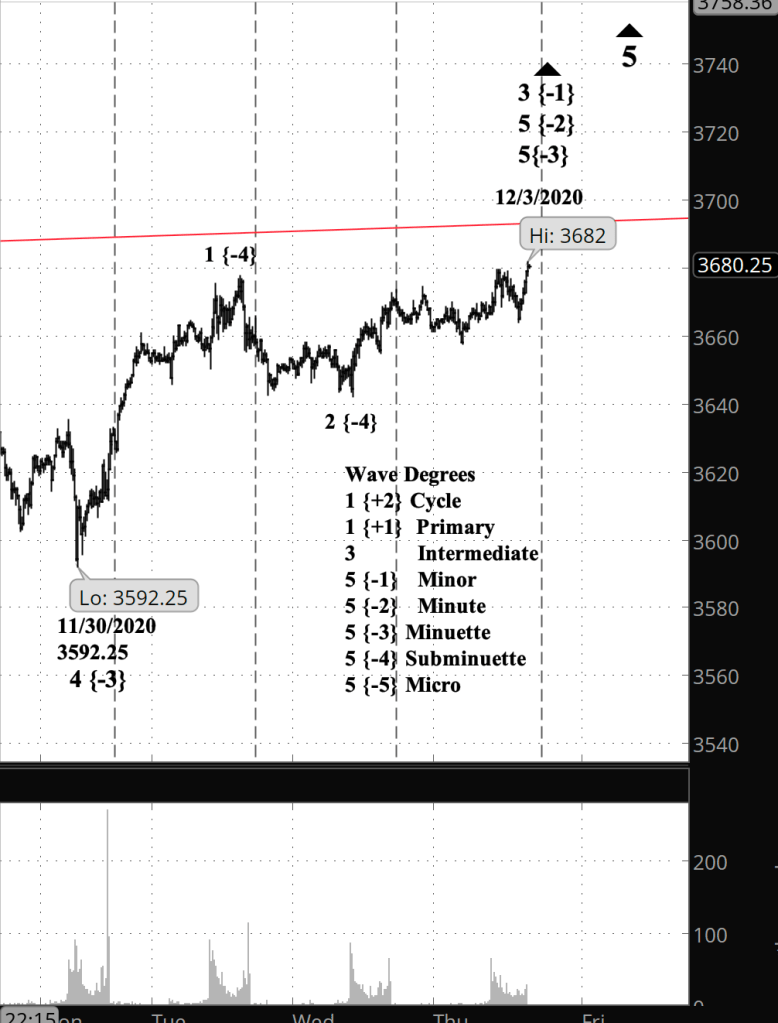
The S&P 500 index and futures moved above their high of December 1, extending the rise of Minor wave 3 and its subwaves. I’ve updated the chart, below, at half an hour before the closing bell.
10 a.m. New York time
What’s happening now? The S&P 500 index and its derivatives has completed one down-wave of five subwaves and one up-wave of three subwaves since the peak of December 1.
What does it mean? The pattern is typical of a downward correction.
[S&P 500 E-mini futures, 15-minute bars, with volume]
What does Elliott wave theory say? The parent wave is a 4th of Minor degree, and the subwaves are A and B of Minute degree (or possibly one degree down, of Minuette degree). Wave B took back most of wave A, which as is typical of B behavior.
My trading strategy. Down is eventually profitable for my short bear call spread options positions, and the pattern shows a downtrend, so I’m in hold mode. Same with my shares of SDS, an inverse exchange-traded fund based on the S&P 500, with a long time horizon.
Half an hour before the closing bell the S&P 500 continues through the early stages of a downward correction, having completed five waves down and three waves up today as steps in the decline. I’ve updated the chart below.
10:35 a.m. New York time
What’s happening now? The S&P 500 index and its derivatives continue to pull back slightly from Tuesday’s high, 3678.45 around the upper boundary of a Diagonal Triangle form that began in December 2018.
What does it mean? The peak ended an upward push that began February 23, 2020 from 2191.86. The next move will be a downward correction and then a final wave to the upside.
What is the alternative? The price remains near the high and it is possible that rather than withdrawing immediately, the price might bounce up to a slightly higher level before beginning its downward movement.
[S&P 500 E-mini futures, 10-minute bars, with volume]
What does Elliott wave theory say? Tuesday’s high marks the end of wave 3 of Minor degree, after two days short of 10 months to the day. What follows is Minor wave 4 to the downside. Fourth wave corrections often tend to trend sideways, suggesting the downward move will be shallow. All of this is happening within Intermediate wave 5, which is one degree higher.
My trading strategy. My short bear call options spreads on IWM, with 44 days until expiration on January 15, continue to hold near the level of their entry credit. Decision day on exiting will come 21 days prior to expiration, on December 25 by the calendar. Since the market will be closed that day, the decision, at the latest, will made on December 23. I continue to hold my shares in the inverse S&P 500 fund SDS.
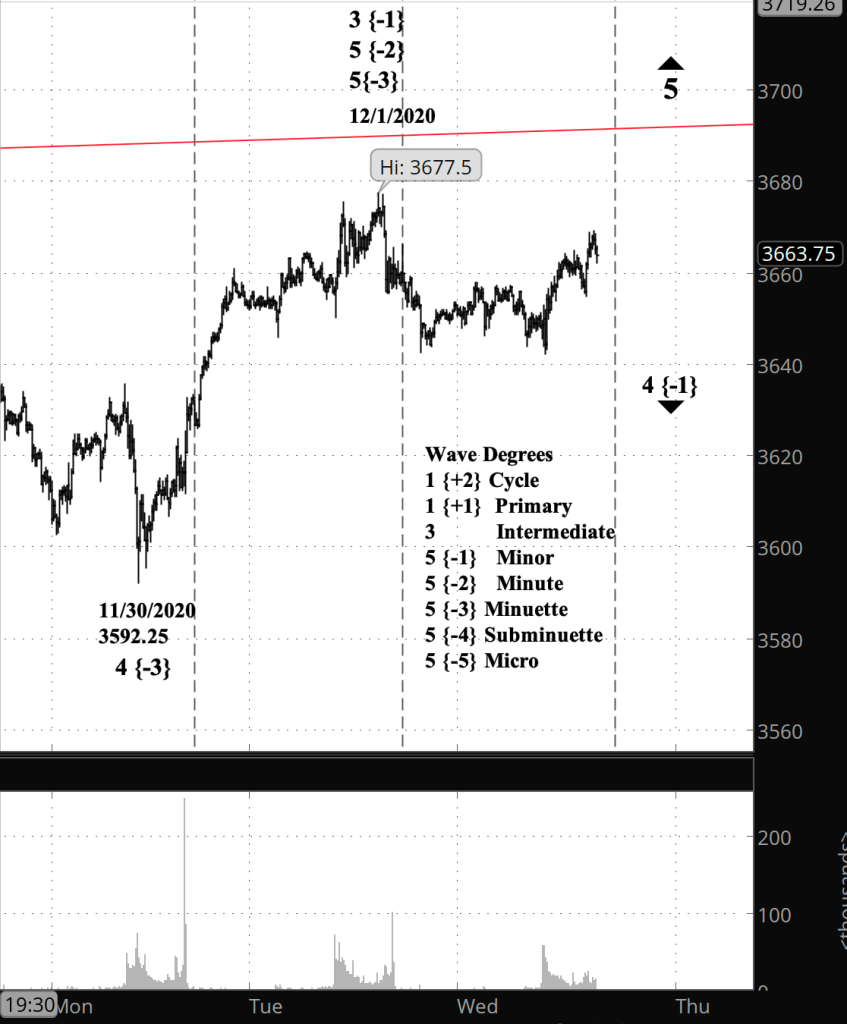
Half an hour before the closing bell the S&P 500 remains about 16 points below its overnight high. Barely changed.
10:45 a.m. New York time
What’s happening now? The S&P 500 index and its derivatives rose rapidly after Monday’s closing bell. The index moved above the upper boundary of the Diagonal Triangle that began in December 2018, a condition known as a throw-over, taking the alternative course described in Monday morning’s analysis. The E-mini futures approached but remained below the boundary.
What does it mean? A throw-over is generally a short-lived condition, suggesting a reversal will soon be at hand.
What is the alternative? The degrees I have on the chart need revisiting — I’ve written before about the ambiguity inherent in labelling degrees, especially early in a trend.
What does Elliott wave theory say? On the chart I’ve moved the end of wave 3 of Minor degree from the previous high, on November 9, to the December 1 high of 3676.22 (so far). Uptrending Minor 3 will be followed by downtrending Minor 4, both being subwaves of uptrending wave 5 of Intermediate degree.
My trading strategy. My short bear call options spread positions remain within what will become the profit zone. As the entry analysis shows, the short call is at $192, which is $7 above the symbol’s high so far of $185.44, set on November 24. If the price exceeds $192, then I will need to make a hold or sell decision. I continue to hold my contrarian shares in SDS; as the S&P 500 rises, they fall. The Elliott wave analysis shows that a decline will happen soon.
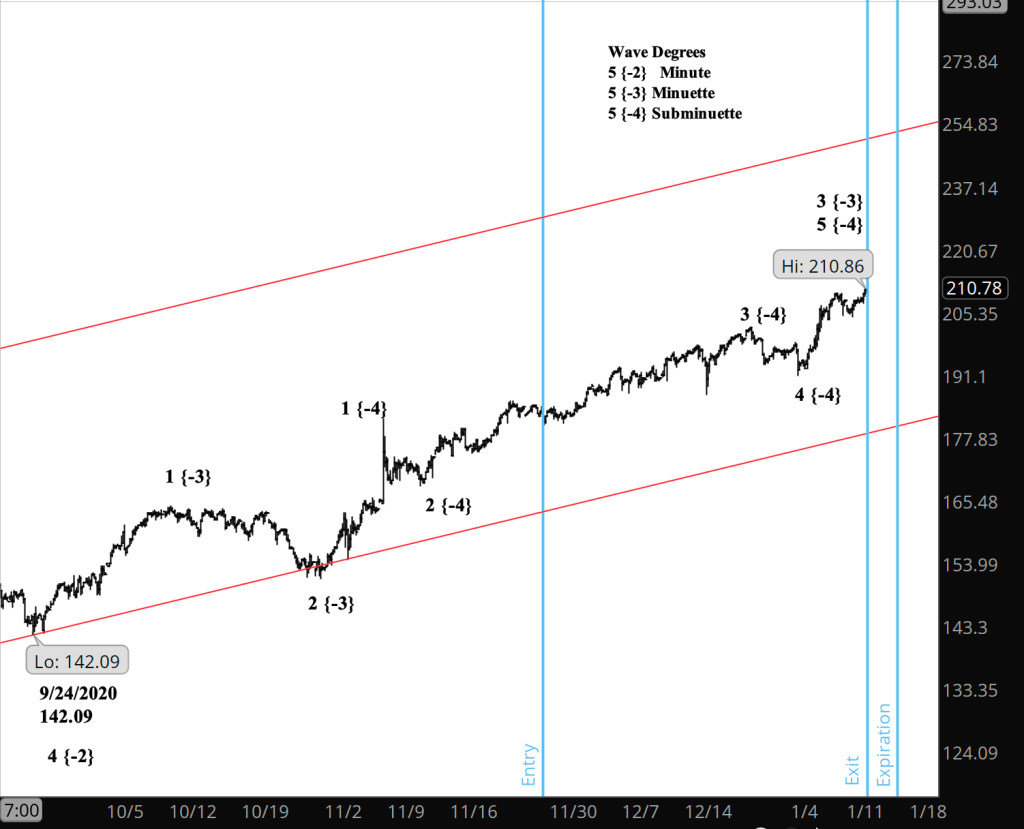
Update 1/12/2021: I exited my bear call options spread position on IWM 15 days before expiration, for a $4.93 debit per contract/share, a loss before fees of $3.85 per contract. Shares were trading at $210.49, up $28.90 from the entry level.
Referring to the chart below, showing IWM with three-hour bars, my decision to enter (blue vertical line to the left) was based on Elliott wave analysis that led me to conclude that a reversal to the downside had begun. What I had taken to be the end of a 5th wave of Subminuette degree turned out to be a subwave that by the time I exited (blue vertical line in the middle) had carried the price well above the zone of profitability. (The blue line to the right shows expiration.)
[IWM, 3-hour bars]
Shares rose by 28.9% over 43 days for a +340% annual rate. The options position produced a 78.1% loss for a -663% annual rate.
Lessons learned:The loss on this trade was compounded by my rule that requires an exit 21 days before expiration for profitable positions. This position was unprofitable at 21 days, and grew even more unprofitable in the last weeks of its life. A better rule would be to exit 21 days before expiration whether a position is profitable or not.
I have entered a short bear call spread on IWM, using options that trade for the last time 46 days hence, on January 15. The premium is a $1.08 credit per contract share and the stock at the time of entry was priced at $181.63.
The implied volatility rank (IVR) stands at 24.8, a bit on the low side.
Premium:
$1.08
Expire OTM
IWM-bear call spread
Strike
Odds
Delta
Calls
Long
197.00
85.0%
18
Break-even
190.92
80.5%
23
Short
192.00
76.0%
27
The premium is 43.2% of the width of the position’s wing. The profit zone covers a 5.1% move to the upside.
The risk/reward ratio is 3.6:1, with maximum risk of $392 and maximum reward of $108 per contract.
My entry decision was based on Elliott wave analysis showing IWM to be at the beginning of a downtrending move, wave 5 of Minute degree within wave 4 of Minor degree.
The S&P 500 took back a bit of its fall today but remains below the Minuette wave 3 peak of November 29. I’ve updated the chart, below.
11 a.m. New York time
I’ve entered short bear call options spreads positions on IWM and posted an analysis. The positions are Lot 2020-2 for IWM.
10:40 a.m. New York time
The S&P 500 E-mini futures have dropped below their low in overnight trading, suggesting that a downward move has begun: Wave 5 of Minuette degree within wave 5 of Minute degree within wave 4 of Minor degree. I’ll start analysis for options entry today rather than tomorrow. Chart below updated at 10:45 a.m. New York time.
9:45 a.m. New York time
What’s happening now? The S&P 500 index and its derivatives continue to meander just below the upper boundary of the Diagonal Triangle that began in December 2018, the structure that has defined much of the market movement for the past two years.
What does it mean? The boundary defines how much upside is in the market. The S&P 500 E-mini futures are about 60 points below the boundary, a condition suggesting that the prospect for the next month or more is a downward move.
What is the alternative? Prices sometimes extend beyond the boundary, although the condition, called a throw-over, is short-lived.
[S&P 500 E-mini futures, 30-minute bars, with volume[]
What does Elliott wave theory say? The index is in the early stages of a downtrending 4th wave correction of Minor degree within a 5th wave of Intermediate degree. The 5th wave, when complete, will mark the end of the rise that began in 1974.
The close-up view, in the chart, shows the index tracing a downtrending 4th wave of Minute degree — down one from Minor — that is either in its 3rd wave of Minuette degree or a Minuette X wave subdividing a complex correction.
My trading strategy. Tuesday, December 1, is 45 days before the January options expire, on the 15th, making it the optimal day for entry. I’ll wait until tomorrow to decide on entering options positions. I’m leaning toward short bear call options spreads as my vehicle.
My share positions are all in SDS, an S&P 500 derivative that grows in value as the index declines.
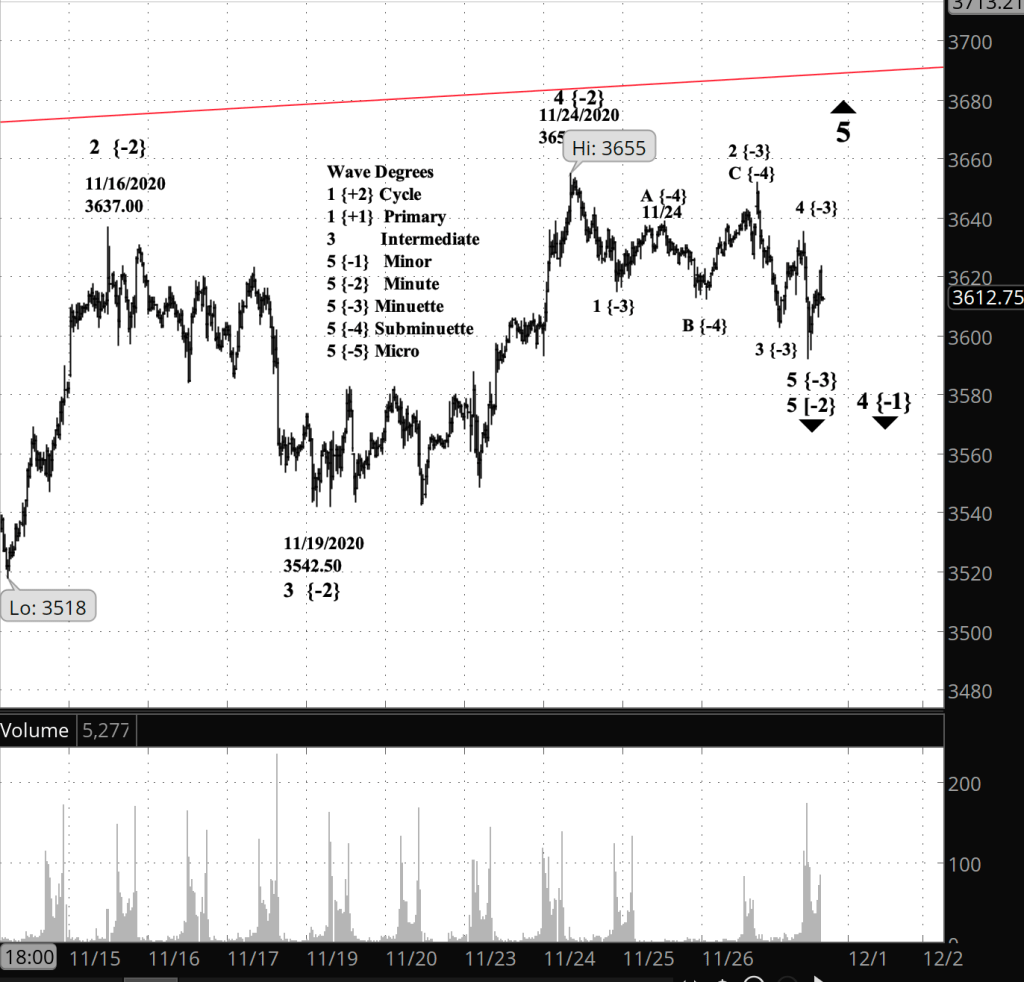
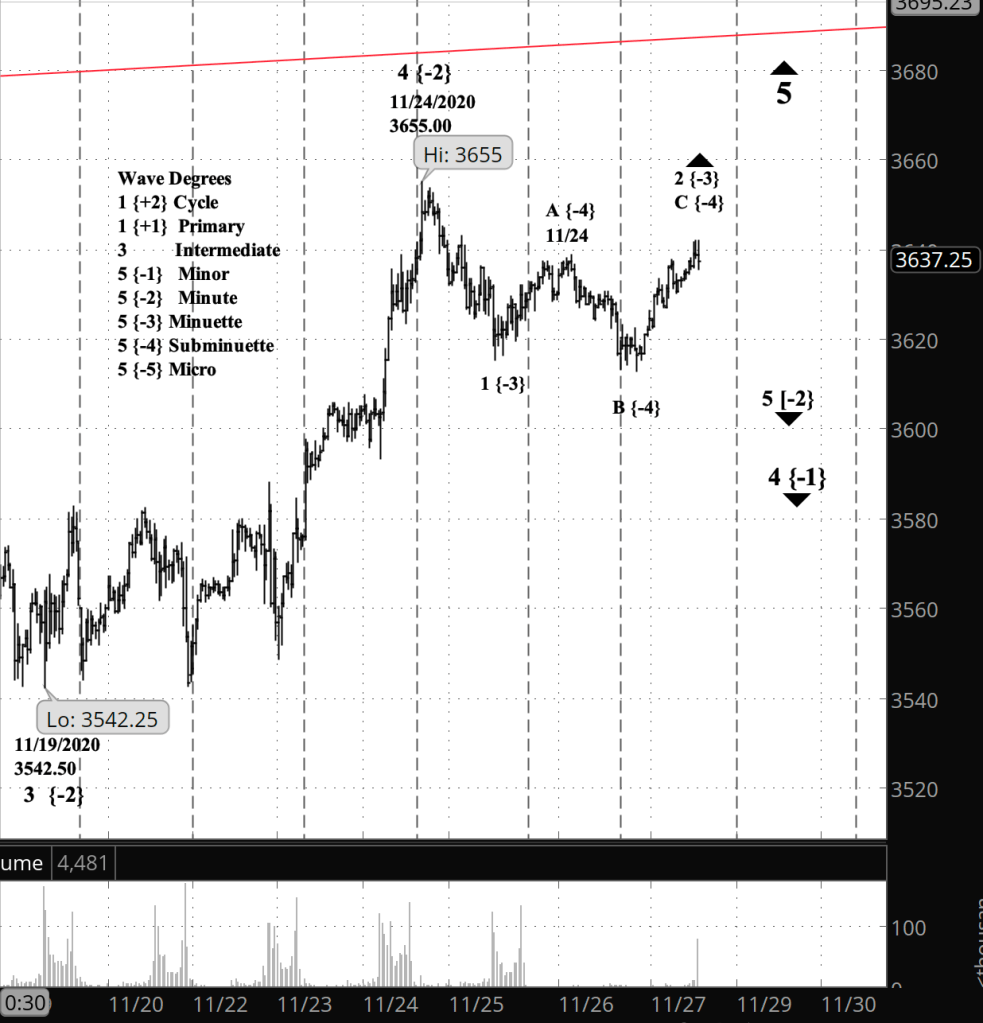
What’s happening now? The S&P 500 rose again during holiday trading of the E-mini futures, exceeding the high of November 26.
What does it mean? The upward correction that began November 24 continues and is now in its third wave. That wave should be almost over, and will be followed either a resumption of the downtrend or a separator wave that portends a complex correction pattern.
[S&P 500 E-mini futures, 30-minute bars, with volume]
What does Elliott wave theory say? The present downtrend is Minor wave 4, and the present subwave is Minute wave 5 to the downside. That 5th wave is working through its 2nd subwave, of Minuette degree, an upward correction within the downtrend. The present rise within Minuette 2 is wave C of Subminuette degree. Following C’s completion, the next move will either be the beginning of Minuette wave 3 or a Minuette wave X, the latter being a dividing wave within a complex correction pattern. Second waves tend to be simple — A, B, C and done — and so I think the most likely outcome will be the start of Minuette wave 3.
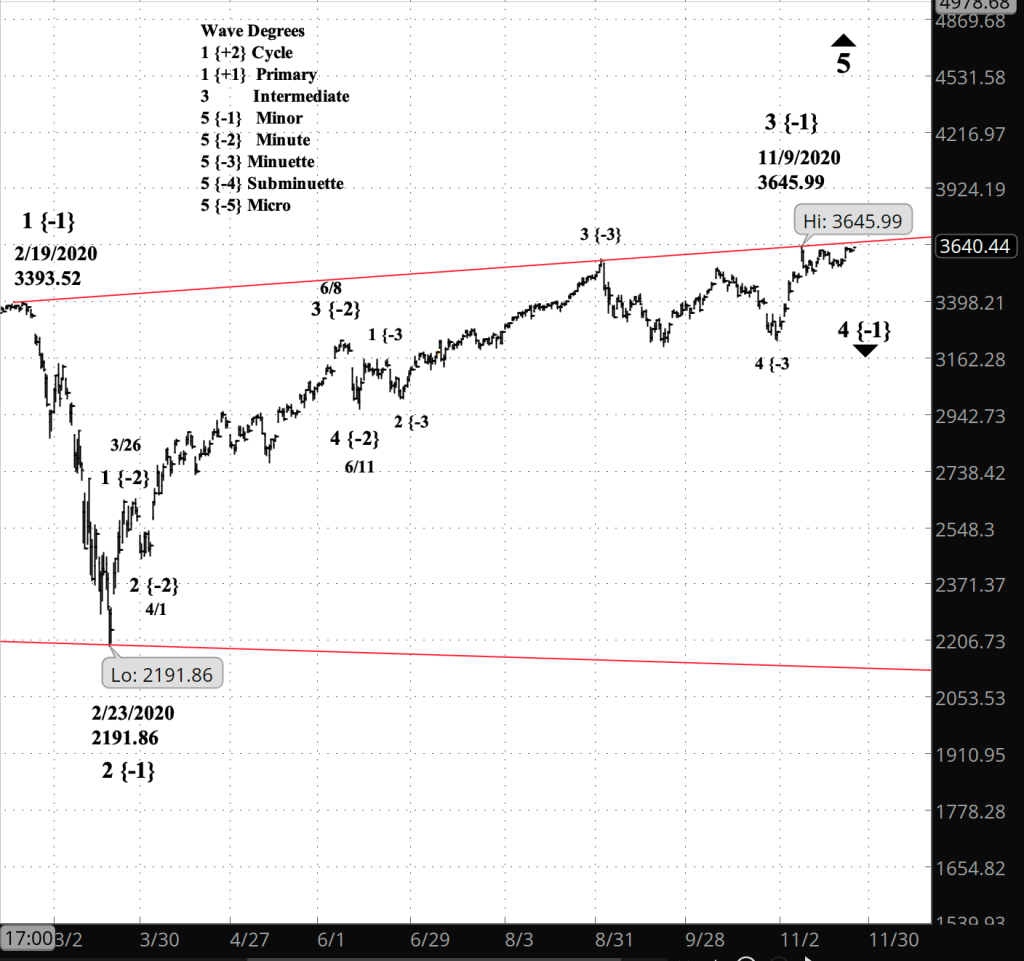
[S&P 500 index, 4-hour bars]
Big picture, the price is still hugging the upper boundary (red line) of the Diagonal Triangle that began in December 2018. The smaller movements described above are all within Intermediate wave 5, which can be expected to carry the price down to the triangle’s lower boundary, presently at 2135 and continuing its gradual decline.
My trading strategy. On Monday I plan to think of entering options position that expire in January, most likely using IWM, which tracks the Russell 2000 index, as my vehicle. I’m continuing to hold my shares in the bear-oriented fund SDS.
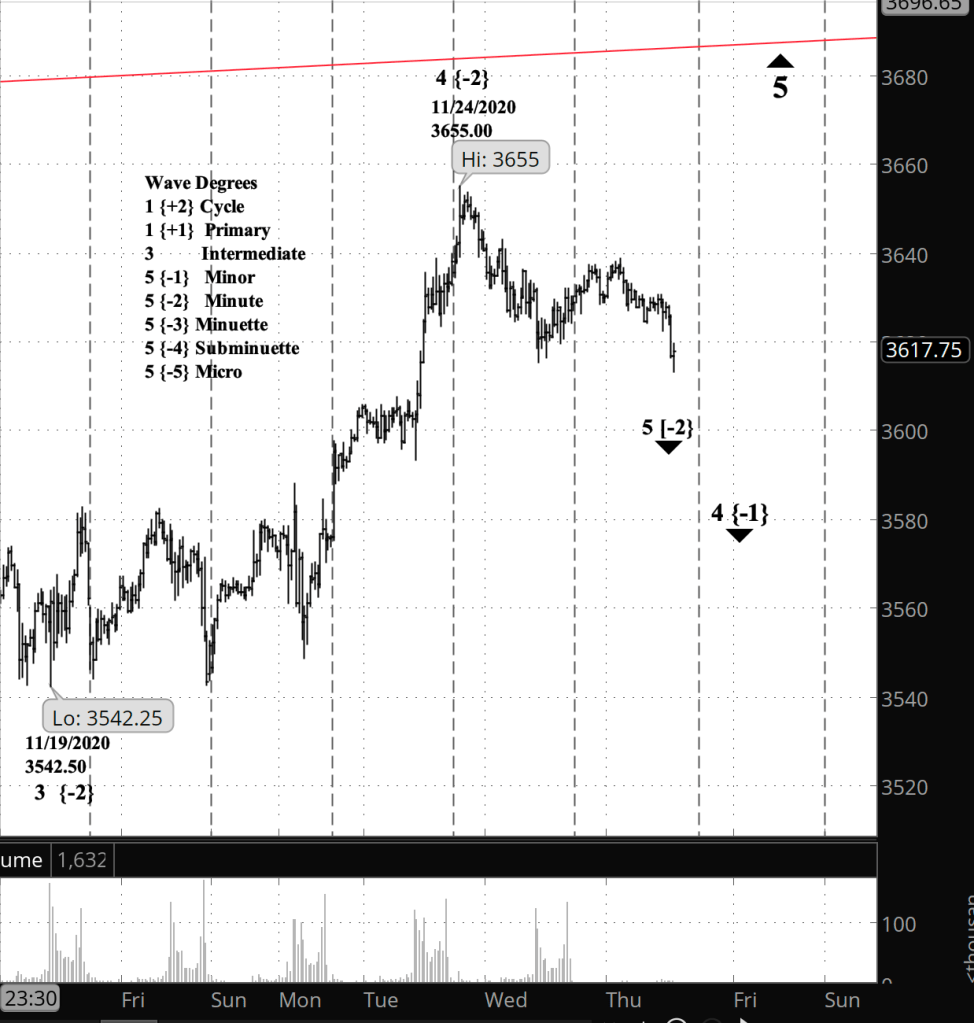
What’s happening now? U.S. stock and bond markets are closed for the Thanksgiving Day holiday. During a shortened trading day, ending at 1 p.m. New York time, the S&P 500 E-mini futures fell to a new low since the November 24 peak.
What does it mean? The new low increases the likelihood that a significant descent is now underway.
What is the alternative? It’s possible that the upward correction that began November 19 is still underway.
[S&P 500 E-mini futures, 30-minute bars, with volume]
What does Elliott wave theory say? The likelihood is that Minute wave 5 of Minute degree is underway, possibly the final wave of Minor wave 4 to the downside, although 4th waves have a tendency to extend.s
My trading strategy. At present, staying out of options and holding on to my bear-oriented shares in SDS.
Half an hour before the closing bell, the S&P 500 E-mini futures remain above their low set in the first half hour of trading. I’ve updated the chart below.
Holiday schedule. Thursday is a holiday in the United States and the stock exchanges will be closed. The closing bell will ring three hours early on Friday, at 1 p.m. New York time.
10:10 a.m. New York time
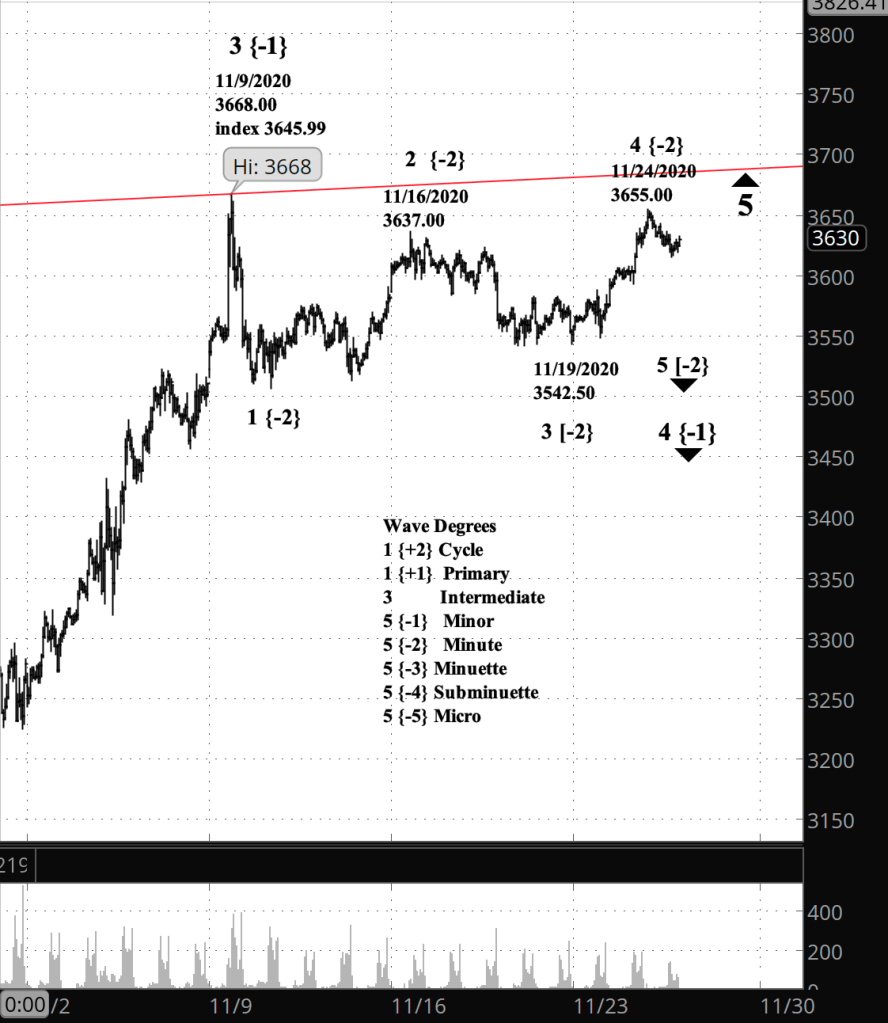
What’s happening now? The S&P 500 index and its E-mini futures completed an upward correction that began November 19 and began a decline.
What does it mean? The downward movement, when complete, will mark the end of a larger downward correction.
[S&P 500 E-mini futures, hourly bars, with volume]
What does Elliott wave theory say? Minute wave 4 ended on Tuesday at 3655 on the futures — 3642.31 on the index — and began to decline as Minute wave 5. The end of Minute 5 will also mark the end of Minor wave 4, a downward correction that began November 9 from 3668 on the futures, or 3645.99 on the index. Minor 4 is the penultimate subwave of Intermediate wave 5 to the upside.
My trading strategy. I’m playing the Minor degree for options, so I need to see Minor for reach its end before entering a position. I’m playing the Primary degree — two degrees up from Minor — and am continuing to hold my positions.
Although the Dow Jones Industrial average moved above its high of November 9, the end of Minor wave 3 to the upside, neither the S&P 500 nor the index-based E-mini futures have exceeded that level. I’ve updated the E-mini futures chart below.
9:45 a.m. New York time
Holiday schedule. Thursday is a holiday in the United States and the stock exchanges will be closed. The closing bell will ring three hours early on Friday, at 1 p.m. New York time.
What’s happening now? The S&P 500 E-mini futures rose slightly overnight, continuing the upward correction that began November 19.
What does it mean? The upward correction will most likely stay below the upper boundary (red line on the chart) of the expanding Diagonal Triangle that began in December 2018. Presently the boundary is at 3674 plus change.
[S&P 500 E-mini futures, hourly bars, with volume]
What does Elliott wave theory say? The upward correction is wave 4 of minute degree within downtrending wave 4 of Minute degree, which began November 9. One degree higher is wave 5 of Intermediate degree, which began December 26, 2018.
My trading strategy. I’m reluctant to enter new options positions during the holiday week, since traders taking time off results in lower liquidity and in turn means a higher likelihood of surprises. So I’ll turn to analyzing new positions on Monday. I’ll continue to hold my shares in the bearish exchange-traded fund SDS.
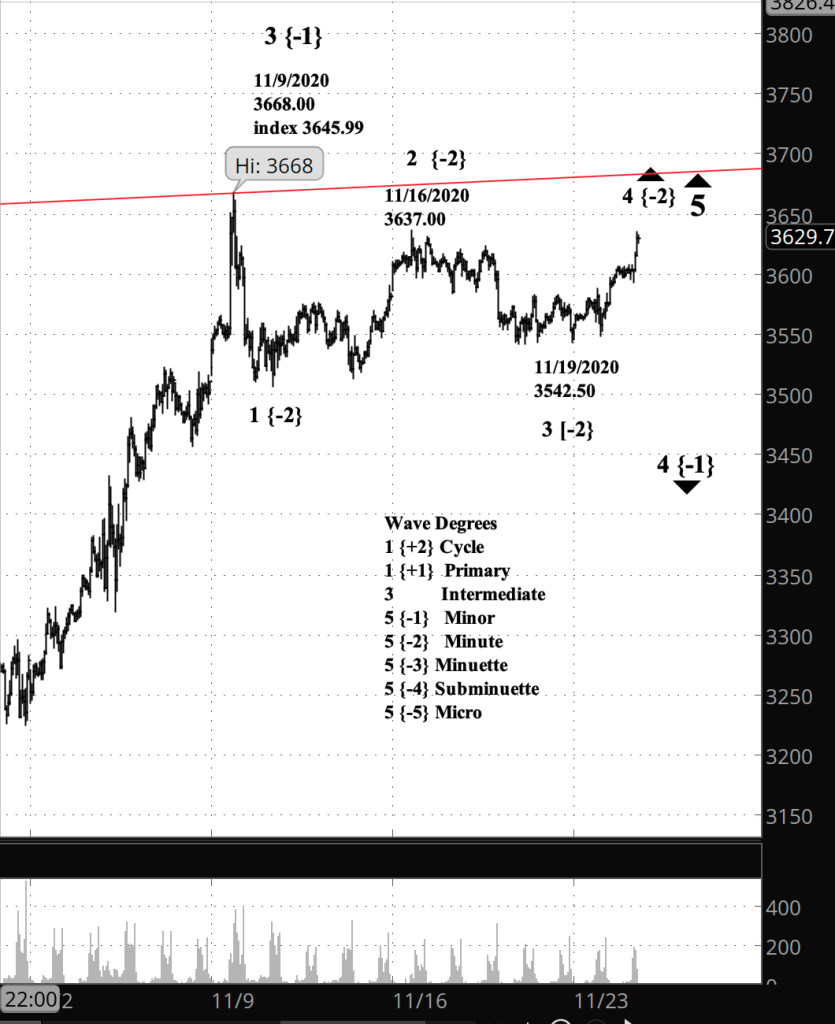
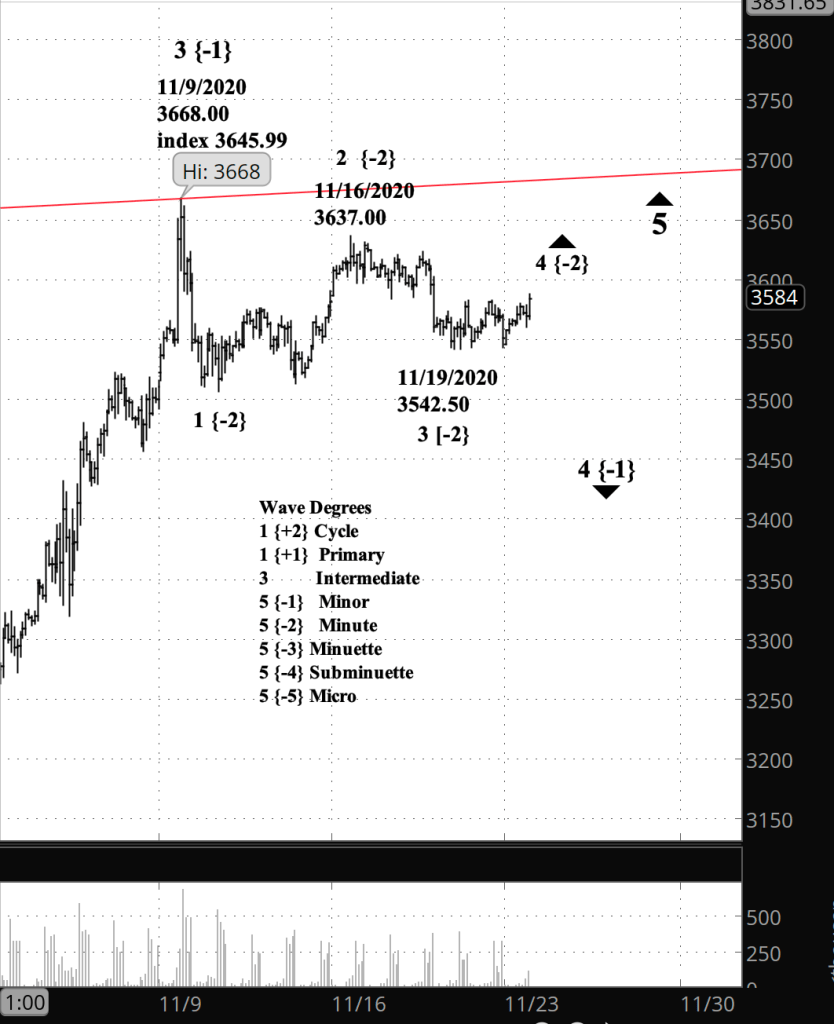
What’s happening now? The S&P 500 index continues a largely sideways movement within an upward correction that is in turn part of a downward correction.
What does it mean? Having touched the upper boundary (red line) of the Diagonal Triangle that began in December 2018, the price is now working its way down in a move that will eventually reach the lower boundary, which is presently in the vicinity of 2125.
About the chart. I’ve moved the subwaves of the correction up a couple of degrees, so that what had been labelled the Subminuette degree {-4} is now labeled the Minute degree {-2}. The ambiguities are still in place, but as the parent wave plays out, the new labeling seems increasingly more likely. If events lower the likelihood, then I’ll change the degree structure in my analysis.
[S&P 500 E-mini futures, with volume]
What does Elliott wave theory say? The present sideways motion is wave 4 of Minute degree, an upward correction, within wave 4 of Minor degree, a downward correction, both within uptrending wave 5 of Intermediate degree.
My trading strategy. By my rules the entry period for the options that expire January 15 begins tomorrow and will run through December 8, and I’ll be considering whether to enter and what vehicle to use in light of my Elliott wave analysis. I know that Minor wave 4 will carry the price lower, and that’s the wave I would want to catch. Except it’s a 4th wave, which can be tricky, if the the variety of forms they take. A short iron condor is one possibility, if I can construct it with a sufficiently wide zone of profit. My stocks, which are in the bear fund SDS: I’m continuing to hold them in anticipation of a decline to the lower boundary of the Diagonal Triangle.



You must be logged in to post a comment.