3:30 p.m. New York time
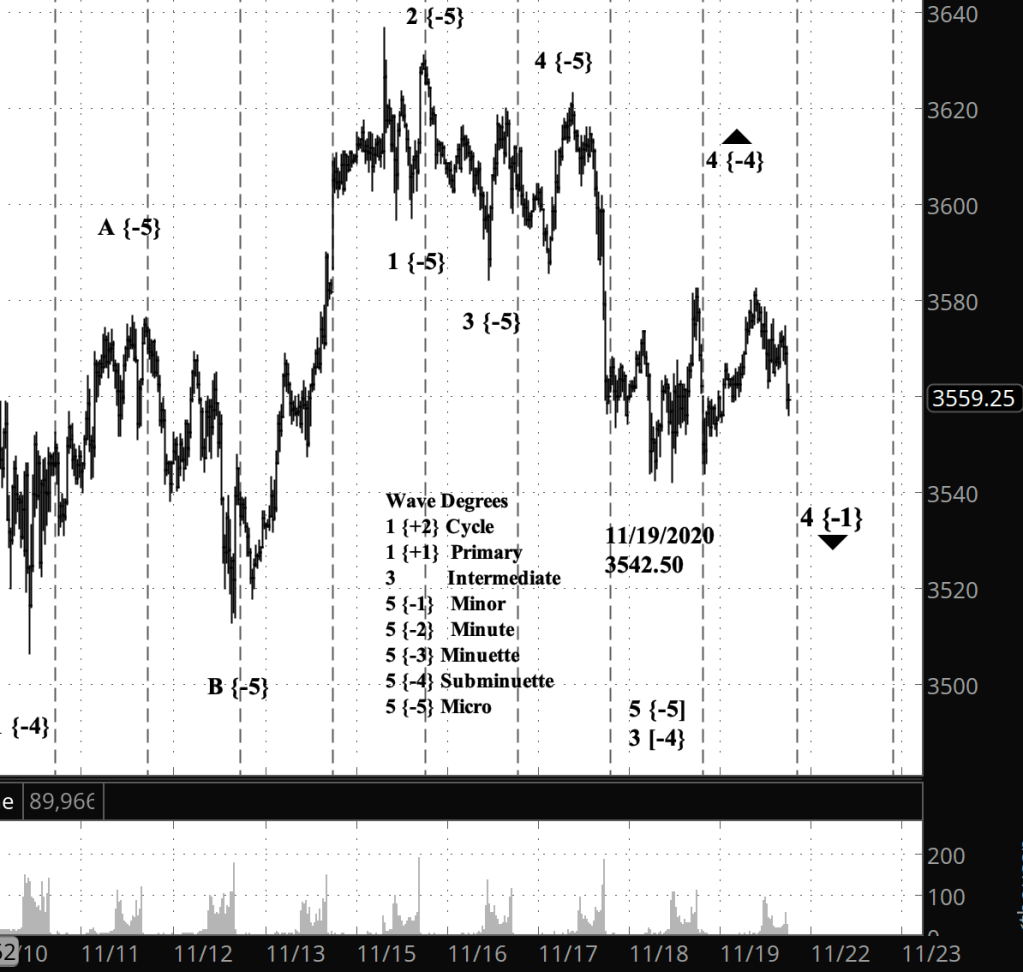
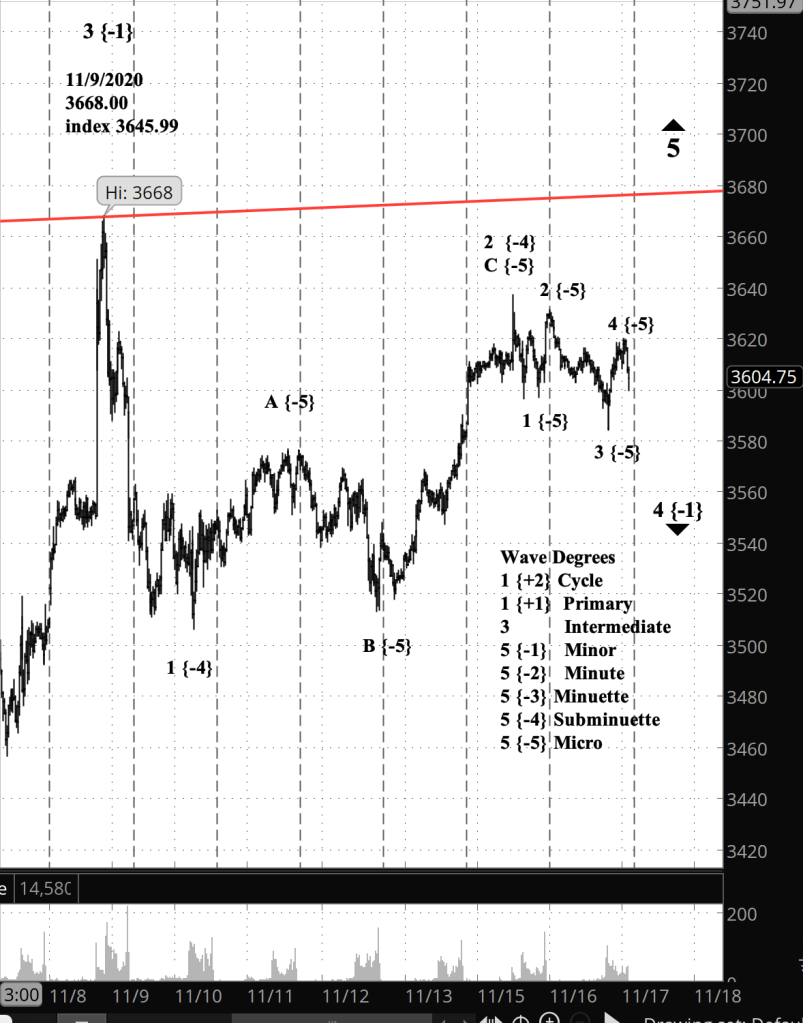
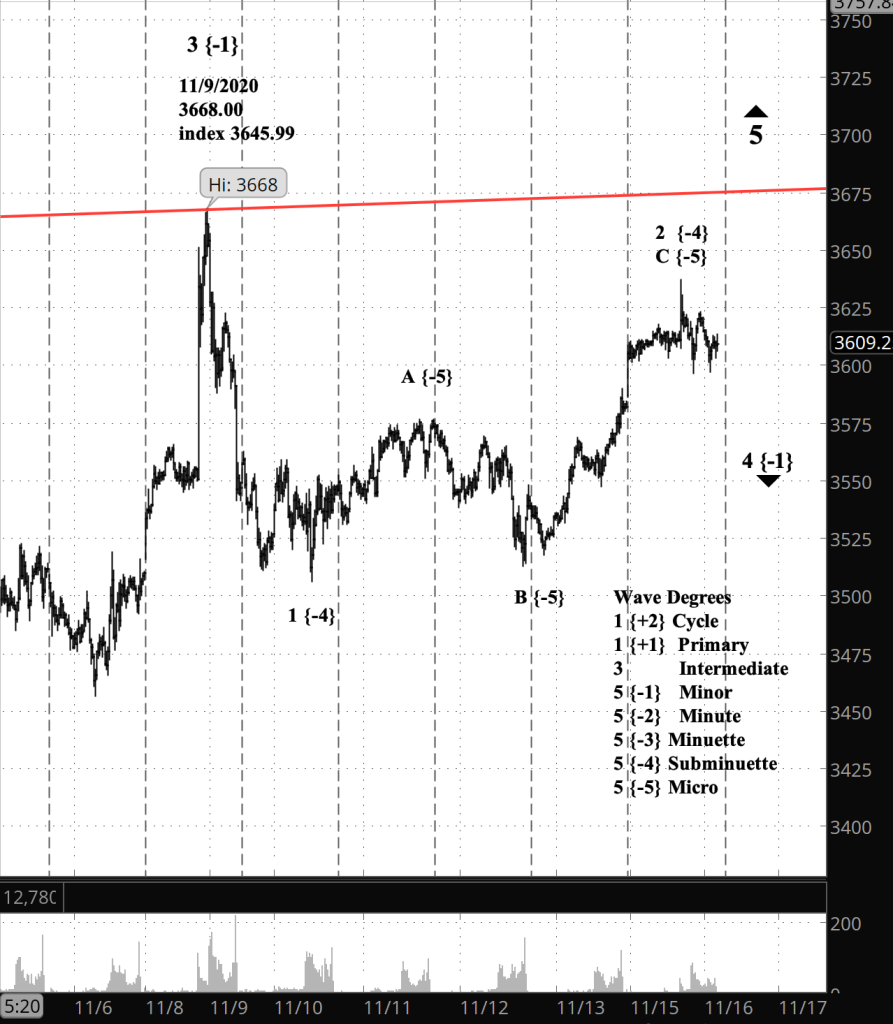
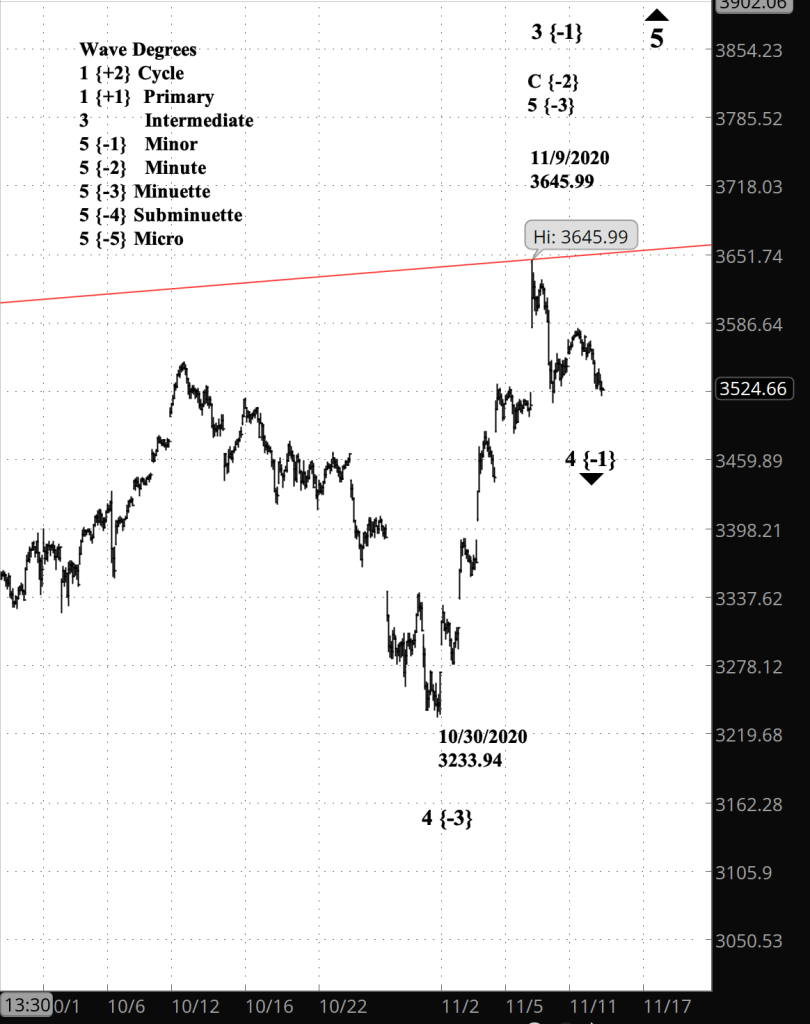
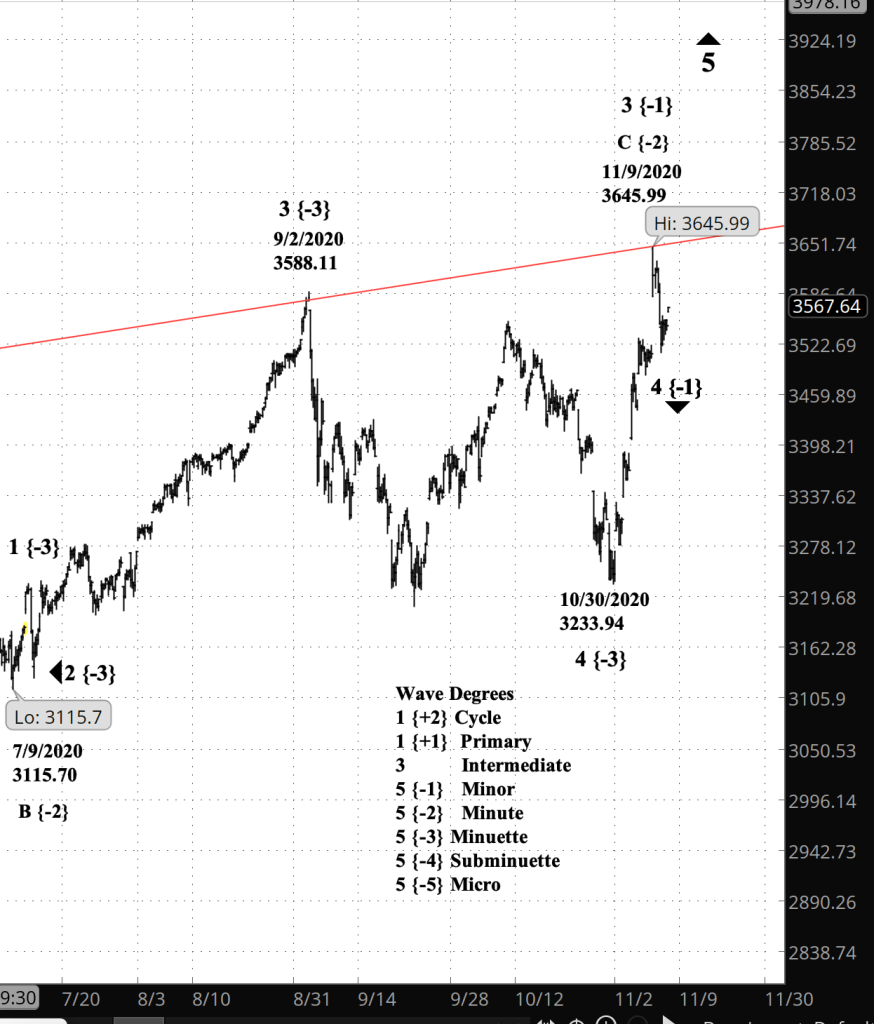
Half an hour before the closing bell, the S&P 500 index and investments based on it continue to work through the Subminuette wave 4 upsdice correction.
9:55 a.m. New York time
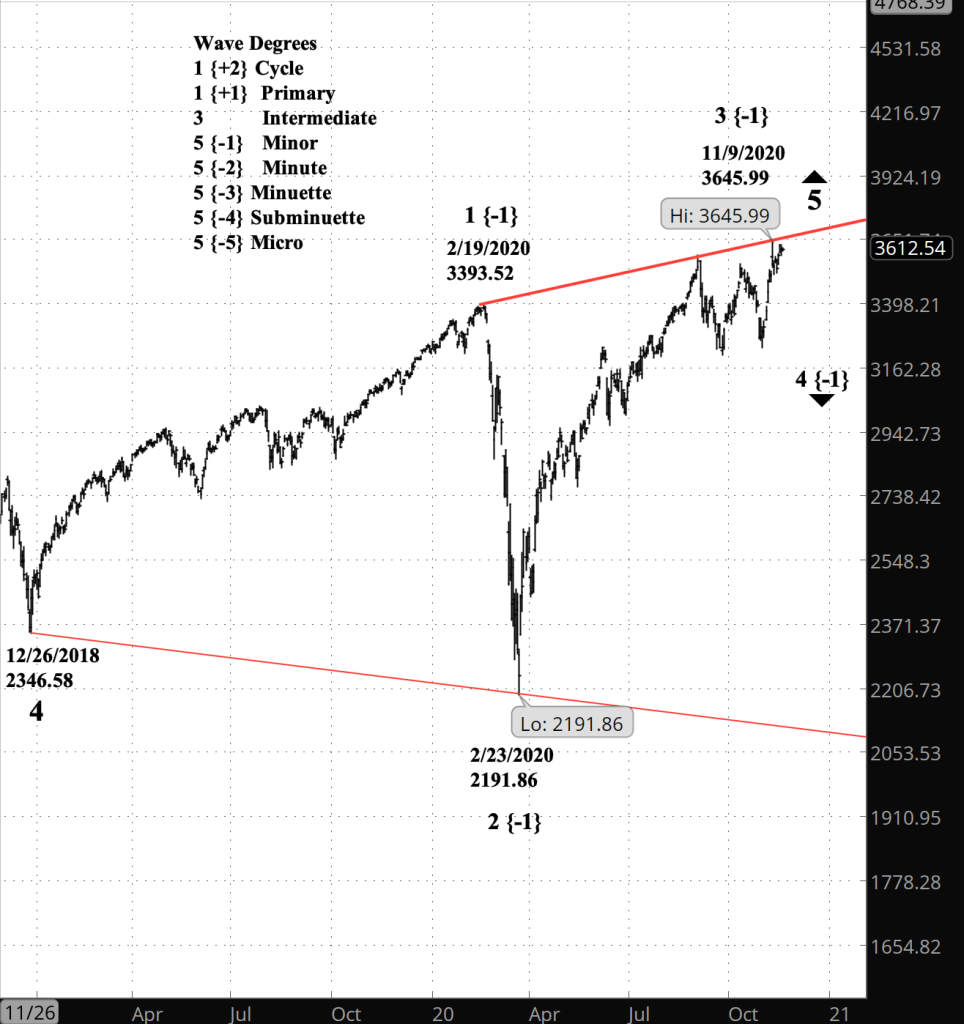
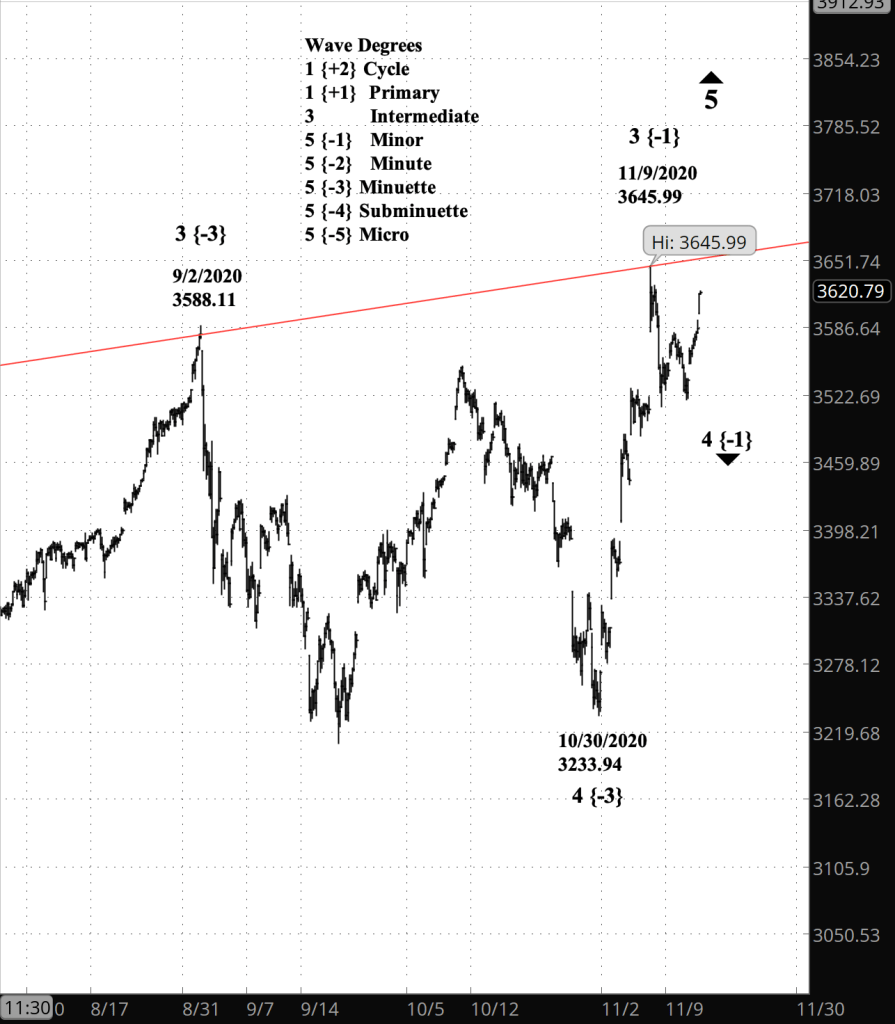
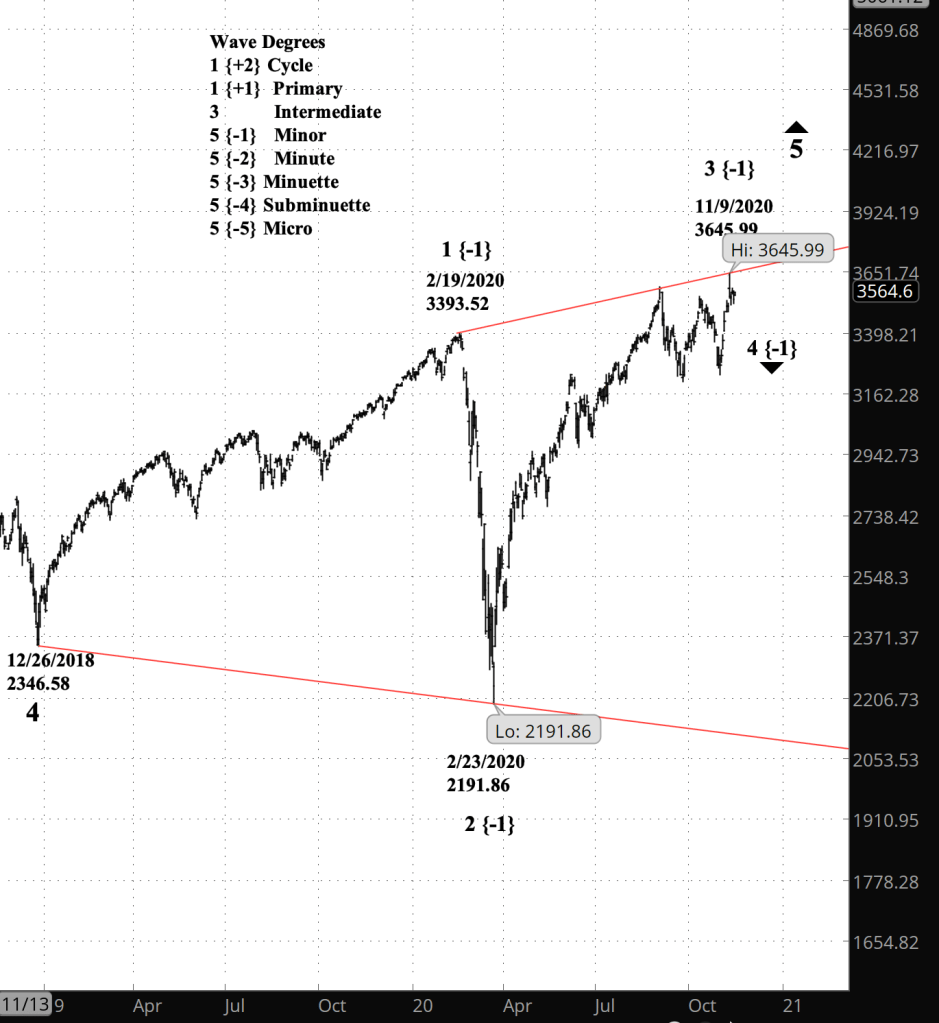
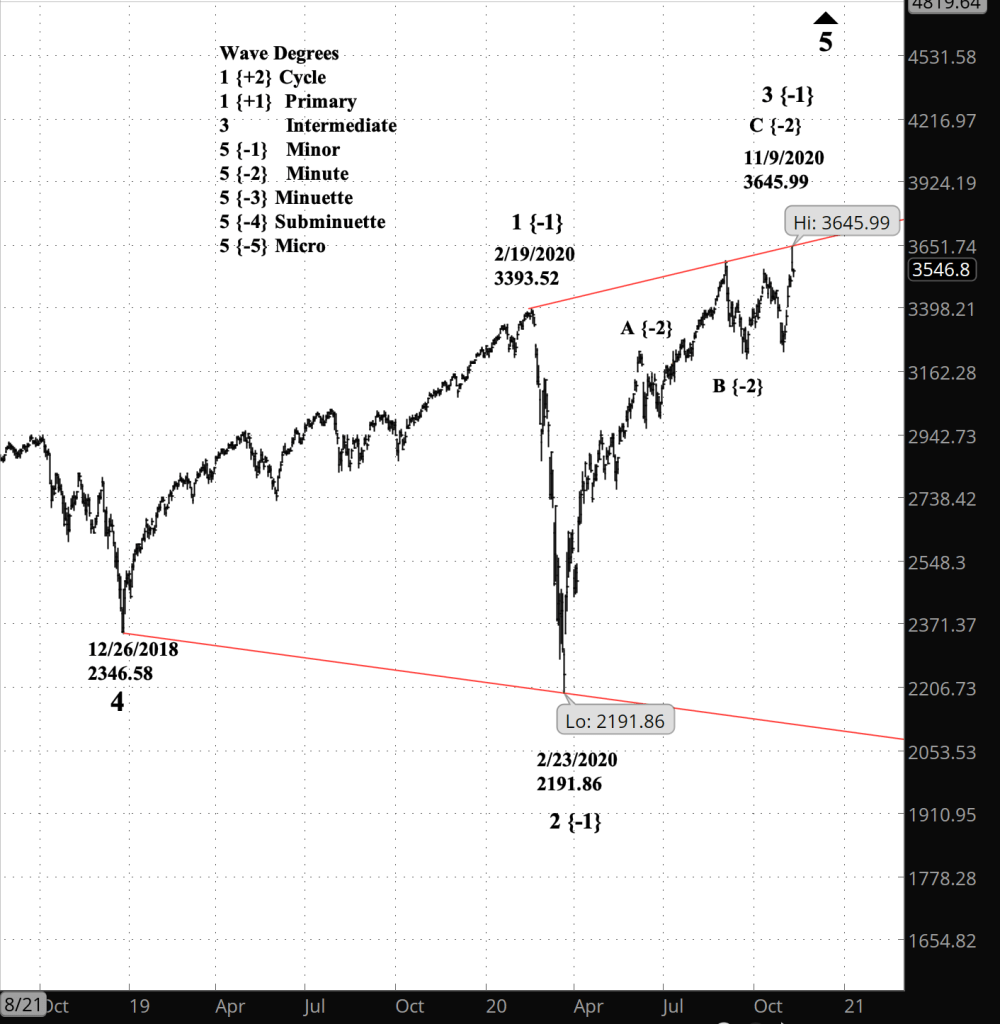
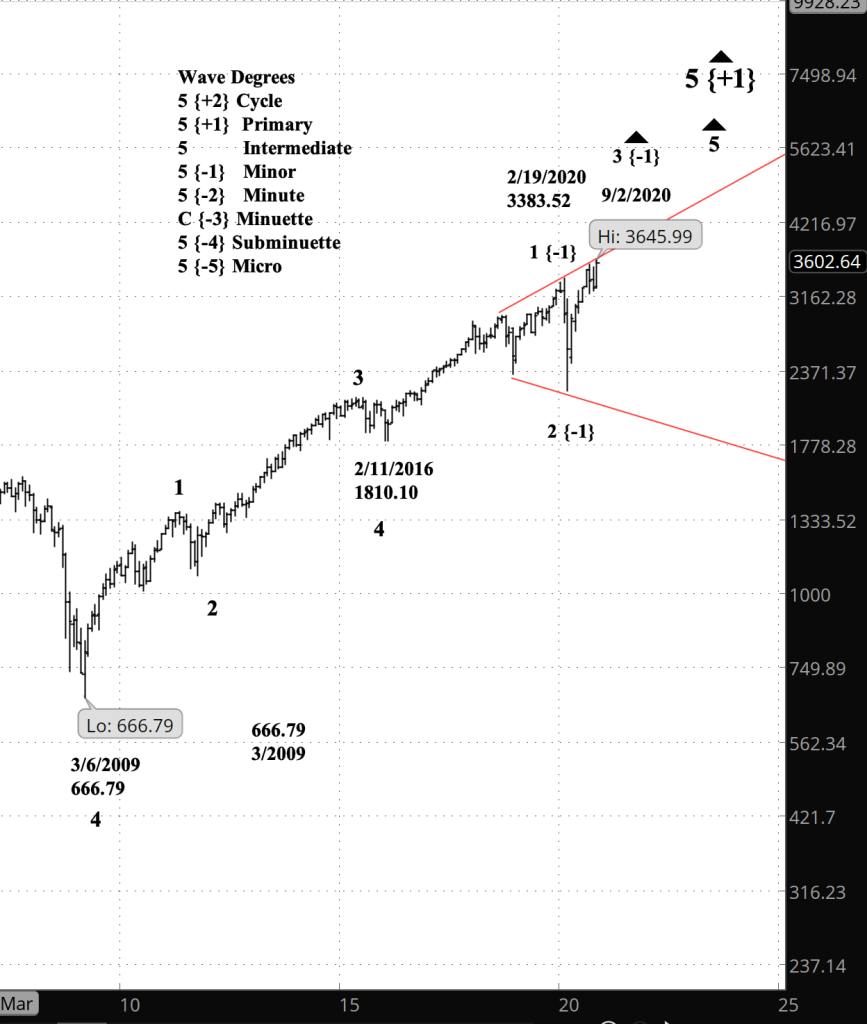
What’s happening now? The S&P 500 index continues to work through the very early stages of a decline that will eventually carry it from present levels in the 3500s down to the 2100s or below.
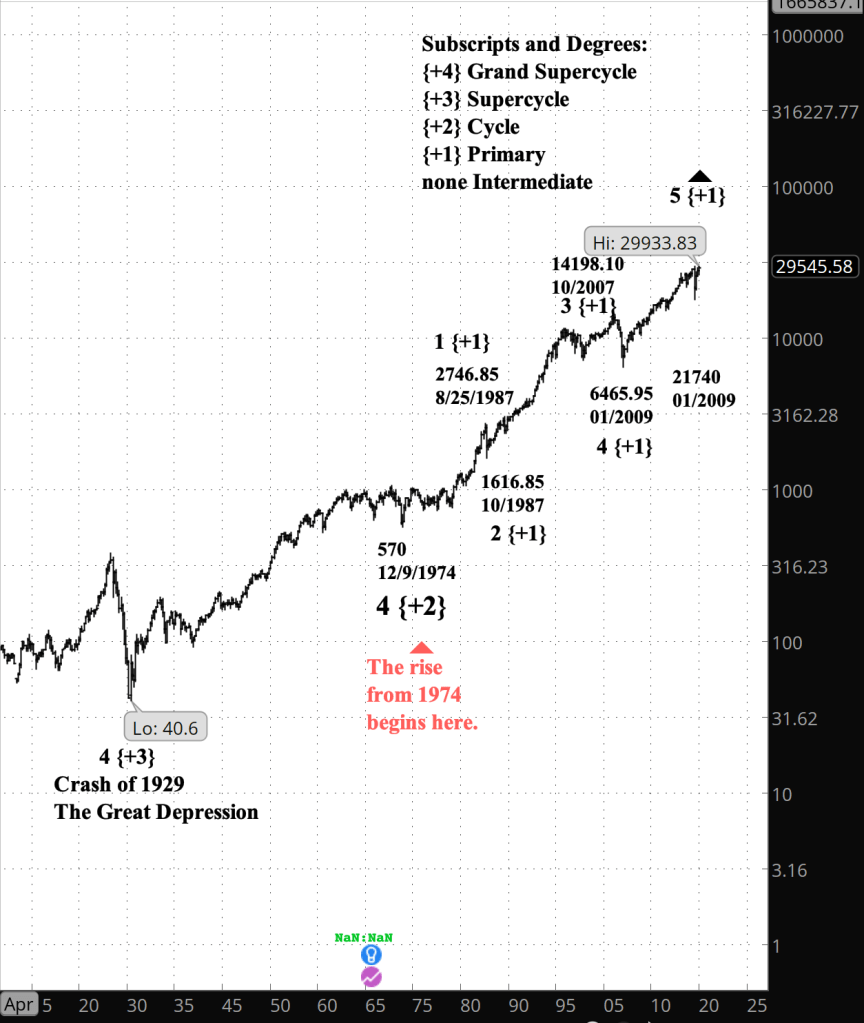
What does it mean? The pattern unfolding since December 2018 has been an expanding Diagonal Triangle. The present decline will eventually carry down to the Triangle’s lower boundary, and that then climb back up to the upper boundary to complete the pattern, and indeed to complete all of the market’s rise since the mid-20th century. (The boundaries are shown on the chart as red lines.)
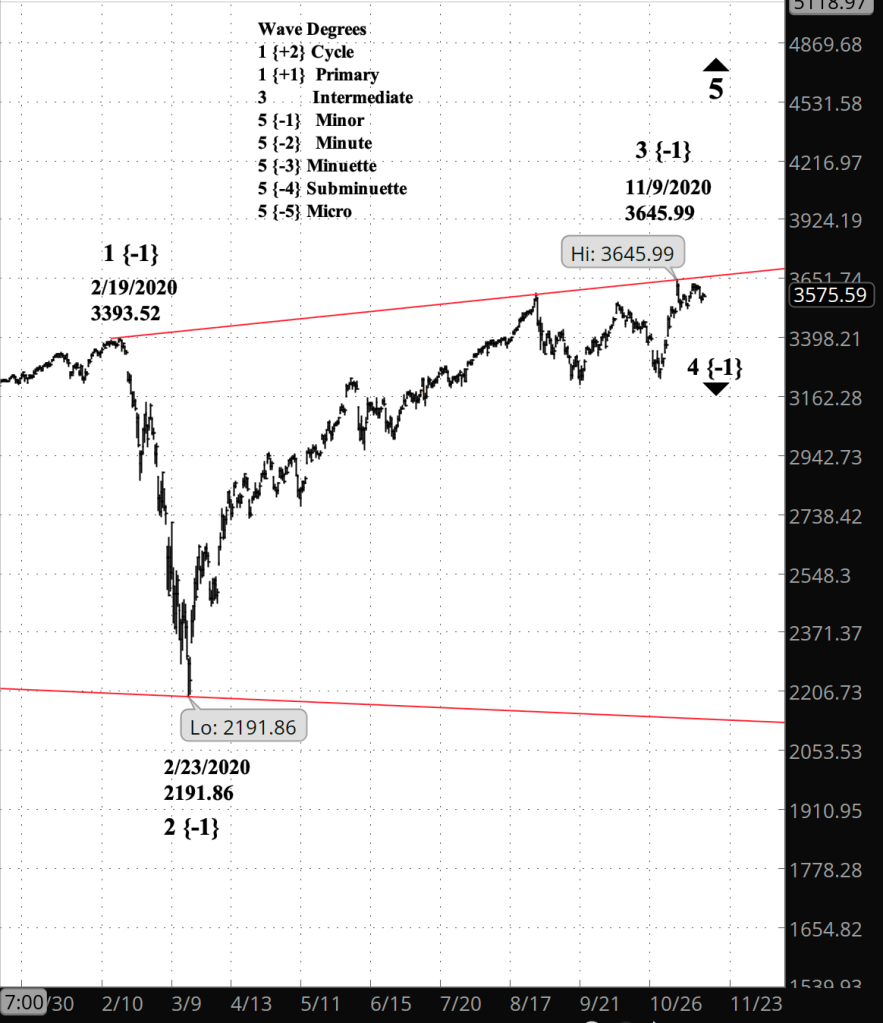
What does Elliott wave theory say? The present decline is Minor wave 4, a subwave of Intermediate wave 5 within 5th waves of Primary and Cycle degree. This chart, going back to the beginning of 2020, shows how small a movement there has been so far. Early days.
My trading strategy. I’m out of options at present. The analysis shows very limited prospects to the upside and significant likelihoods to the downside. A clear acceleration of Minor wave 4 to the downside will be my signal to start trading short bear call options spreads. Regarding shares in the bear-oriented exchange-traded fund SDS: The end of Minor wave 4 could be a selling opportunity. The idea would be to ride Minor 4 to the lower boundary, take profits, and switch to a bull-oriented fund to ride Minor 5 to the upper boundary.
Read More »


You must be logged in to post a comment.