3:30 p.m. New York time
The S&P 500 has barely budged since peaking this morning after a rise that began overnight with the futures. The rise forced a reworking of my analysis See the new analysis here.
9:50 a.m. New York time
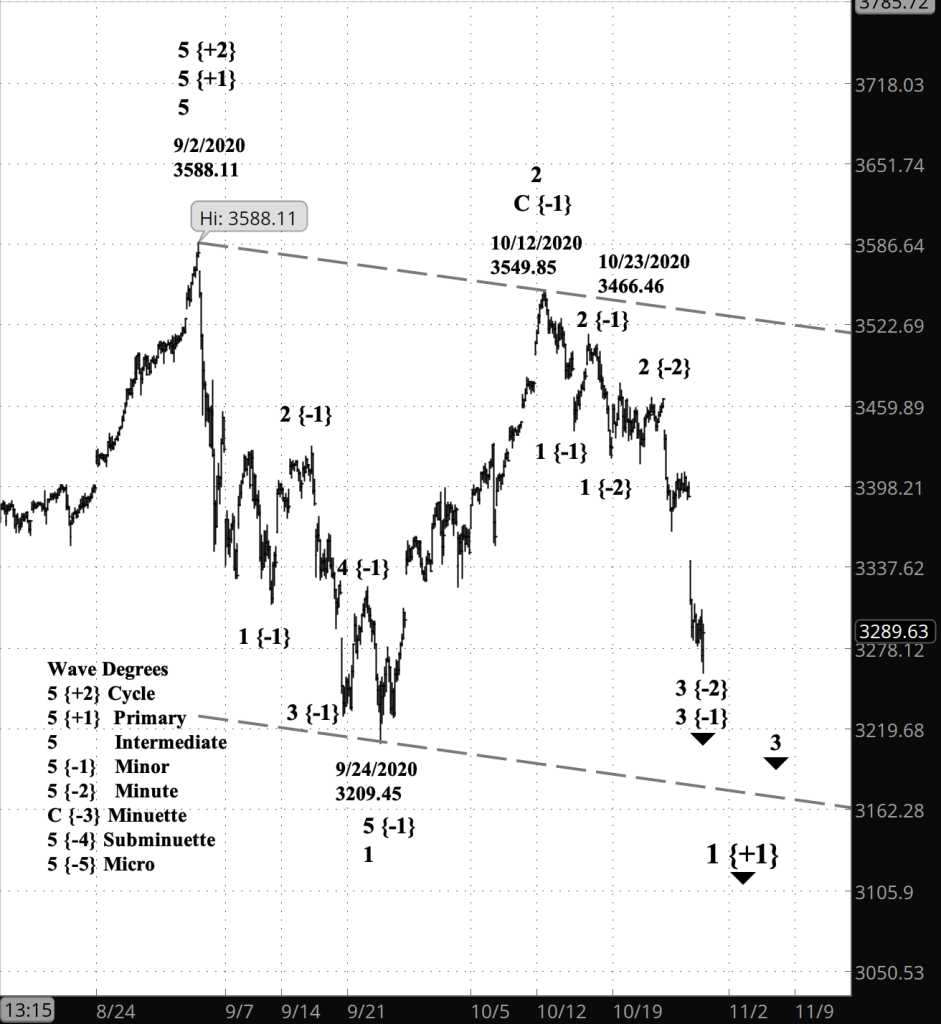
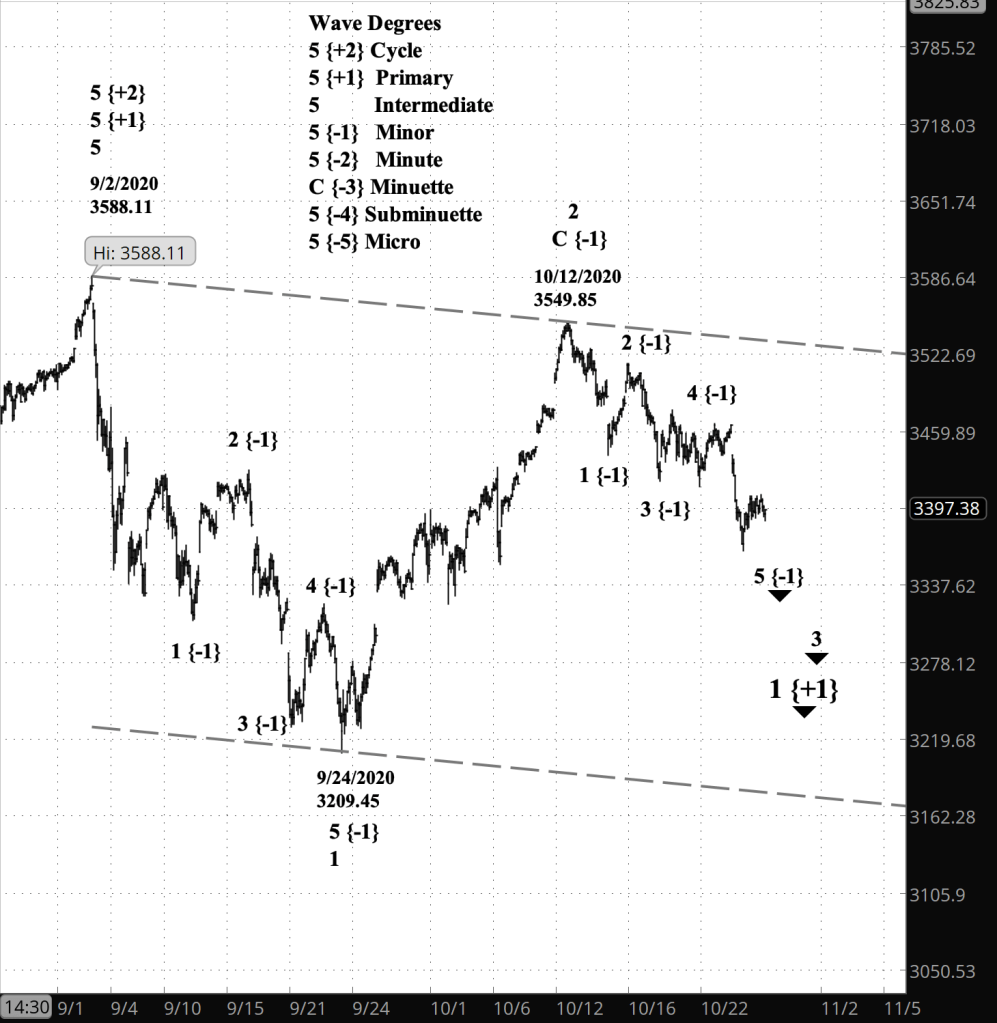
What’s happening now? The S&P 500 E-mini futures beginning Sunday rose higher above the upper boundary of the trend channel. The index on Monday opened with a price gap to the upside, reflecting the futures trading. The price moved above the high of September 2 (golden line) — 3588.11 on the index and 3587 on the futures — the beginning of what Elliott wave analysis suggested would be a significant, years-long downtrend.
What does it mean? The rise since October 30 is the first portion of a correction to the upside. It will be followed by a downward movement, and then a push to a higher level.
What is the alternative? The corrective wave’s push above the start of the major downtrend raises a signal in Elliott wave analysis that could mean that the September 2 high was not the end of the rise that began in 1974 and not the beginning of a significant downtrend. See the Elliott wave theory section, below.
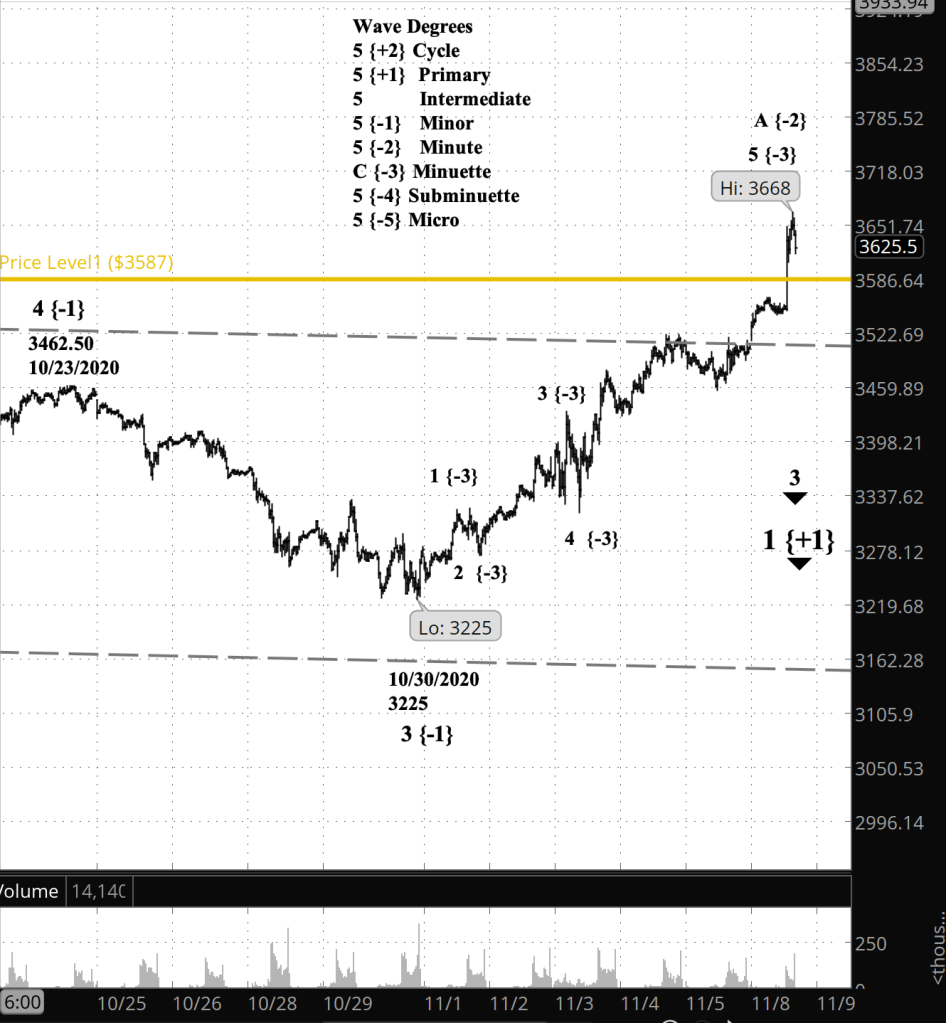
What does Elliott wave theory say? The movement of Primary wave 2 above the start of Primary wave 1 violates a rule of Elliott wave theory. If the chart shows it happening, then the count is wrong and must be redone. I don’t yet know what will replace the count shown on the chart above. I’ll post the revision after I’ve done the work and thought it through.
11:25 a.m. New York time. And I’ve completed the reanalysis. See today’s second post, “The Great Bull Market, 1974-????”.
My trading strategy. I’m hanging on to what I have and not entering into anything new.
Read More »


You must be logged in to post a comment.