10:15 a.m. New York time, chart updated 3:15 p.m.
What’s happening now? The S&P 500 index rose to more than 25 points above Friday’s close, to a high so far of 3549.41 shortly after the opening bell.
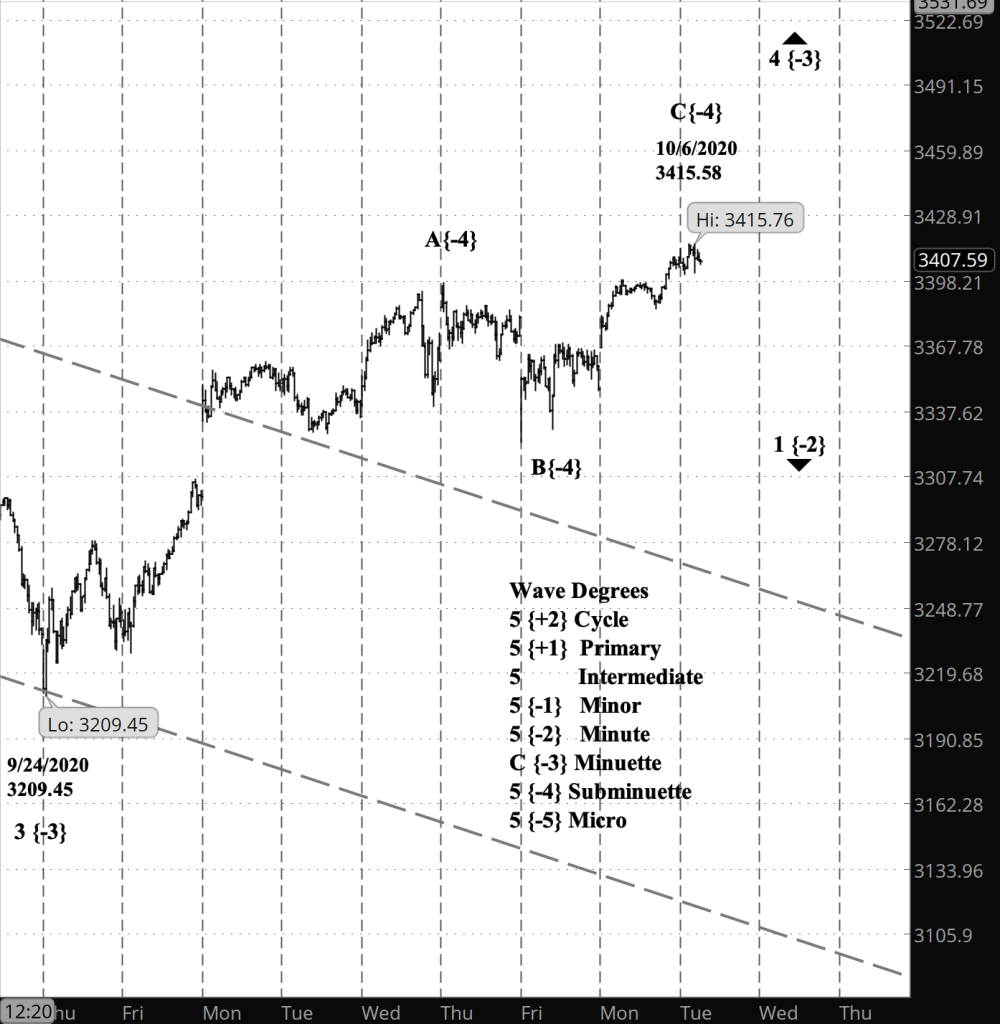
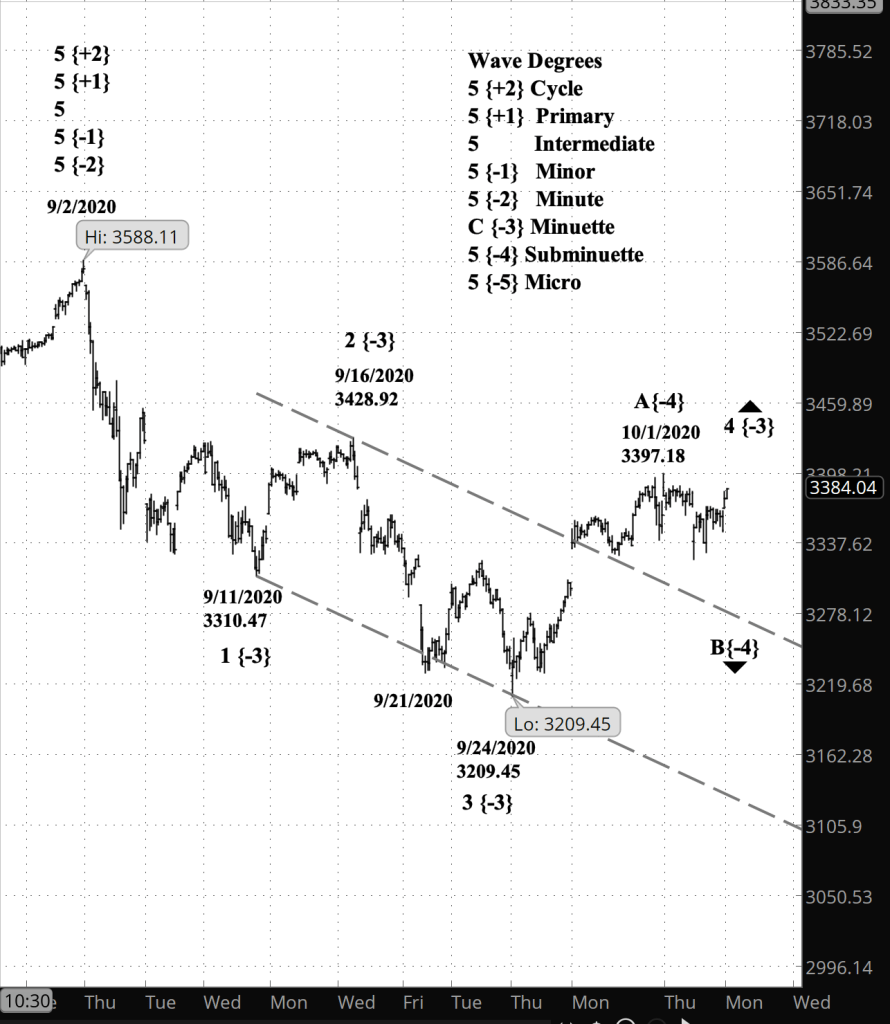
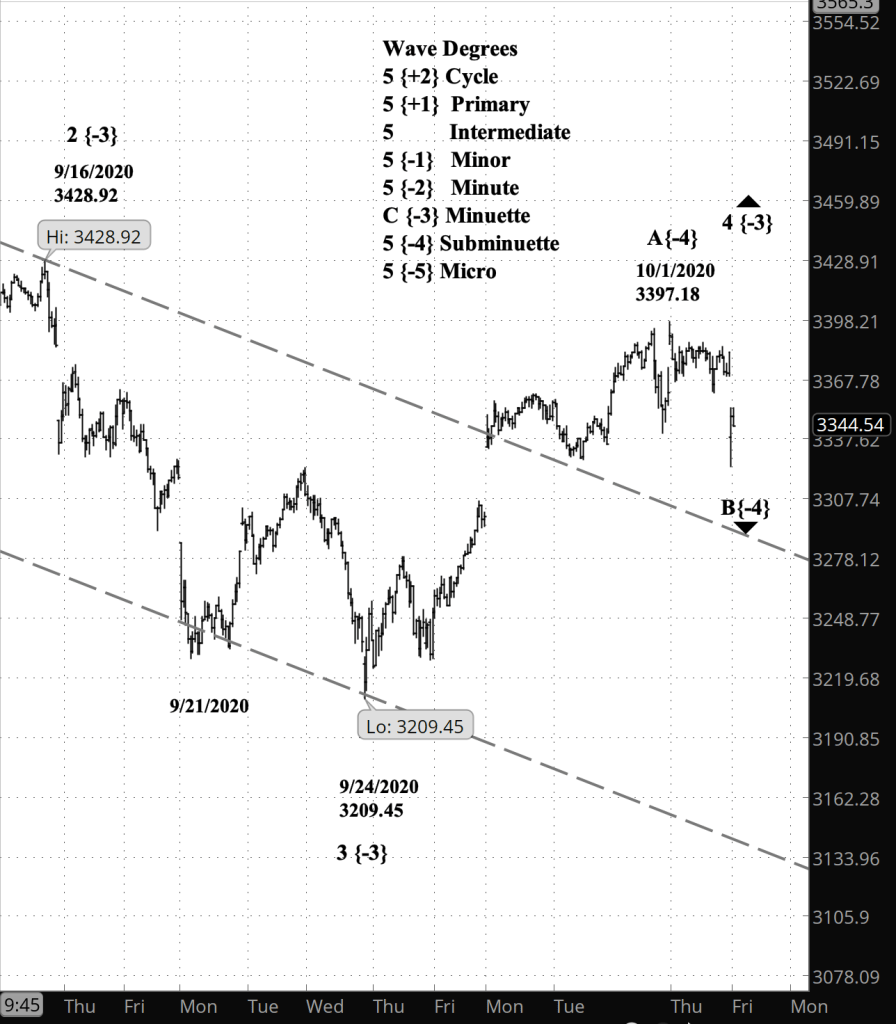
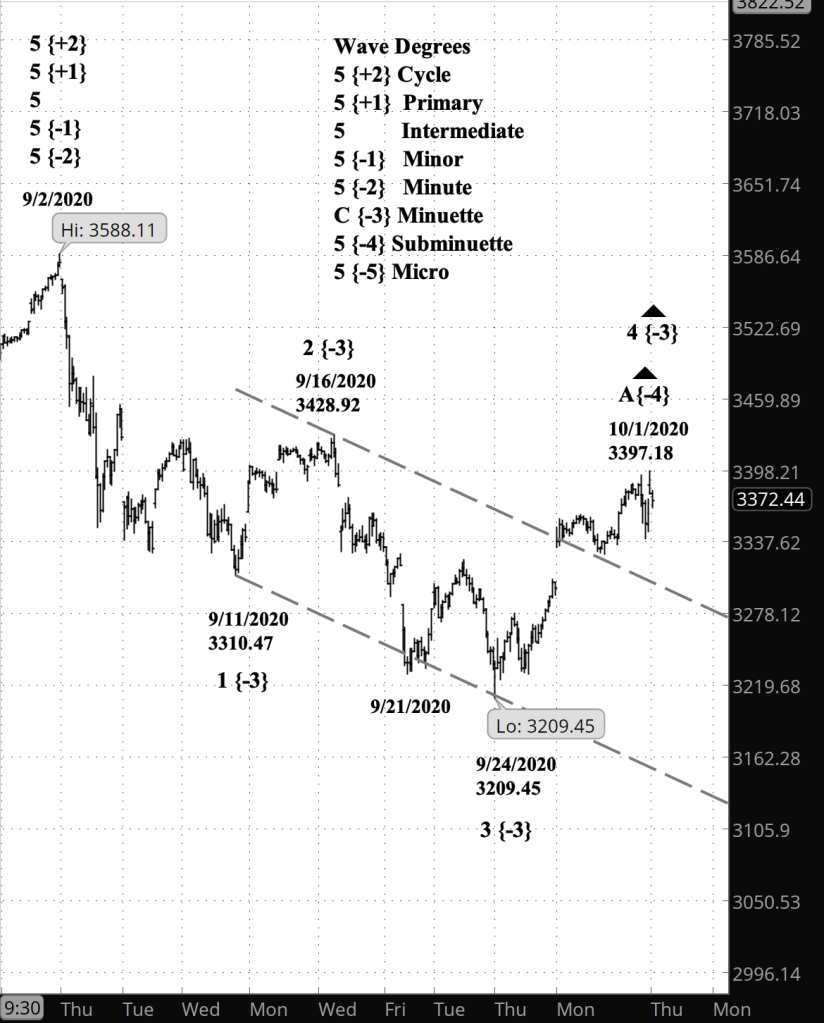
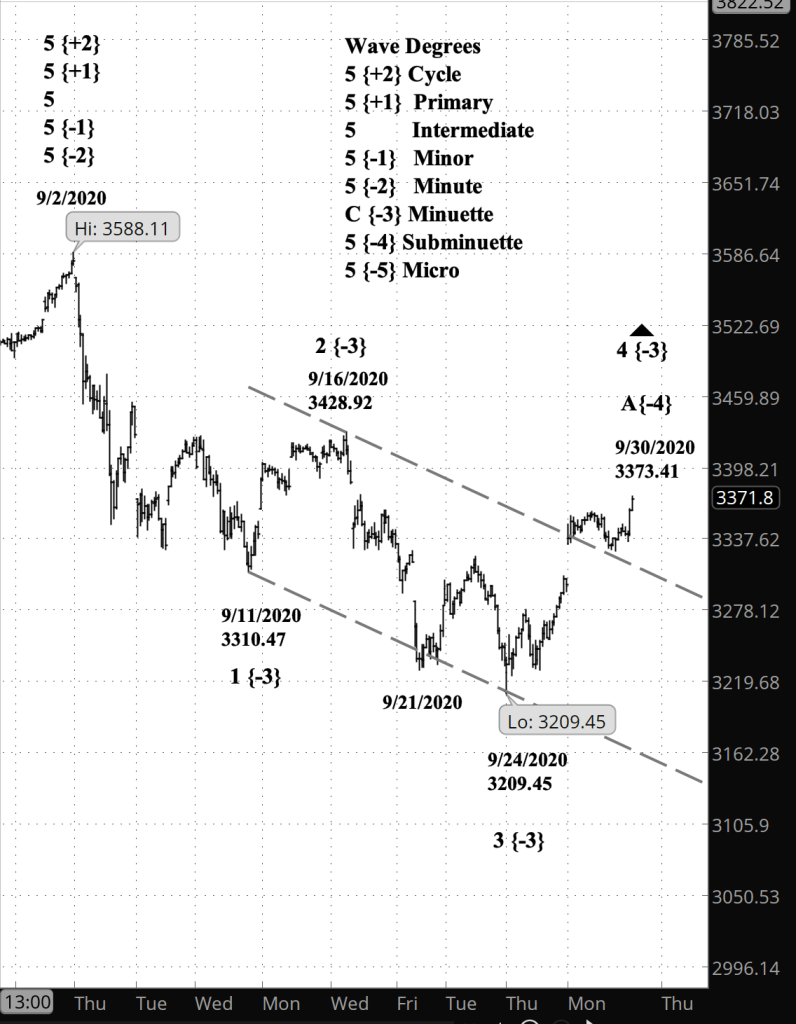
What does it mean? The upward correction that began September 24, from 3209.45, continues, part of a larger downtrend that began in September 2 from 3588.11
What is the alternative? It’s possible that what my principle count labels as an upward correction is in fact a component of of the massive rise that began in 1974. If the price exceeds 3588.11, the the alternative count is correct. I’ve marked the 3588.11 level with a golden line on the chart.
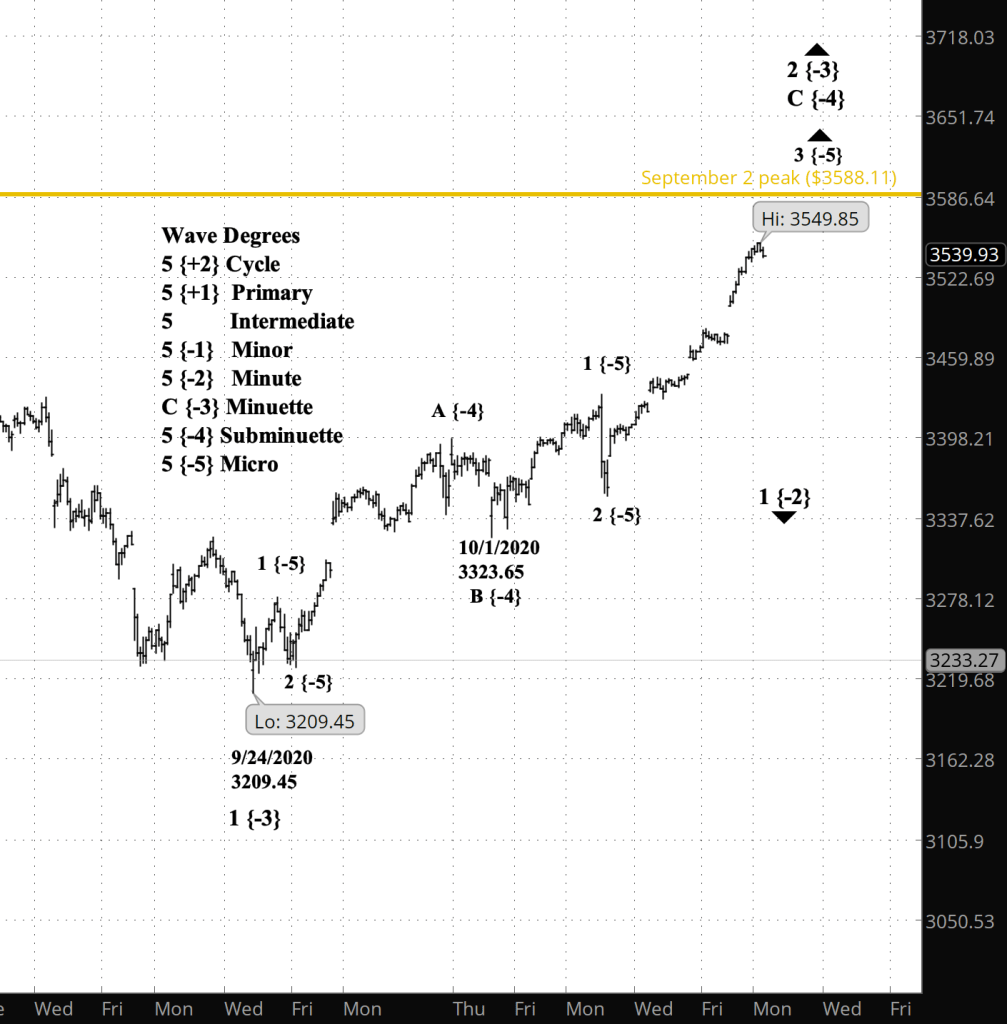
What does Elliott wave theory say? Today’s chart takes a closer look at the index, focusing on the present wave 2 of Minuette degree, that began September 24. For a broader view, see Friday’s post. Within Minuette 2, I count the present position as wave 3 of Micro degree within wave C of Subminuette degree.
I had initially counted the rise from October 1 as part of an A wave, but the price is so close to the 3588.11 limit that I’ve relabelled that position as the end of wave B and the beginning of our present wave C.
My trading strategy. Wave C will be followed by a decline, and I’m counting on that to create an exit point for my short bear call options spreads. The management day for the position is October 30, and expiration is November 20. If the price pushes above the 3588.11 limit, then I exit immediately. I shall continue to hold my bear-oriented shares of the inverse S&P 500 fund SDS.
Read More »


You must be logged in to post a comment.