Live: Tuesday, Nov. 6, 2018

12:50 p.m. New York time

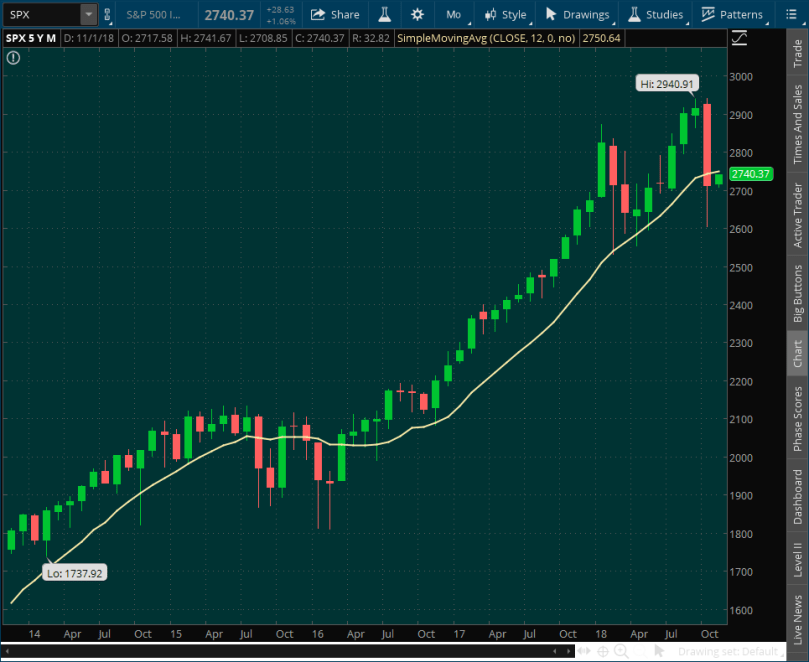
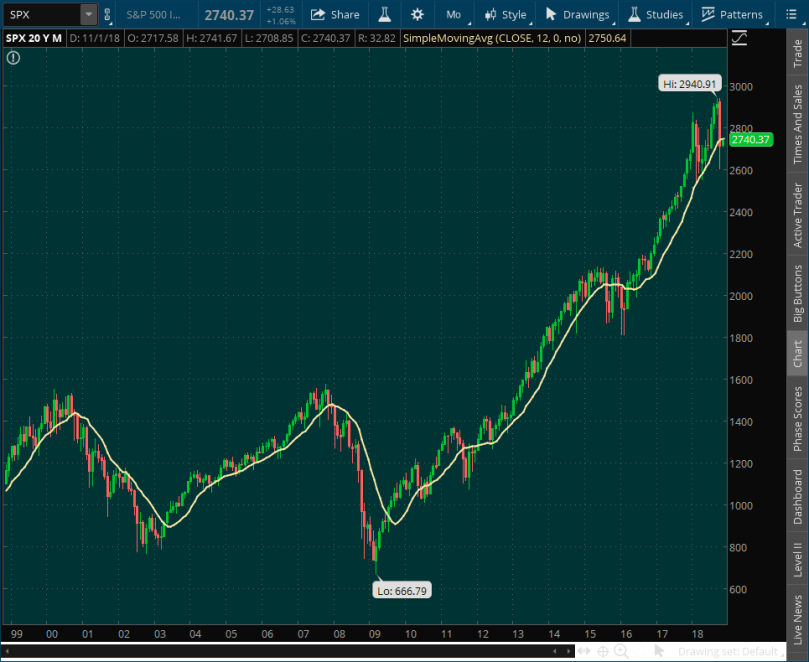
I’m look at the five top-quintile prospects for earnings plays, using these criteria: 1) The higher the implied volatility rank, the better; 2) the higher the market capitalization, the better; 3) a chart running contrary to the S&P 500, i.e.,  above the 12-month moving average is better than below.

DVN and KORS are the leaders for criteria one and two, but they fail on criteria three. The next one down, ETSY, meets all three criteria, although with a market cap of $5 billion, it’s not as high as I like. I’m going to give in to my inclination pass on it, preserving funds for larger companies announcing later.

11:40 a.m. New York time

I’ve updated my GILD analysis with results.

10:40 a.m. New York time

A exit order on GILD was filled moments ago. It’s somewhat under my normal management point, 25% of maximum profit, but since I expect a sharp market decline, best in my mind to take the profit and run.

I have eight possible earnings plays on my desk this morning, with five having top quintile implied volatility ranks.

I haven’t made decisions yet. The most liquid have market caps in the 10s of billions of dollars rather than the hundreds of billions, which is a drawback.

Here’s the list:

1st quintile (81-100): DVN, ETSY, GRPN, KORS and LC

2nd quintile (61-80): KTOS and ODP

3rd quintile: FTR


Today’s Book

The Signal and the Noise

Why So Many Predictions Fail — but Some Don’t

by Nate Silver

Nate Silver got his start predicting sports, moved on to competitive poker and finally became a nationally recognized name when he applied his considerable skills to the predicting elections.

Today is election day in the United States, so what better time to open Silver’s 2012 book on statistics and prediction? I found the book to be fascinating the first time I read it, and even more so the second time.

I’m a trader, and part of my living comes from my ability to understand statistics and to predict what the market will do within the confines of those numbers. Although not focused specifically on the markets, this book provides an excellent gateway to Silver’s methods, and for me, part of the attraction has been to try to link in my own mind his techniques of analyzing sports and politics and my techniques for assessing trades.

A good read that has been useful in focusing my mind on the statistical aspect of trading. I highly recommend it.

More about the book


The status of my current options positions.

sym option debit share price beyond profit zone curr % max profit net prft/shr $ option days left
EWZ 1.30 40.54 (51.2) (0.44) 10
GILD

(exited)

5.15 70.25 16.7 1.03 45
HON 6.34 148.85 0.0 0.00 10
JNJ 6.97 141.91 high (24.5) (1.37) 10
MCD 8.97 179.76 high (44.7) (2.77) 10
MSFT 7.64 107.98 11.2 0.96 45
PM 3.65 88.94 high (6.4) (0.22) 10
SPY 4.47 274.32 (5.9) (0.25) 45
UPS 8.34 107.65 (1.7) (0.14) 45
WBA 4.81 79.95 high (35.1) (1.25) 10

And of my shares positions.

sym share price net result % net profit $ days held
AAPL 203.41 -9.2% (20.55) 53
CHK 3.74 -6.6% (0.27) 53
FXI 41.11 -0.2% (0.10) 53
SPXU 37.60 -7.3% (2.96) 175
TSLA 345.79 13.4% 40.80 36

By Tim Bovee, Portland, Oregon, Nov. 6, 2018

Read More »

Live: Monday, Nov. 5, 2018

10:15 a.m. New York time

I have no earnings plays that I care to take from today’s seven prospects. I’m looking for stocks with market caps above $100 billion (although I’ll fudge that figure) and implied volatility ranks in the 1st quintile (81-100). None of the seven fulfills both requirements, and so I shall reject them all.

The prospects are:

1st quintile (81-100): OAS, GLUU and HL

2nd quintile: CVS and LLY

3rd quintile: AES and ATRS

LLY is the sole prospect with a qualifying market cap, and its IV rank is in the 70s.


Today’s Book

Thinking Fast and Slow

By Daniel Kahneman

This 2012 best-seller contains a great truth that is important to traders like us. Trading is psychology. How you think determines what  trades you make. If a trader treats the markets as a rational machine, to be understood in detail, then you will tend toward a certain sort of analysis — perhaps looking at the underlying business and finances of a company. That would be Daniel Kahneman’s slow thinking. If we rely on intuition, on the feel of of a trade, our analysis will look quite different — perhaps the patterns on a chart that engage our marvelous human pattern recognition systems. The ancient Greeks lived by the aphorism, “Know yourself”. Traders today will profit if they live by those words as well.

More about the book


The status of my current options positions.

sym option debit share price beyond profit zone curr % max profit net prft/shr $ option days left
EWZ 1.60 41.35 high (86.0) (0.74) 11
GILD 5.30 69.17 14.2 0.88 46
HON 5.08 147.17 low 19.9 1.26 11
JNJ 7.01 142.09 high (25.2) (1.41) 11
MCD 8.09 179.24 high (30.5) (1.89) 11
MSFT 7.45 106.43 13.4 1.15 46
PM 3.89 89.60 high (13.4) (0.46) 11
SPY 3.91 271.69 7.3 0.31 46
UPS 8.90 106.36 low (8.5) (0.70) 46
WBA 4.60 79.87 high (29.2) (1.04) 11

And of my shares positions.

sym share price net result % net profit $ days held
AAPL 199.80 -10.8% (24.17) 52
CHK 3.80 -5.0% (0.20) 52
FXI 40.98 -0.6% (0.23) 52
SPXU 38.70 -4.6% (1.86) 174
TSLA 331.25 8.6% 26.26 35

By Tim Bovee, Portland, Oregon, Nov. 5, 2018

Read More »

The Week Ahead: Federal Reserve, producer prices

The Federal Open Market Committee meets beginning Wednesday to make a another decision about interest rates. The meeting concludes on Thursday at 2 p.m. New York time with an announcement of the decision. No news conference is scheduled.

The Fed raised rates once each in 2015 and 2016, three times in 2017 and so far, three times in 2018.


Today’s Book

Can American Capitalism Survive?

Why Greed Is Not Good, Opportunity Is Not Equal, and Fairness Won’t Make Us Poor

by Steven Pearlstein

Washington Post business columnist Steven Pearlstein takes on what I consider to be the challenge of our age: Can capitalism provide a better life for us all?

Now more than ever people are questioning the vast theory and system that underlies our lives, amid increasing inequality and the resulting political turmoil.

Pealstein gives a view of what has happened, why it has happened, and what specifically must be done to fix it. and, in the process, preserve the dynamic system that has created a world of increasing wealth and freedom.

More about the book


There has not yet been a November increase since the present series began, so I won’t read much into it if the Fed decides not to raise at this meeting. The final meeting of the year, Dec. 18-19, will have a news conference by the Federal Reserve chair and release of new forecasts, and that would be the most likely time to announce a fourth increase for the year.

A decision to raise in November, on the other hand, would be a very big deal, with a market response and without a doubt a very loud response from the White House.

One report on the state of prices is due out during the week. The producer price index (final demand) will be published on Friday at 8:30 a.m.

Fed Vice Chairman for Supervision Randal Quarles will speak on future financial regulation at the Brookings Institution in Washington on Friday at 9:05 a.m. The event will be steamed live here.

The week ends with a three-day weekend marking the Veterans Day holiday in the United Stats on Monday, Nov. 12.

Read More »

Live: Friday, Nov. 2, 2018

3:40 p.m. New York time

That wraps of trading for what proved to be a busy week. I’ll post my weekly discussion of economic reporting, The Week Ahead, on Saturday.

11:15 a.m. New York time

I have updated the STZ analysis with results.


Today’s Book

Market Timing with Moving Averages

The Anatomy and Performance of Trading Rules

by Valeriy Zakamulin

Late Thursday evening I posted to Private Trader an essay on a significant moving average signal on the S&P 500. MAs (as we call them in the biz) are a fascinating tool, with a very long history dating well back into the era of manual calculation.

Zakamulin is a professor of finance at the University of Agder School of Business and Law, located in Norway. In his deep dive into the world of moving averages, he provides a foundation of rule-based market timing. 

More about the book


10 a.m. New York time

I have exited STZ. At this time I anticipate no other trades today.

9:50 a.m. New York time

I intend to exit STZ today to avoid an ex-dividend on Monday, which increases the chance of assignment.

The one prospective trade coinciding with earnings PCG. With IV rank in the 3rd quintile, it’s not a serious choice, and I am laying it aside.

I posted an essay last night about a bear signal from a very slow-moving indicator that I’ve written about before: The I Hate Stocks trading indicator. It can be read here.

The status of my current options positions.

sym option debit share price beyond profit zone curr % max profit net prft/shr $ option days left
EWZ 1.72 41.81 high (100.0) (0.86) 14
GILD 5.42 70.59 12.3 0.76 49
HON 5.99 145.35 low 5.5 0.35 14
JNJ 6.35 140.99 high (13.4) (0.75) 14
MCD 7.48 174.51 high (20.6) (1.28) 14
MSFT 7.44 107.13 13.5 1.16 49
PM 3.44 87.97 (0.3) (0.01) 14
STZ 8.63 275.10 high (2.7) (0.23) 14
SPY 4.68 201.62 (10.9) (0.46) 49
UPS 8.27 106.84 (0.9) (0.07) 49
WBA 4.67 79.92 high (31.2) (1.11) 14

And of my shares positions.

sym share price net result % net profit $ days held
AAPL 213.33 -4.7% (10.63) 49
CHK 3.64 -9.0% (0.36) 49
FXI 41.74 1.3% 0.53 49
SPXU 37.23 -8.2% (3.33) 171
TSLA 345.72 13.4% 40.73 32

By Tim Bovee, Portland, Oregon, Nov. 2, 2018

Read More »

A Major Bear Market Signal

In 2013, I published an essay called “The I Hate Stocks Trading Plan“. It was aimed at my many friends who are buy-and-hold traders. Whatever the market does, they ride it up, they ride it down, they ride it back up, and they ride it back down again.

(Click on the title above to read it, or click here.)

That’s a lot of potential profit being chewed up by the bear markets.

The “I Hate Stocks” plan, as I presented it, is extremely conservative. It relies on the 12-month moving average — that’s right, “month”. The chart under this plan is checked once a month, on the last day. If it close above the 12-month moving average, then it is in a bull phase. If below, then it is in a bear phase.

It doesn’t happen often, but when it does, traders with skin in the game do well to take notice.

By this measure, the S&P 500 and it’s top index fund, SPY, entered signaled a bear market at the end of October. Here’s what it looks like on a five-year chart, where each bar covers a month. The yellow line is the 12-month simple moving average (“simple” means, no weighting in favor of the newer readings).

spymo20181101

The 12-month moving average method won’t have you jumping in and out like a demented jackrabbit. It will, like all signals, occasionally give false alarms. But generally, a signal means that we’re in for a change in trend that will be with us for awhile — months, and maybe years.

The last time the S&P 500 gave such a bear signal was in August 2015. It moved back into a bull signal in March 2016. In both cases, the signal was read on the last day of the month.

That was a relatively short correction, a bit more than half a year. There’s no guarantee that they’ll all be that short.

The bear signal of late 2008 kicked off a bear market that lasted until mid-2009, and the market took years to really get going. It didn’t return to its prior levels until 2013, five years later.

Here’s a 20-year monthly chart of the S&P 500, again with monthly bars.

Bspymo2018-11-01-TOS_CHARTS

Note that under this plan, the trader won’t avoid all of the decline, but will escape most of it. And the trader will won’t catch all of rise, but will profit from most of it. Like all signals, the 12-month moving average is a lagging indicator. But even with the lag, used properly it increases profits.

Full disclosure: I don’t use the “I Hate Stocks Trading Plan” in my own trading. Truth is, I love stocks, especially in the form of their options, a derivative. Using stock options, I can make money in a downtrending market just as handily as I can make it in an uptrending market. And I trade often, almost every week, sometimes almost every day.

But when there’s a signal of this magnitude on the slow-moving 12-month moving average, I take notice. And the signal tells me to be extra-bearish and extra-cautious in my trading.

By Tim Bovee, Portland, Oregon, Nov. 1, 2018

Read More »

SPY Analysis

SPDR S&P 500 ETF (SPY)

I have entered a short bear vertical spread on SPY, using options that trade for the last time 50 days hence, on Dec. 21. The premium is a $4.22 credit and the stock at the time of entry was priced at $273.a8.

I made the decision to enter the trade in my account based on Elliott wave analysis. My count shows that the requirements have been met for a wave 2 upward correction at the Minute degree, and I anticipate the next move will be a wave 3 decline.

The profit zone for this position is $270.78 and below.

Read More »

Live: Thursday, Nov. 1, 2018

3:30 p.m. New York time

I have updated the analyses for today’s four exits with results. They are AMGN, C, IBM and VNQI.

2:05 p.m. New York time

I’m passing on an SBUX earnings play without analysis. My structure would be an iron fly, and the at-the-money options strike prices are overly far from the stock price for my taste.

1:45 p.m. New York time

I have exited a position in AMGN to free up funds and entered a new position on SPY.

10:50 a.m. New York time

My exit orders on C, IBM and VNQI have been filled, each for a loss.

It looks to me as though SPY has completed the minimum requirement to consider Elliott wave 2 at the Minute degree {+1} to be complete, and that means it’s time to hop back in with a fresh position in order to catch wave 3 down. I shall enter a position today.

The SPY chart covers 30 days with 30-minute bars.

SPY2018-11-01-FLEXIBLE_GRID

10:20 a.m. New York time

This is a day to clean holdings.

I have placed two exit orders, C because the stock goes ex-dividend on Friday and I don’t want to be assigned, which incurs fees, and IBM because it is significantly out of the money on the downside, and I would just as soon take the loss and free the money for other trades.

And I am exiting VNQI, a shares position, to free up cash.

I shall continue looking closely at SPY for a re-entry point.


Today’s Book

The Behavioral Investor

by Daniel Crosby

Crosby, whose latest book ranks at the top of the Investment and Business sales chart, considers the role of psychology in what we traders do, placing and managing investments. 

The Behavioral Investor takes on a tour of human nature and then drills down to the specifics of how to construct a portfolio.

“Wealth, truly considered,” says the book description, “has at least as much to do with psychological as financial wellbeing.” It’s a book with ideas worth considering as we continue to improve our trading skills.

More about the book


My best earnings prospect for the day is SBUX, with an implied volatility rank in the top percentile. I shall consider it for a trade, if I can find the cash. My trading account is almost entirely committed.

The other earnings possibilities for the day are:

1st quintile (81-100): AAPL, NWL, STX, WU and X

2nd quintile (61-80): BABA, CVX, DUK and MET

4th quintile (21-40): TTPH

A snapshot of my current options positions.

sym option debit share price beyond profit zone curr % max profit net prft/shr $ option days left
AMGN 8.44 192.51 13.7 1.34 15
C 3.59 65.79 low (4.1) (0.14) 15
EWZ 1.28 40.66 (48.8) (0.42) 15
GILD 5.52 69.07 10.7 0.66 50
HON 6.28 144.68 low 0.9 0.06 15
IBM 10.00 115.53 low (47.3) (3.21) 15
JNJ 6.04 140.85 high (7.9) (0.44) 15
MCD 7.71 176.00 high (24.4) (1.51) 15
MSFT 7.68 106.25 10.7 0.92 50
PM 3.64 88.66 high (6.1) (0.21) 15
STZ 9.48 199.60 low (12.9) (1.08) 15
UPS 8.82 106.89 (7.6) (0.62) 50
WBA 4.71 80.18 high (32.3) (1.15) 15

And my shares positions.

sym share price net result % net profit $ days held
AAPL 218.24 -2.6% (5.72) 48
CHK 3.54 -11.5% (0.46) 48
FXI 40.27 -2.3% (0.94) 48
SPXU 38.66 -4.7% (1.90) 170
TSLA 342.48 12.3% 37.49 31
VNQI 53.86 -5.2% (2.95) 49

By Tim Bovee, Portland, Oregon, Nov. 1, 2018

Read More »

Live: Wednesday, Oct. 31, 2018

12:15 p.m. New York time

I’ve exited AMGN in order to free up funds.

11:50 a.m. New York time

I found a few more earnings announcements that are due for potential action today, none of which I intend to trade. But for the sake of completeness, sorted by  they are:

2nd quintile (61-80): APA

3rd quintile (41-60): AIG, EXC

10:05 a.m. New York time.

SPY continues to rise in an Elliott wave analysis 2nd wave correction, as I continue to wait for the right time to re-enter my bear position.

There are only two prospective earnings plays on the calendar today, and I don’t care to trade with one. They DWDP, in the 1st quintile of its implied volatility rank (81-100) and PPL, in the 3rd quintile (41-60).

Bottom line: No trades in sight this morning.


Today’s Book

Keeping At It

The Quest for Sound Money and Good Government

by Paul Volcker and Christine Harper

Paul Volcker took over as chairman of the Federal Reserve at a time when the economy was in trouble. The catch-phrase of the day was “stagflation” — high inflation combined with low growth.

It was a time when interest rates meant 20% and more, and inflation in that same range.

As the nation reeled from the Crash of 2008, Volcker was again pressed into service and played a key role in the remaking of the U.S. financial system after the crash.

In this book Volcker reviews his extraordinary career with lessons we can learn from. 

More about the book


A snapshot of my options positions.

sym option debit share price beyond profit zone curr % max profit net prft/shr $ option days left
AMGN 8.94 192.64 8.6 0.84 16
C 3.70 65.53 low (7.2) (0.25) 16
EWZ 1.11 40.05 (29.1) (0.25) 16
GILD 5.54 69.87 10.4 0.64 51
HON 6.37 145.28 low (0.5) (0.03) 16
IBM 10.21 115.54 low (50.4) (3.42) 16
JNJ 6.54 140.62 high (16.8) (0.94) 16
MCD 8.46 178.00 high (36.5) (2.26) 16
MSFT 7.79 107.23 9.4 0.81 51
PM 3.61 87.78 (5.2) (0.18) 16
STZ 8.80 201.23 low (4.8) (0.40) 16
UPS 8.04 108.46 2.0 0.16 51
WBA 4.28 78.19 high (20.2) (0.72) 16

And my shares positions.

sym share price net result % net profit $ days held
AAPL 217.72 -2.8% (6.24) 47
CHK 3.47 -13.3% (0.53) 47
FXI 39.31 -4.6% (1.91) 47
SPXU 38.71 -4.6% (1.85) 169
TSLA 334.69 9.7% 29.70 30
VNQI 52.87 -6.9% (3.94) 48

By Tim Bovee, Portland, Oregon, Oct. 31, 2018

Read More »

AMGN Analysis

Amgen Inc. (AMGN)

Update 11/1/2018: I’ve exited AMGN for a profit, 15 days before the options expired. The exit came at 14.9% of maximum potential profit, lower than my normal 25%. My purpose was to free up funds for another purchase. 

I exited for a debit of $8.32, a $148 profit per contract, with the share price at $192.89, up $2.97 from entry.

Shares rose by 1.6% over my two-day holding period, or a +295% annual rate. The options position produced a 17.6% return for a +3,203% annual rate.


I have entered a short iron fly spread on AMGN, using options that trade for the last time 17 days hence, on Nov. 16. The premium is a $9.78 credit and the stock at the time of entry was priced at $189.92.

The position is timed to coincide with an earnings announcement, on Tuesday, Oct. 30, after the closing bell.

The profit zone for this position is between $199.78 on the upside and $184.78 on the downside.

Read More »

Live: Tuesday, Oct. 30, 2018

2:25 p.m. New York time

SPY has bounced off of the low set on Monday. It could be the beginning of the 2nd wave p at the Minute degree, or not. In any case, I’m not trading back in today.

12:20 p.m. New York time

I have entered a short iron fly position on AMGN. I chose the earlier expiration date, Nov. 16, in order to make funds available quickly for future trades during the earnings season.

11:10 a.m. New York time.

I’ll be taking a close look at SPY today. My initial sense is that it has finished a wave 1 down and is moving into a 2nd wave correction, but I want to dive into the chart to get a sense of when I should re-enter.

Today’s earnings play is a choice between AMGN and BIDU. Both are in the top quintile of their respective implied volatility rating. AMGN has more than double the market capitalization of BIDU. Therefore, AMGN is my choice. Analysis and possibly a trade to come.

The other prospects, grouped by implied volatility rank quintile, are:

1st quintile (81-100): GM, BAX, ALL, APC, EA, YUM and ZEN

2nd quintile (61-80): MOS and BGFV

3rd quintile: (41-60): PEG, UAA and UA


Today’s Book

The Fifth Risk

by Michael Lewis

Now #5 on the Amazon Charts in its 2nd week on the list. A new book by the financial writer who always finds new, and often surprising, insights into the world of money and systems.

In The Fifth Risk, Lewis dives into the most contentious issue of our times, the functioning of government in a time of attack and change.

He asks, What are the consequences of handing government over to people who have no idea how it works.

The New York Times calls it his “most ambitious and important book”. Quartz says that it is a “spellbinding, alarming analysis of the most serious threats to Americans’ safety happening now from inside the U.S. government.

More about the book


A snapshot of my options positions.

sym option debit share price curr % max profit net prft/shr $ option days left
C 3.94 64.17 (14.2) (0.49) 17
EWZ 0.91 39.65 (5.8) (0.05) 17
GILD 5.84 71.44 5.5 0.34 52
HON 7.15 141.91 (12.8) (0.81) 17
IBM 10.18 116.86 (49.9) (3.39) 17
JNJ 6.04 139.40 (7.9) (0.44) 17
MCD 7.73 176.55 (24.7) (1.53) 17
MSFT 8.20 102.62 4.7 0.40 52
PM 4.31 91.27 (25.7) (0.88) 17
STZ 10.05 198.26 (19.6) (1.65) 17
UPS 9.15 106.27 (11.6) (0.95) 52
WBA 3.92 76.96 (10.1) (0.36) 17

And my shares positions.

sym share price net result % net profit $ days held
AAPL 213.37 -4.7% (10.59) 46
CHK 3.25 -18.8% (0.75) 46
FXI 38.61 -6.3% (2.61) 46
SPXU 41.67 2.7% 1.11 168
TSLA 332.98 9.2% 27.99 29
VNQI 52.73 -7.2% (4.08) 47

By Tim Bovee, Portland, Oregon, Oct. 30, 2018

Read More »