Trader’s Notebook

3:30 p.m. New York time

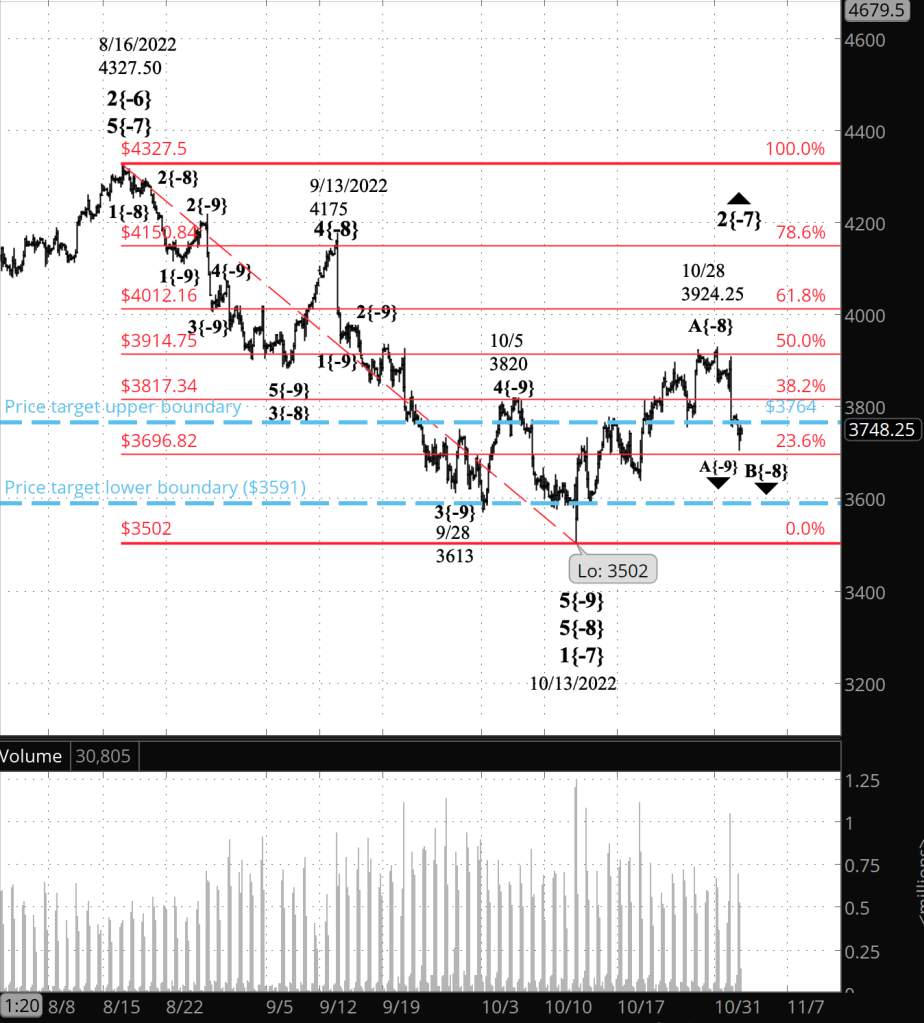
Half an hour before the closing bell. The S&P 500 continued to decline during the session, with the futures reaching into the 3750s. The greater the decline, the greater the likelihood that the final subwave has begun, within the middle wave the upward correction that began on October 13. I’ve marked it that way on the chart: Wave C{-9} within wave B{-8} within the correction, Wave 2{-7}.

If the wave C{-9} decline moves below 3502, the correction’s starting point, then the October 28 peak was the end of the correction, which is the alternative scenario. Under the principal scenario, that peak was the end of the first subwave within the correction.

I’ve updated the chart.

9:35 a.m. New York time

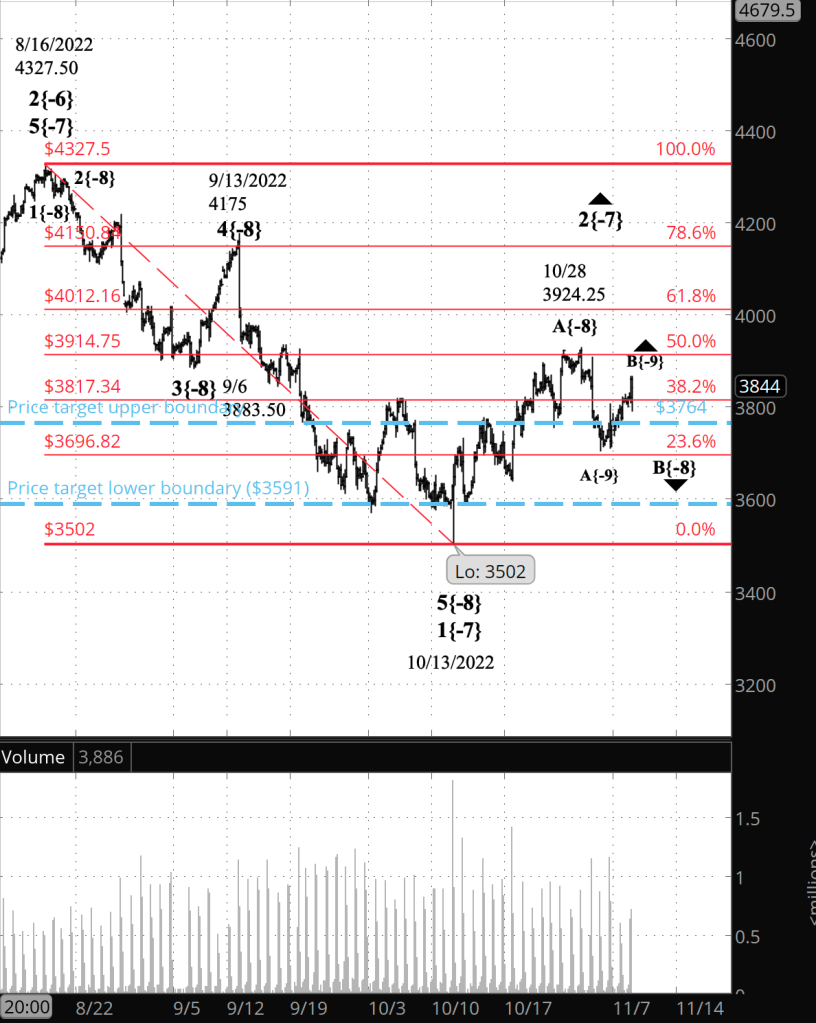
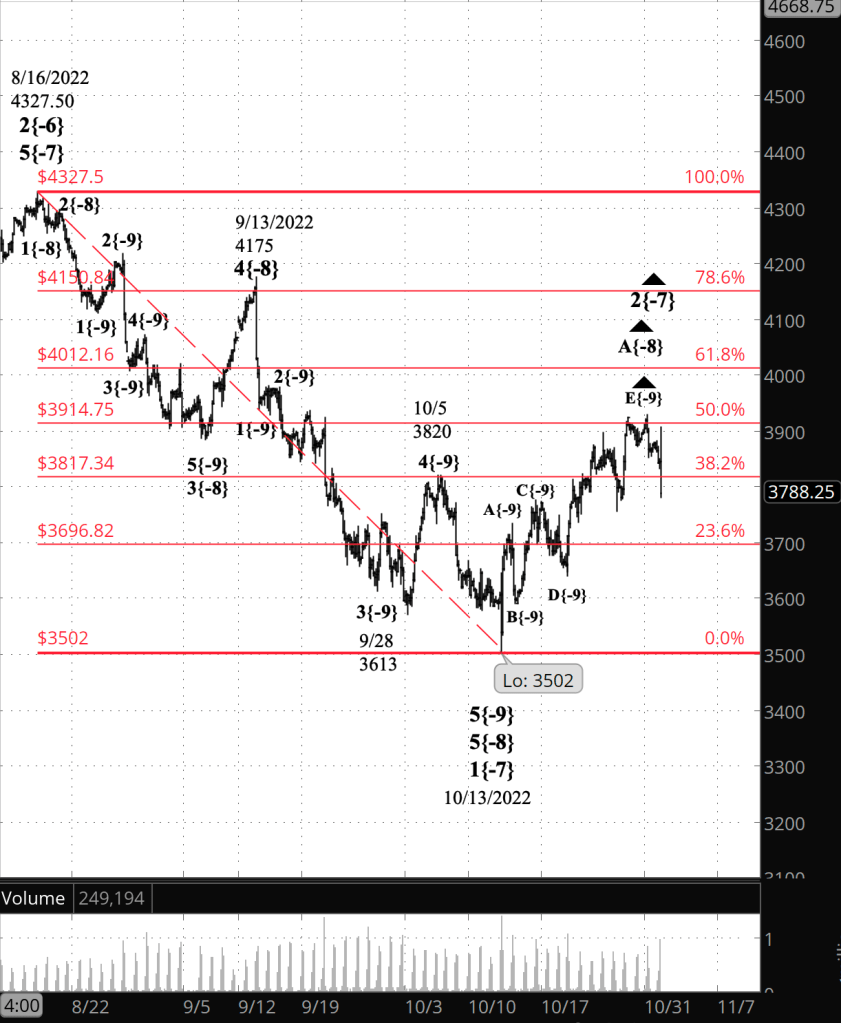
What’s happening now? The S&P 500 E-mini futures traded sideways overnight, slightly above a 38% retracement of the downtrend that lasted from August 16 to October 13, and then declined at the opening bell. The price remained below yesterday’s high, 3847, throughout the night.

What does it mean? The upward correction that began on October 13 continues, It is in the middle of three waves forming a Zigzag corrective structure, and that middle wave is in its middle subwave of three.

What is the alternative? The same as it has been for the past few days: The entire upward correction ended at the October 28 peak, which in the principal analysis is the end of the first subwave within the correction. I find this to be an entirely unlikely scenario, but I can’t rule it out entirely, either.

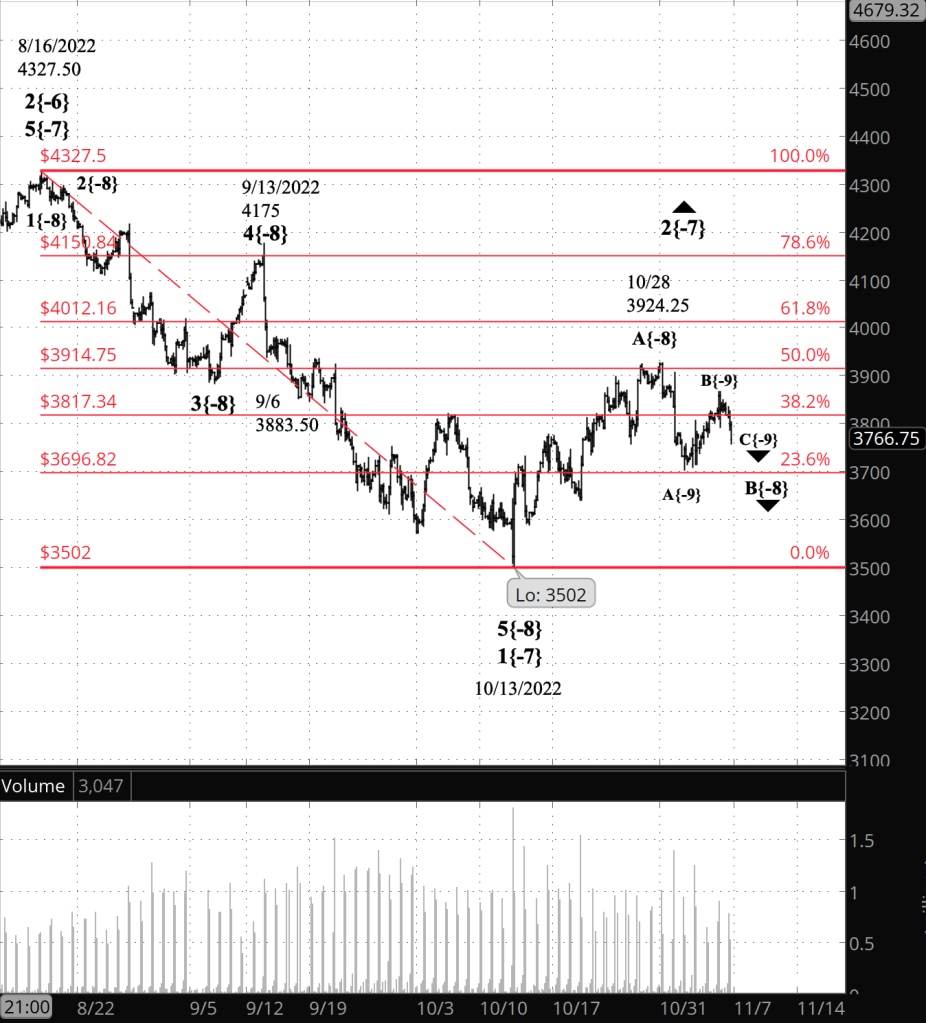
[S&P 500 E-mini futures at 3:30 p.m., 230-minute bars, with volume]

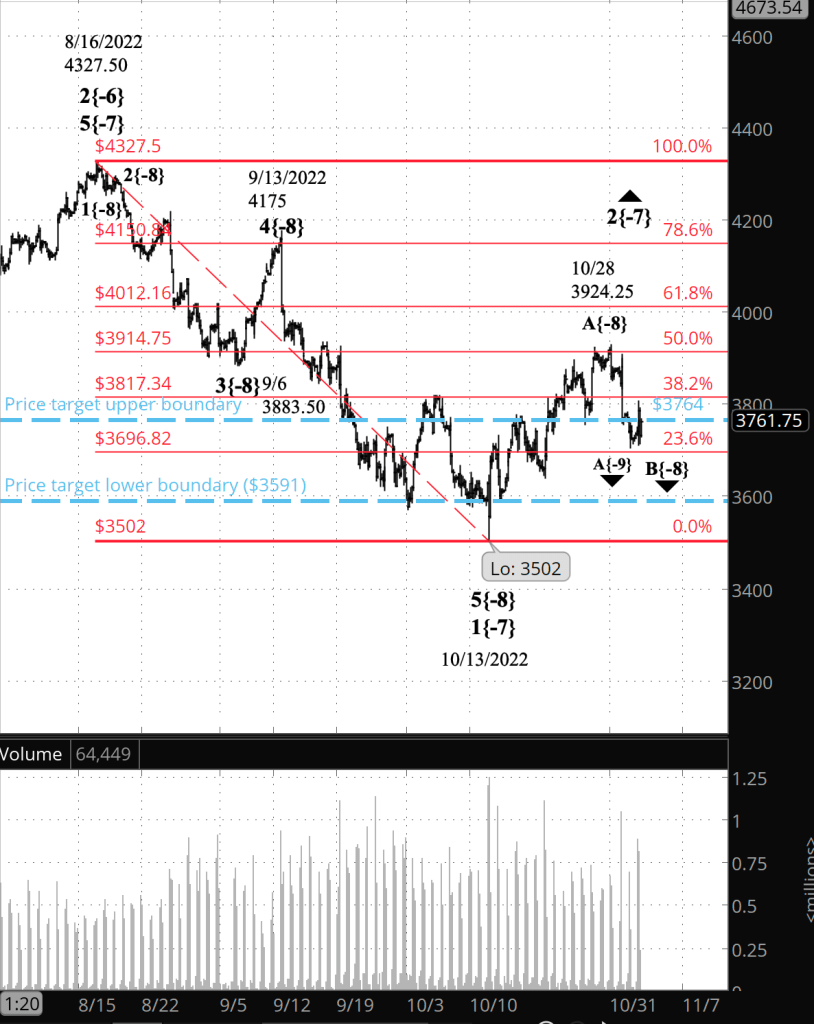
What does Elliott wave theory say? Unchanged from yesterday.. The S&P 500 is in wave B{-9} within wave B{-8} within wave 2{-7}, where in wave 2{-7} is the upward correction that began on October 13, wave B{-8} is the middle subwave within a three-wave Zigzag corrective pattern, and wave 2{-7} is an upward correction.

The structure is part of wave 3{-6}, a downtrend that began on August 16 from 4327.50 on the futures. When the correction is over, wave 3{-7{ will carry the parent wave significantly lower.

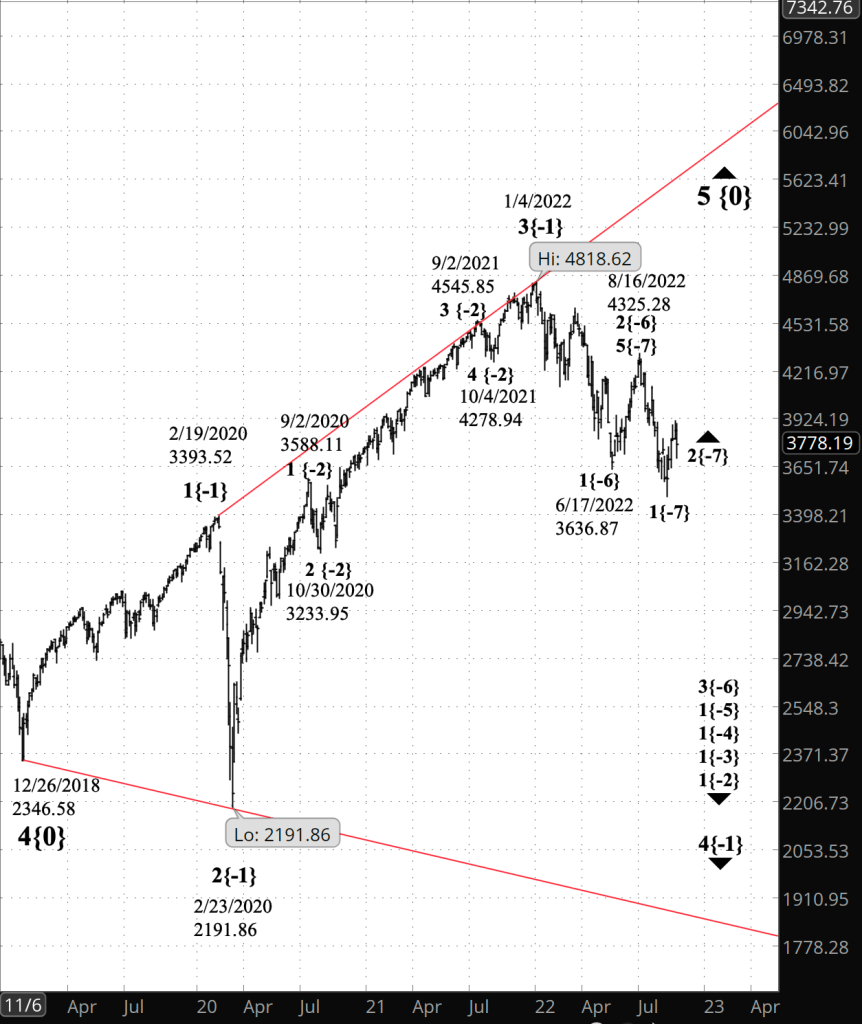
Wave 3{-6} is enclosed by a series of nested 1st waves of increasing size, up to wave 1{-2}, a subwave of wave 4{-1}, the fourth of five waves within an expanding Diagonal Triangle, wave 5{0}, that began on December 26, 2018. When wave 4{-1} is complete, it will be followed by uptrending wave 5{-1}, which will most likely carry the price above the January 4 starting point of wave 4{-1}, 4818.62 on the index.

We Are Here.

These are the waves currently in progress under my principal analysis. Each line on the list shows the wave number, with the subscript in curly brackets, the traditional degree name, the starting date, the starting price of the S&P 500 E-mini futures, and the direction of the wave.

  • S&P 500 Index:
  • 5{+3} Supercycle, 7/8/1932, 4.40 (up)
  • 5{+2} Cycle, 12/9/1974, 60.96 (up)
  • 5{+1} Primary, 3/6/2009, 666.79 (up)
  • 5{0} Intermediate, 12/26/2018, 2346.58 (up)
  • 4{-1} Minor, 1/4/2022 4818.62 (down)
  • 1{-2} Minute, 1/4/2022 4818.62 (down)
  • S&P 500 Futures and index:
  • 1{-3} Minuette, 1/4/2022, 4808.25 (down) (futures), 4818.62 (down) (index)
  • S&P 500 Futures:
  • 1{-4} Subminuette, 1/4/2022, 4808.25 (down)
  • 1{-5} Micro, 1/4/2022, 4808.25 (down)
  • 3{-6} Submicro, 8/16/2022, 4327.50 (down)
  • 2{-7} Minuscule, 10/13/2022, 3502 (up)
  • B{-8} Subminuscule, 10/28/2022, 3924.25 (down)

Learning and other resources. Elliott wave analysis provides context, not prophecy. As the 20th century semanticist Alfred Korzybski put it in his book Science and Sanity (1933), “The map is not the territory … The only usefulness of a map depends on similarity of structure between the empirical world and the map.” And I would add, in the ever-changing markets, we can judge that similarity of structure only after the fact.

See the menu page Analytical Methods for a rundown on where to go for information on Elliott wave analysis.

By Tim Bovee, Portland, Oregon, November 9, 2022

Disclaimer

Tim Bovee, Private Trader tracks the analysis and trades of a private trader for his own accounts. Nothing in this blog constitutes a recommendation to buy or sell stocks, options or any other financial instrument. The only purpose of this blog is to provide education and entertainment.

No trader is ever 100 percent successful in his or her trades. Trading in the stock and option markets is risky and uncertain. Each trader must make trading decisions for his or her own account, and take responsibility for the consequences.

License
Creative Commons License

All content on Tim Bovee, Private Trader by Timothy K. Bovee is licensed under a Creative Commons Attribution-ShareAlike 4.0 International License.

Based on a work at www.timbovee.com.

Trader’s Notebook

3:30 p.m. New York time

Half an hour before the closing bell. The S&P 500 rose early in the session, to 3867 on the futures, and then dropped back to the 38.2% Fibonacci retracement level, at 3817. Upward wave B{-9} within downward wave B{-8} within an upward correction, wave 2{-7} are all underway. No change in the analysis. I’ve updated the chart.

9:35 a.m. New York time

What’s happening now? The S&P 500 E-mini futures traded narrowly overnight, staying within the 3800s close to the 38.2% Fibonacci retracement level.

What does it mean? An upward correction that began on October 13 is in its second wave, which is a downward movement. A third internal wave will rise above the end of the first wave reached on October 28 at 3924, completing the corrective pattern.

What are the alternatives? The October 28 high could have been the end of the upward correction. I don’t take this alternative seriously because the subwaves seem disproportionately small. Nonetheless, it’s possible.

Why is the market stalling? My best guess: The Bureau of Labor Statistics releases new inflation data on Thursday, an hour before the opening bell, and I think a lot of trade decisions are showing caution as that new information release approaches.

Chart note. The chart is a bit complicated by overlays at this point. The Fibonacci ladder, showing the retracement of the decline that began on August 16, is in red. The two blue horizontal lines are the upper and lower boundaries of the price target range of the second wave of the upward correction.

[S&P 500 E-mini futures at 3:30 p.m., 220-minute bars, with volume]

What does Elliott wave theory say? The upward correction is wave 2{-7}, the second wave within downtrending wave 3{-6}, which began on August 16.

Internally, according to the principal analysis, wave B{-8}, the middle wave of a Zigzag pattern, is underway. Wave B{-8} is in its middle subwave, B{-9}, which is rising. It will be followed by wave C{-8}, the final wave in the Zigzag, which will rise above 3924, the endpoint of wave A{-8}.

Most likely wave C{-8} will be the end of the correction. However, sometimes corrections take a compound structure, linking two or three corrective patterns together.

Downtrending wave 3{-6}, the parent wave of the correction, is in turn enclosed by a series increasingly larger downtrending 1st waves, up to wave 1{-2}, four degrees larger. Above the entire structure of nested waves is wave 4{-1}, a downtrending wave that is the next-to-the-last wave within an expanding Diagonal Triangle that began on December 26, 2018.

Wave 4{-1} will be followed by the triangle’s final segment, wave 5{-1}, which probably will rise above 4818.62 on the index, the beginning of wave 4{-1} on January 4. Fifth waves are like donkeys,.We know what they’re supposed to do — move above the prior high — but sometimes they get stubborn and come up short.

In any case, the end of the triangle will be the start of a downtrend of massive proportion that will take decades to complete, although there will be many chances to profit from very large upward corrections within the downtrend.

We Are Here.

These are the waves currently in progress under my principal analysis. Each line on the list shows the wave number, with the subscript in curly brackets, the traditional degree name, the starting date, the starting price of the S&P 500 E-mini futures, and the direction of the wave.

  • S&P 500 Index:
  • 5{+3} Supercycle, 7/8/1932, 4.40 (up)
  • 5{+2} Cycle, 12/9/1974, 60.96 (up)
  • 5{+1} Primary, 3/6/2009, 666.79 (up)
  • 5{0} Intermediate, 12/26/2018, 2346.58 (up)
  • 4{-1} Minor, 1/4/2022 4818.62 (down)
  • 1{-2} Minute, 1/4/2022 4818.62 (down)
  • S&P 500 Futures and index:
  • 1{-3} Minuette, 1/4/2022, 4808.25 (down) (futures), 4818.62 (down) (index)
  • S&P 500 Futures:
  • 1{-4} Subminuette, 1/4/2022, 4808.25 (down)
  • 1{-5} Micro, 1/4/2022, 4808.25 (down)
  • 3{-6} Submicro, 8/16/2022, 4327.50 (down)
  • 2{-7} Minuscule, 10/13/2022, 3502 (up)
  • B{-8} Subminuscule, 10/28/2022, 3924.25 (down)

Learning and other resources. Elliott wave analysis provides context, not prophecy. As the 20th century semanticist Alfred Korzybski put it in his book Science and Sanity (1933), “The map is not the territory … The only usefulness of a map depends on similarity of structure between the empirical world and the map.” And I would add, in the ever-changing markets, we can judge that similarity of structure only after the fact.

See the menu page Analytical Methods for a rundown on where to go for information on Elliott wave analysis.

By Tim Bovee, Portland, Oregon, November 8, 2022

Disclaimer

Tim Bovee, Private Trader tracks the analysis and trades of a private trader for his own accounts. Nothing in this blog constitutes a recommendation to buy or sell stocks, options or any other financial instrument. The only purpose of this blog is to provide education and entertainment.

No trader is ever 100 percent successful in his or her trades. Trading in the stock and option markets is risky and uncertain. Each trader must make trading decisions for his or her own account, and take responsibility for the consequences.

License
Creative Commons License

All content on Tim Bovee, Private Trader by Timothy K. Bovee is licensed under a Creative Commons Attribution-ShareAlike 4.0 International License.

Based on a work at www.timbovee.com.

Trader’s Notebook

3:30 p.m. New York time

Half an hour before the closing bell. The S&P 500 has traded sideways during most of the session, in the 3770s on the futures, and as the closing bell approach the price rose to the 38.2% Fibonacci retracement level, in the low 3800s. No change in the analysis. I’ve updated the chart.

9:35 a.m. New York time

What’s happening now? The S&P 500 E-mini futures broke above the narrow range within which it ended the week, returning to the low 3800s.

What does it mean? The downward middle wave within an upward correction that began on October 13 is underway. That middle wave, when complete, will have three subwaves. The first subwave appears to be complete and the second subwave is in progress.

What are the alternatives? If I squint my eyes and use my imagination, I can sort of make a case for the middle wave of the upward correction having ended at the November 3 low, 3704.25, at the wave A{-9} endpoint on the chart. It seems far fetched, so I’m ranking it as a distant alternative.

[S&P 500 E-mini futures at 3:30 p.m., 220-minute bars, with volume]

What does Elliott wave theory say? Under the principal analysis, wave B{-8}, the second wave within an upward correction, wave 2{-7}, is continuing. The B wave resumed trading overnight near the 23.6% Fibonacci retracement level, which is slightly below the upper boundary of the B wave’s price target range, 3764. The lower boundary of the range is at 3591. The price is approaching the 38.2% Fibonacci retracement level. The preceding wave A{-8} ended near the 50% retracement level.

The Fibonacci levels are marked in red on the chart. The price target boundaries are in blue.

Within wave B{-8}, the middle subwave, rising wave B{-9}, is underway. It will be followed by declining wave C{-9}, which will complete wave B{-8}.

Under the alternative analysis, wave B{-8} ended at 3704.25 on November 3. The subwaves within B{-8} so far seem extraordinarily shallow, and so this isn’t an analysis that I take seriously. Nonetheless, it’s not beyond the realm of possibility.

Under either scenario, the next movement is an upward wave.

The principal analysis labels the rise as wave B{-9}, and it will have three subwaves. The alternative analysis labels the rise as wave C{-8}, and it will have five subwaves. The subwave count will eventually determine which analysis is correct.

Wave 2{-7} is a subwave of downtrending wave 3{-6}, which began on August 16 from 4327.50. The 2nd wave upward correction will be followed by a powerful downtrending wave, 3{-7}, that will carry a price below the October 13 low, 3502, and most likely significantly below that level. After a 4th wave upward correction, wave 5{-7} will carry the price still lower and will complete wave 3{-6}.

Wave 3{-6} will be followed by a 4th wave upward correction and then by downtrending wave 5{-6}, which will likely carry the price lower still.

This is all happening within a nested series of 1st waves, ranging from wave 1{-5} to wave 1{-2}, all of which began on January 4. Their parent wave, which also began on January 4, is wave 4{-1}, the next-to-the-last wave within wave 5{0}, the final wave of an expanding Diagonal Triangle. Wave 5{0} began on December 26, 2018.

The “expanding” part of this Diagonal Triangle means that the highs keep getting higher and the lows lower, creating a sideways pattern that gets broader over time. After wave 4{-1} is complete, the final wave within the triangle, wave 5{-1}, will carry the price to new heights.

We Are Here.

These are the waves currently in progress under my principal analysis. Each line on the list shows the wave number, with the subscript in curly brackets, the traditional degree name, the starting date, the starting price of the S&P 500 E-mini futures, and the direction of the wave.

  • S&P 500 Index:
  • 5{+3} Supercycle, 7/8/1932, 4.40 (up)
  • 5{+2} Cycle, 12/9/1974, 60.96 (up)
  • 5{+1} Primary, 3/6/2009, 666.79 (up)
  • 5{0} Intermediate, 12/26/2018, 2346.58 (up)
  • 4{-1} Minor, 1/4/2022 4818.62 (down)
  • 1{-2} Minute, 1/4/2022 4818.62 (down)
  • S&P 500 Futures and index:
  • 1{-3} Minuette, 1/4/2022, 4808.25 (down) (futures), 4818.62 (down) (index)
  • S&P 500 Futures:
  • 1{-4} Subminuette, 1/4/2022, 4808.25 (down)
  • 1{-5} Micro, 1/4/2022, 4808.25 (down)
  • 3{-6} Submicro, 8/16/2022, 4327.50 (down)
  • 2{-7} Minuscule, 10/13/2022, 3502 (up)
  • B{-8} Subminuscule, 10/28/2022, 3924.25 (down)

Learning and other resources. Elliott wave analysis provides context, not prophecy. As the 20th century semanticist Alfred Korzybski put it in his book Science and Sanity (1933), “The map is not the territory … The only usefulness of a map depends on similarity of structure between the empirical world and the map.” And I would add, in the ever-changing markets, we can judge that similarity of structure only after the fact.

See the menu page Analytical Methods for a rundown on where to go for information on Elliott wave analysis.

By Tim Bovee, Portland, Oregon, November 7, 2022

Disclaimer

Tim Bovee, Private Trader tracks the analysis and trades of a private trader for his own accounts. Nothing in this blog constitutes a recommendation to buy or sell stocks, options or any other financial instrument. The only purpose of this blog is to provide education and entertainment.

No trader is ever 100 percent successful in his or her trades. Trading in the stock and option markets is risky and uncertain. Each trader must make trading decisions for his or her own account, and take responsibility for the consequences.

License
Creative Commons License

All content on Tim Bovee, Private Trader by Timothy K. Bovee is licensed under a Creative Commons Attribution-ShareAlike 4.0 International License.

Based on a work at www.timbovee.com.

Trader’s Notebook

3:30 p.m. New York time

Half an hour before the closing bell. The S&P 500 set a session high, 3805.50 on the futures, reached in the second hour of trading. The price then declined, trading narrowly between the 3710s and the 3750s. In Elliott wave terminology, wave B{-8}, the downward second wave within an upward correction, wave 2{-7}, is still underway. The price target range for the B wave endpoint is 3591 to 3764. The morning high was above the upper boundary and the price immediately withdrew into the target range, trading just below that upper boundary. I’ve updated the upper (near-term) chart.

9:35 a.m. New York time

What’s happening now? The S&P 500 E-mini futures fluctuated sideways in the mid-3700s overnight, breaking that pattern only once, with a dramatic 58-point swing lasting 5 minutes after the U.S. employment numbers were released. The price then settled back in the mid-3700s;

What does it mean? The fluctuation means little, just small bump in a larger decline that began on October 28 from 4924.25. The decline is the middle wave within an upward correction that began on October 13. That middle wave has carried the price from a 50% Fibonacci retracement (3915) of the downtrend that lasted from August 16 to October 13 down to a 23.6% retracement (3697).

The middle wave of the correction will be followed by a third and possibly final wave that is almost certain to carry the price above the 50% retracement level, and perhaps significantly so, up to the 61.8% (4012) Fibonacci retracement or the 78.6% retracement (4151).

This upward correction cannot exceed the starting point of the preceding downtrend, 4327.50. That’s the upper limit of its rise.

What are the alternatives? The middle leg of the upward correction has three waves internally and is in its third wave. It may have ended at Thursday’s low, 3704.25.

The upward correction will end with its third internal wave unless it forms a compound structure, linking two or three corrective patterns together.

Chart note. The Fibonacci ladder, an aid to tracking retracements, is shown on the chart in red. The likely price target range of the second wave of the corrective pattern is shown in with dashed lines.

[S&P 500 E-mini futures at 3:30 p.m., 200-minute bars, with volume]

What does Elliott wave theory say? An upward correction, wave 2{-7}, that began on October 13 from 3502 is underway, and the middle wave of the corrective pattern, wave B{-8}, is nearing its end. Wave B{-8} has remained within the likely range of its terminus, 3591 to 3764, since October 3. The B wave will be followed by rising wave C{-8}, the final wave of the corrective pattern, which will likely rise into the 4000s.

The end of wave B{-8} will be signaled by a dramatic move to the upside. That hasn’t happened yet, but it’s not unusual for an end point to be followed by some hesitation before the reversal kicks off.

Wave C{-8}, which will follow wave B{-8}, will rise beyond B{-8}’s starting point, perhaps significantly so.

The upward correction, wave 2{-7}, will end with wave C{-8}, unless it forms a compound corrective pattern. If that’s the case, then wave C{-8} will be followed by a declining connective wave, X{-8}, and then by a second corrective patterns.

Second waves, such as the present wave 2{-7}, are less likely to go compound than are the other corrective waves in a trend, the 4th waves.

Wave 3{-7}, a powerful downtrend, will follow wave 2{-7}, carrying the price significantly lower.

Encompassing all of this is wave 3{-6}, a downtrend that began on August 16 from 4327.50. It, in turn, is encompassed by a series of downtrending 1st waves that began on January 4 from 4818.62 on the index. In degree the nested series of 1st waves ranges from wave 1{-5}, the smallest, to wave 1{-2}, the largest, which in turn in encompassed by declining wave 4{-1}, the next-to-the-last wave within wave 5{0}, the final wave within an expanding Diagonal Triangle that began on December 26, 2018.

Those 1st waves are important to traders, because they show no matter how much optimism is generated by the upward corrections along the way, the direction of the S&P 500 is down, down, down. The upward corrections can be played by traders — I’ve bought and sold stocks all week that benefit from the wave 2{-7} rise of the S&P 500 — but I’ll be cautious and suspicious of upward moves until wave 5{-1} begins, the final wave of the expanding Diagonal Triangle that will carry the price back up 4818, most likely significantly above that level.

S&P 500 index at 9:30 a.m., 3-day bars]

We Are Here.

These are the waves currently in progress under my principal analysis. Each line on the list shows the wave number, with the subscript in curly brackets, the traditional degree name, the starting date, the starting price of the S&P 500 E-mini futures, and the direction of the wave.

  • S&P 500 Index:
  • 5{+3} Supercycle, 7/8/1932, 4.40 (up)
  • 5{+2} Cycle, 12/9/1974, 60.96 (up)
  • 5{+1} Primary, 3/6/2009, 666.79 (up)
  • 5{0} Intermediate, 12/26/2018, 2346.58 (up)
  • 4{-1} Minor, 1/4/2022 4818.62 (down)
  • 1{-2} Minute, 1/4/2022 4818.62 (down)
  • S&P 500 Futures and index:
  • 1{-3} Minuette, 1/4/2022, 4808.25 (down) (futures), 4818.62 (down) (index)
  • S&P 500 Futures:
  • 1{-4} Subminuette, 1/4/2022, 4808.25 (down)
  • 1{-5} Micro, 1/4/2022, 4808.25 (down)
  • 3{-6} Submicro, 8/16/2022, 4327.50 (down)
  • 2{-7} Minuscule, 10/13/2022, 3502 (up)
  • B{-8} Subminuscule, 10/28/2022, 3924.25 (down)

Learning and other resources. Elliott wave analysis provides context, not prophecy. As the 20th century semanticist Alfred Korzybski put it in his book Science and Sanity (1933), “The map is not the territory … The only usefulness of a map depends on similarity of structure between the empirical world and the map.” And I would add, in the ever-changing markets, we can judge that similarity of structure only after the fact.

See the menu page Analytical Methods for a rundown on where to go for information on Elliott wave analysis.

By Tim Bovee, Portland, Oregon, November 4, 2022

Disclaimer

Tim Bovee, Private Trader tracks the analysis and trades of a private trader for his own accounts. Nothing in this blog constitutes a recommendation to buy or sell stocks, options or any other financial instrument. The only purpose of this blog is to provide education and entertainment.

No trader is ever 100 percent successful in his or her trades. Trading in the stock and option markets is risky and uncertain. Each trader must make trading decisions for his or her own account, and take responsibility for the consequences.

License
Creative Commons License

All content on Tim Bovee, Private Trader by Timothy K. Bovee is licensed under a Creative Commons Attribution-ShareAlike 4.0 International License.

Based on a work at www.timbovee.com.

Trader’s Notebook

3:30 p.m. New York time

Half an hour before the closing bell. The S&P 500 fell during the session, to 3704.25, and then reversed, rising into the 3750s. In Elliott wave terminology, descending wave B{-8} is underway. It is the middle subwave of an upward correction that began on October 13, wave 2{-7}.

Just based on the short time that has passed since wave B{-8} began, it appears to be in its initial subwave, A{-9}. But there is always much ambiguity over degree labeling early in a price movement, so the subwave may be further along than that..

I’ve updated the chart, adding blue dashed lines showing the upper and lower boundaries of the wave B{-8} target range. So far this session, the price has remained below the upper boundary and within the target range.

9:35 a.m. New York time

What’s happening now? The S&P 500 E-mini futures fell sharply overnight, reaching the 3720s, about 200 points below the October 28 high.

What does it mean? The downward middle wave of an upward correction that began on October 13 is now underway. It is part of a downtrend that began on August 16.

What are the alternatives? The correction will have three subwaves, unless it forms a compound structure linking two or three corrective patterns together. This correction is the first of two upward corrections within the present downtrend, and it is the second correction that is more likely to be compounded.

Chart note. I’ve superimposed a Fibonacci ladder on the chart, in red, to better track the retracement by the correction of the decline since August 16.

[S&P 500 E-mini futures at 3:30 p.m., 200-minute bars, with volume]

What does Elliott wave theory say? Downtrending Wave B{-8} within an upward correction, wave 2{-7}, began on October 28 from 3924.25. The 2nd wave is taking the form of a Zigzag, with five waves within with A.

In Zigzags, the B wave tends to retrace between 38% and 79% of the distance covered by wave A. Wave A{-8} covered 422.25 points, ending at 3924.25. Therefore, the price target ranges from 3764 to 3591. The price at the opening bell is already within the target range. That’s a tendency, not a rule, so wave B could break below 3591.

Wave B{-8} will have three internal waves. Internally, wave A{-9} ended yesterday at 3907, and wave B{-9} began from that point. So by that count, wave B{-9} is not yet complete.

Wave B{-8} will be followed by uptrending wave C{-8}, the final wave in the Zigzag corrective pattern, with five subwaves. Wave C{-8} will most likely be the final subwave within wave 2{-7}, unless the upward correction forms a compound structure. If it does, wave C{-8} will be followed by a downward connective wave, X{-8}, and then a second corrective pattern.

In any case, wave 2{-7}, including wave B{-8}, will remain above 3502, the correction’s starting point.

This is all happening with wave 3{-6}, a downtrend that began on August 16, that in turn is enclosed in a series of nested 1st waves, from 1{-5} up to 1{-2}. They are all subwaves of wave 4{-1}, the next-to-the-last wave within a very large expanding Diagonal Triangle, wave 5{0}, which began on December 26, 2018.

We Are Here.

These are the waves currently in progress under my principal analysis. Each line on the list shows the wave number, with the subscript in curly brackets, the traditional degree name, the starting date, the starting price of the S&P 500 E-mini futures, and the direction of the wave.

  • S&P 500 Index:
  • 5{+3} Supercycle, 7/8/1932, 4.40 (up)
  • 5{+2} Cycle, 12/9/1974, 60.96 (up)
  • 5{+1} Primary, 3/6/2009, 666.79 (up)
  • 5{0} Intermediate, 12/26/2018, 2346.58 (up)
  • 4{-1} Minor, 1/4/2022 4818.62 (down)
  • 1{-2} Minute, 1/4/2022 4818.62 (down)
  • S&P 500 Futures and index:
  • 1{-3} Minuette, 1/4/2022, 4808.25 (down) (futures), 4818.62 (down) (index)
  • S&P 500 Futures:
  • 1{-4} Subminuette, 1/4/2022, 4808.25 (down)
  • 1{-5} Micro, 1/4/2022, 4808.25 (down)
  • 3{-6} Submicro, 8/16/2022, 4327.50 (down)
  • 2{-7} Minuscule, 10/13/2022, 3502 (up)
  • B{-8} Subminuscule, 10/28/2022, 3924.25 (down)

Learning and other resources. Elliott wave analysis provides context, not prophecy. As the 20th century semanticist Alfred Korzybski put it in his book Science and Sanity (1933), “The map is not the territory … The only usefulness of a map depends on similarity of structure between the empirical world and the map.” And I would add, in the ever-changing markets, we can judge that similarity of structure only after the fact.

See the menu page Analytical Methods for a rundown on where to go for information on Elliott wave analysis.

By Tim Bovee, Portland, Oregon, November 3, 2022

Disclaimer

Tim Bovee, Private Trader tracks the analysis and trades of a private trader for his own accounts. Nothing in this blog constitutes a recommendation to buy or sell stocks, options or any other financial instrument. The only purpose of this blog is to provide education and entertainment.

No trader is ever 100 percent successful in his or her trades. Trading in the stock and option markets is risky and uncertain. Each trader must make trading decisions for his or her own account, and take responsibility for the consequences.

License
Creative Commons License

All content on Tim Bovee, Private Trader by Timothy K. Bovee is licensed under a Creative Commons Attribution-ShareAlike 4.0 International License.

Based on a work at www.timbovee.com.

Trader’s Notebook

3:57 p.m. New York time

IBM earnings play exit. I’ve exited my short bear call options spread on IBM, two days before expiry. The earnings came in better than expected, and I spent two weeks of waiting for the price to come down to my expected maximum loss. It never did, and to avoid extra work and fees, I bought back the contracts, closing the position for a 50%+ loss. I’ve updated the trade analysis with full results.

3:30 p.m. New York time

Half an hour before the closing bell. The S&P 500 made like a yo-yo after the Federal Open Market Committee announced another 75-basis-point increase in the Federal Funds Rate, falling 26 points and the rising by 46.5 points, to 3899.25, within three minutes before settling down slightly below that high. It eventually worked its way a bit higher, to 3907, and then, six minutes into Fed Chair Jerome Powell’s news conference, it rapidly fell back, to 3841.

As Macbeth, Thane of Glamis, mused in Shakespeare’s play, the market’s response to the Fed was “full of sound and fury, signifying nothing”.

[S&P 500 E-mini futures at 2:41 p.m., 1-minute bars]

The movement was consistent with all three scenarios discussed this morning. Notably, the price remained below the 50% Fibonacci retracement level and also below the upward correction high so far of 3828, attained today before the opening bell. In Elliott wave terminology, the key outcome is that rising wave 2{-7}, the upward correction, is still underway, but whether that wave internally is in rising wave A{-8} or falling wave B{-8} remains an open question. I’ve updated the chart below.

9:35 a.m. New York time

What’s happening now? The S&P 500 E-mini futures fell in overnight trading, reaching the 3740s, more than 70 points below the high of the rise that began on October 13.

What does it mean? That rise, an upward correction is nearing the end of its first internal wave…

What are the alternatives? … and indeed, that initial wave of the correction may well have ended at yesterday’s peak.

If that sounds familiar, that’s because it is the same analysis as yesterday: Three possible scenarios with no way to choose from among them.

In addition to the principal analysis — first internal wave still rising — and the first alternative — first internal wave ended yesterday — there is a second alternative — the first leg of the correction is in its middle internal wave rather than the first. Details in the Elliott wave theory section below.

Chart note. I’ve placed the Fibonacci retracement ladder, in red, on the decline that began on August 16, which the rise from October 13 is correcting. So far the correction has taken back half of the preceding decline at yesterday’s peak, 3928.

[S&P 500 E-mini futures at 3:30 p.m., 3-hour bars, with volume]

What does Elliott wave theory say? All three scenarios are occurring within wave 2{-7}, an upward correction that began on October 13, which is part of an energetic downtrend, wave 3{-6}, that began on August 16.

The principal analysis sees wave A{-8} — the first subwave within wave 2{-7} — as being in its 5th and final internal wave, E{-9}.

The first alternative analysis sees wave A{-8} as having ended at yesterday’s high. Wave B{-8} under this scenario is now underway.

The second alternative sees wave A{-8} as being in its middle subwave, which is wave C{-9}.

See yesterday’s “Trader’s Notebook” for a more detailed explanation of the three scenarios.

We Are Here.

These are the waves currently in progress under my principal analysis. Each line on the list shows the wave number, with the subscript in curly brackets, the traditional degree name, the starting date, the starting price of the S&P 500 E-mini futures, and the direction of the wave.

  • S&P 500 Index:
  • 5{+3} Supercycle, 7/8/1932, 4.40 (up)
  • 5{+2} Cycle, 12/9/1974, 60.96 (up)
  • 5{+1} Primary, 3/6/2009, 666.79 (up)
  • 5{0} Intermediate, 12/26/2018, 2346.58 (up)
  • 4{-1} Minor, 1/4/2022 4818.62 (down)
  • 1{-2} Minute, 1/4/2022 4818.62 (down)
  • S&P 500 Futures and index:
  • 1{-3} Minuette, 1/4/2022, 4808.25 (down) (futures), 4818.62 (down) (index)
  • S&P 500 Futures:
  • 1{-4} Subminuette, 1/4/2022, 4808.25 (down)
  • 1{-5} Micro, 1/4/2022, 4808.25 (down)
  • 3{-6} Submicro, 8/16/2022, 4327.50 (down)
  • 2{-7} Minuscule, 10/13/2022, 3502 (up)
  • B{-8} Subminuscule, 10/16/2022, 3897.50 (down)

Learning and other resources. Elliott wave analysis provides context, not prophecy. As the 20th century semanticist Alfred Korzybski put it in his book Science and Sanity (1933), “The map is not the territory … The only usefulness of a map depends on similarity of structure between the empirical world and the map.” And I would add, in the ever-changing markets, we can judge that similarity of structure only after the fact.

See the menu page Analytical Methods for a rundown on where to go for information on Elliott wave analysis.

By Tim Bovee, Portland, Oregon, November 2, 2022

Disclaimer

Tim Bovee, Private Trader tracks the analysis and trades of a private trader for his own accounts. Nothing in this blog constitutes a recommendation to buy or sell stocks, options or any other financial instrument. The only purpose of this blog is to provide education and entertainment.

No trader is ever 100 percent successful in his or her trades. Trading in the stock and option markets is risky and uncertain. Each trader must make trading decisions for his or her own account, and take responsibility for the consequences.

License
Creative Commons License

All content on Tim Bovee, Private Trader by Timothy K. Bovee is licensed under a Creative Commons Attribution-ShareAlike 4.0 International License.

Based on a work at www.timbovee.com.

Trader’s Notebook

3:30 p.m. New York time

Half an hour before the closing bell. The S&P 500 fell slightly during the session, from the overnight high, 3928 on the futures, into the 3850s. The decline is insufficient to support a choice from among the three scenarios I presented in this morning’s analysis, so I’ve kept the principal analysis in place while repeating the caveat: Any one of the three scenarios has a good chance of describing how the market will play out.

If the price reverses and climbs to a new high, then two scenarios are still in the running within the upward correction, wave 2{-7}. Either wave A{-8} is still underway and is in its final wave, E{-9}. Or instead of the final wave with A{8}, wave C{-9}, the middle wave, is underway and is in its final subwave, E{-10}.

And if that isn’t enough to satisfy our hunger for ambiguity, it could also be that wave A{-8} ended overnight at 3928 and wave B{-8} has begun.

Is Elliott wave analysis fun or what!?! I’ve updated the chart.

9:35 a.m. New York time

What’s happening now? The S&P 500 E-mini futures continued to hover around the 50% Fibonacci retracement level as the rise that began on October 13 continues.

What does it mean? The rise is an upward correction, and the first wave within that correction is in its 5th internal wave and therefore is nearing its end. It will be followed by a declining middle wave, and then by a final, rising wave that will end the corrective pattern.

What are the alternatives? At this point each new high could be the end of the first wave within the correction. Or not. I’ve marked the chart to show the first wave continuing, but the odds of either scenario playing are are pretty much equal.

Also, the chart can be counted in such way that the present rise is the middle wave within the first subwave of the correction. That increases the amount of upside that lies ahead.

Chart note. The Fibonacci ladder appears on the chart in red.

[S&P 500 E-mini futures at 3:30 p.m., 3-hour bars, with volume]

What does Elliott wave theory say? Wave A{-8}, the first wave within an upward correction, wave 2{-7}, is nearing its end. The corrective pattern has three waves internally. Declining wave B{-8} will follow, and then rising wave C{-8} will complete the corrective pattern, and most likely the correction as a whole, unless it turns out to be a compound structure, linking two or three corrective patterns together.

That’s the principal analysis. Under the alternative analysis, wave A{-8} ended at the overnight high, 3928, and downward wave B{-8} has begun.

And then there’s the pesky problem of assigning a degree to waves. Under the principal analysis, wave A{-8} internally is in its final subwave, E{-9}. An alternative count would see the wave C{-9} rise following the end of wave B{-9} as being a subwave rather than being C{-9} in its entirely.

So under that scenario,

  • the place marked C{-9} becomes A{-10}, D{-9} becomes B{-10},
  • and the longer rise above the 38.2% Fibonacci level becomes C{-10},
  • then a small decline for D{-10}
  • and a so-far small rise for E{-10}, the present wave which, when complete, will mark the end of wave C{-9}.

Under this scenario, we have a wave D{-9} decline ahead, and then a rising wave E{-9} that will complete wave A{-8} within the wave 2{-7} correction.

And enclosing these alternatives is downtrending wave 3{-6}, which began on August 16. It is a subwave of a series of nested 1st waves, each bigger than the last, reaching up to wave 1{-2}. The parent wave of that nested series is wave 4{-1}, the declining next-to-the-last wave within an expanding Diagonal Triangle that began on December 26, 2018.

We Are Here.

These are the waves currently in progress under my principal analysis. Each line on the list shows the wave number, with the subscript in curly brackets, the traditional degree name, the starting date, the starting price of the S&P 500 E-mini futures, and the direction of the wave.

  • S&P 500 Index:
  • 5{+3} Supercycle, 7/8/1932, 4.40 (up)
  • 5{+2} Cycle, 12/9/1974, 60.96 (up)
  • 5{+1} Primary, 3/6/2009, 666.79 (up)
  • 5{0} Intermediate, 12/26/2018, 2346.58 (up)
  • 4{-1} Minor, 1/4/2022 4818.62 (down)
  • 1{-2} Minute, 1/4/2022 4818.62 (down)
  • S&P 500 Futures and index:
  • 1{-3} Minuette, 1/4/2022, 4808.25 (down) (futures), 4818.62 (down) (index)
  • S&P 500 Futures:
  • 1{-4} Subminuette, 1/4/2022, 4808.25 (down)
  • 1{-5} Micro, 1/4/2022, 4808.25 (down)
  • 3{-6} Submicro, 8/16/2022, 4327.50 (down)
  • 2{-7} Minuscule, 10/13/2022, 3502 (up)
  • B{-8} Subminuscule, 10/16/2022, 3897.50 (down)

Learning and other resources. Elliott wave analysis provides context, not prophecy. As the 20th century semanticist Alfred Korzybski put it in his book Science and Sanity (1933), “The map is not the territory … The only usefulness of a map depends on similarity of structure between the empirical world and the map.” And I would add, in the ever-changing markets, we can judge that similarity of structure only after the fact.

See the menu page Analytical Methods for a rundown on where to go for information on Elliott wave analysis.

By Tim Bovee, Portland, Oregon, November 1, 2022

Disclaimer

Tim Bovee, Private Trader tracks the analysis and trades of a private trader for his own accounts. Nothing in this blog constitutes a recommendation to buy or sell stocks, options or any other financial instrument. The only purpose of this blog is to provide education and entertainment.

No trader is ever 100 percent successful in his or her trades. Trading in the stock and option markets is risky and uncertain. Each trader must make trading decisions for his or her own account, and take responsibility for the consequences.

License
Creative Commons License

All content on Tim Bovee, Private Trader by Timothy K. Bovee is licensed under a Creative Commons Attribution-ShareAlike 4.0 International License.

Based on a work at www.timbovee.com.

Trader’s Notebook

3:30 p.m. New York time

Half an hour before the closing bell. The S&P 500 drifted downward during the day, with the futures reaching down into the 3870s. This morning’s analysis remains unchanged. I’ve updated the chart.

9:35 a.m. New York time

What’s happening now? The S&P 500 E-mini futures reach 3924.25 late in Friday’s session and then retreated slightly, remaining below that price after trading resumed overnight.

What does it mean? Friday’s high was slightly more than a 50% retracement of the decline that began on August 16 from 4327.50. A 50% retracement is a Fibonacci level, a point where prices tend to pause or change directions. It’s possible that Friday’s high marks the end of the first leg of an upward correction that began on October 13 from 3502.

But it’s not a certainty, and so we’re back to where we were much of last week; If the price rises to a new high, then the first leg of the upward correction is still underway …

What are the alternatives? … but if the price declines further, it remains possible that 3924.25 was the end of the correction’s first leg and the beginning of the second leg. The further the price falls, the more likely the alternative scenario is.

Chart note: I’ve superimposed the Fibonacci ladder on the chart, in red. Friday’s high pierced the 50% Fib level, and overnight trading remained in that level’s neighborhood. The next major Fibonacci retracement level is 71.6%, at around 4150.

[S&P 500 E-mini futures at 3:30 p.m., 3-hour bars, with volume]

What does Elliott wave theory say? Under the principal analysis, wave A{-8}, the initial wave within an upward correction, wave 2{-7}, is still underway and will push ahead to new heights. When wave A{-8} is complete, it will be followed by wave B{-8}, the declining middle wave of the upward corrective pattern.

Under the principal analysis, wave A{-8} is still underway. Under the alternative analysis, wave A{-8} ended at Friday’s high, and wave B{-8} began and is in its early stages.

Whenever it begins, wave B{-8} will have three waves internally, and it will remain above the starting point of the upward correction, 3502.

The final wave of the corrective pattern will be wave C{-8}, with five subwaves. It will most likely rise above the end of the preceding A wave.

The end of wave C{-8} will most likely be the end of the upward correction, although it is possible that wave 2{-7} will form a compound structure, linking two or three corrective patterns together.

Wave 2{-7} will be followed by a powerful decline, wave 3{-7}, which will carry the price significantly lower.

This is all happening within wave 3{-6}, itself a powerful declining wave, which began on August 16. Wave 3{-6} is enclosed by a nested series of 1st waves of increasing size, from wave 1{-5} to wave 1{-2}, four degrees larger. Those 1st waves all began on January 4, the start of the slow crash that has defined the markets this year.

Enclosing them all is wave 4{-1}, which also began on January 4. It is the next-to-the-last wave within an expanding Diagonal Triangle, wave 5{0}, which began on December 26, 2018.

The long-term analysis tells me to treat upward movements with caution, as short-term moments of cheer within a steady, dismal, dreary decline.

We Are Here.

These are the waves currently in progress under my principal analysis. Each line on the list shows the wave number, with the subscript in curly brackets, the traditional degree name, the starting date, the starting price of the S&P 500 E-mini futures, and the direction of the wave.

  • S&P 500 Index:
  • 5{+3} Supercycle, 7/8/1932, 4.40 (up)
  • 5{+2} Cycle, 12/9/1974, 60.96 (up)
  • 5{+1} Primary, 3/6/2009, 666.79 (up)
  • 5{0} Intermediate, 12/26/2018, 2346.58 (up)
  • 4{-1} Minor, 1/4/2022 4818.62 (down)
  • 1{-2} Minute, 1/4/2022 4818.62 (down)
  • S&P 500 Futures and index:
  • 1{-3} Minuette, 1/4/2022, 4808.25 (down) (futures), 4818.62 (down) (index)
  • S&P 500 Futures:
  • 1{-4} Subminuette, 1/4/2022, 4808.25 (down)
  • 1{-5} Micro, 1/4/2022, 4808.25 (down)
  • 3{-6} Submicro, 8/16/2022, 4327.50 (down)
  • 2{-7} Minuscule, 10/13/2022, 3502 (up)
  • B{-8} Subminuscule, 10/16/2022, 3897.50 (down)

Learning and other resources. Elliott wave analysis provides context, not prophecy. As the 20th century semanticist Alfred Korzybski put it in his book Science and Sanity (1933), “The map is not the territory … The only usefulness of a map depends on similarity of structure between the empirical world and the map.” And I would add, in the ever-changing markets, we can judge that similarity of structure only after the fact.

See the menu page Analytical Methods for a rundown on where to go for information on Elliott wave analysis.

By Tim Bovee, Portland, Oregon, October 31, 2022

Disclaimer

Tim Bovee, Private Trader tracks the analysis and trades of a private trader for his own accounts. Nothing in this blog constitutes a recommendation to buy or sell stocks, options or any other financial instrument. The only purpose of this blog is to provide education and entertainment.

No trader is ever 100 percent successful in his or her trades. Trading in the stock and option markets is risky and uncertain. Each trader must make trading decisions for his or her own account, and take responsibility for the consequences.

License
Creative Commons License

All content on Tim Bovee, Private Trader by Timothy K. Bovee is licensed under a Creative Commons Attribution-ShareAlike 4.0 International License.

Based on a work at www.timbovee.com.

Trader’s Notebook

3:30 p.m. New York time

Half an hour before the closing bell. The S&P 500 reversed to upside during the session, moving above the October 26 high of 3897.50 on the futures to a new peak, 3913.75, precisely retracing half of the decline from August 16.

The reversal means that this morning principal analysis no longer matches the chart. The alternative analysis has been promoted to principal status.

Under the new principal analysis, the first subwave within the upward correction that began on October 13 is still underway and internally is in its final segment. In Elliott wave terminology: Wave A{-8} within the upward correction, wave 2{-7}, is still underway and internally is in wave E{-9}, the final wave of wave A{-8}.

The new alternative analyses concern where the chart stands within wave A{-8}:

Alternative #1: The sharp rise during today’s session is the middle wave, C{-9}, within wave A{-8}.

Alternative #2: As has been the case for days, any new peak in the rise since October 13 can be seen as the end of wave A{-8}, and we’ll know whether that was the end only when we’ve seen what happens afterward. It’s a truism: 20-20 hindsight is an analysts’s best friend.

9:55 a.m. New York time

XOM earnings play exit. I’ve exited my short bull put options spread on XOM for 21.1% of maximum potential profit and have updated the trade analysis with full results.

9:35 a.m. New York time

What’s happening now? The S&P 500 E-mini futures traded sideways overnight. The price remained above a low of 3757.50 set by a sharp decline in the last half hour of yesterday’s session, and below the high of 3870.75 set early in that session.

What does it mean? The decline was sufficient to persuade me that the downward middle wave of the upward correction has begun from the October 26 peak, 3897.50, with a price target ranging from the 3740s to the 3580s.

What are the alternatives? The decline from the October 26 peak is a correction within the first wave of the upward correction. The more the price falls, the less likely this scenario becomes.

[S&P 500 E-mini futures at 3:30 p.m., 3-hour bars, with volume]

What does Elliott wave theory say? Declining wave B{-8} is now underway, a subwave of an upward correction, wave 2{-7}, that began on October 13 from 3502. The first wave of the corrective pattern, wave A{-8}, ended on October 26 at 3897.50.

The B wave within a 2nd wave tends to retrace between 38% and 79% of the preceding A wave. Wave A{-8} covered a distance of 395.50 points, giving a price target of 3747 for the shortest correction, and 3585 for the longest. Or, of course, somewhere in between. Those targets result from a tendency, not a strict rule, according to the tenants of Elliott wave analysis.

Wave 2{-7} has taken the form of a Zigzag, and that means there is a strict rule that wave B{-8} cannot move below the starting point of wave A{-8}. That rule sets 3502 as an absolute limit on how far B{-8} can decline. Caveat: My analysis is of the S&P 500 futures, whose price moves in 25-cent increments. In the past I’ve seen futures prices go slightly beyond the boundary set by a strict rule. I think it’s a matter of rounding error caused by the 25-cent increment in pricing.

A Zigzag has five subwaves within the A wave, and that wave is complete. There will be three subwaves within the B wave, now underway. And after wave B is complete, a rising wave C{-8}, with five subwaves, will carry the price back up, most likely higher than the peak of wave A, 3897.50.

Wave C{-8} will complete wave 2{-7}, unless the 2nd wave takes a compound form that links together two or three corrective patterns. A 2nd wave is less likely form a compound structure than is a 4th wave, which is the other corrective wave in a trend.

Wave 2{-7} will be followed by an energetic decline to the downside, wave 3{-7}, which will carry the price below 3502, the starting point of wave 2{-7}, and most likely significantly below that level.

This is all happening within downward wave 3{-6}, which began on August 16 from 4327.50. It is contained within a series of nested downtrending 1st waves up to wave 1{-2}, which is a subwave of wave 4{-1}, the next to the last wave within a large expanding Diagonal Triangle, wave 5{0}, which began on December 26, 2018 from 2346.58 on the index.

We Are Here.

These are the waves currently in progress under my principal analysis. Each line on the list shows the wave number, with the subscript in curly brackets, the traditional degree name, the starting date, the starting price of the S&P 500 E-mini futures, and the direction of the wave.

  • S&P 500 Index:
  • 5{+3} Supercycle, 7/8/1932, 4.40 (up)
  • 5{+2} Cycle, 12/9/1974, 60.96 (up)
  • 5{+1} Primary, 3/6/2009, 666.79 (up)
  • 5{0} Intermediate, 12/26/2018, 2346.58 (up)
  • 4{-1} Minor, 1/4/2022 4818.62 (down)
  • 1{-2} Minute, 1/4/2022 4818.62 (down)
  • S&P 500 Futures and index:
  • 1{-3} Minuette, 1/4/2022, 4808.25 (down) (futures), 4818.62 (down) (index)
  • S&P 500 Futures:
  • 1{-4} Subminuette, 1/4/2022, 4808.25 (down)
  • 1{-5} Micro, 1/4/2022, 4808.25 (down)
  • 3{-6} Submicro, 8/16/2022, 4327.50 (down)
  • 2{-7} Minuscule, 10/13/2022, 3502 (up)
  • B{-8} Subminuscule, 10/16/2022, 3897.50 (down)

Learning and other resources. Elliott wave analysis provides context, not prophecy. As the 20th century semanticist Alfred Korzybski put it in his book Science and Sanity (1933), “The map is not the territory … The only usefulness of a map depends on similarity of structure between the empirical world and the map.” And I would add, in the ever-changing markets, we can judge that similarity of structure only after the fact.

See the menu page Analytical Methods for a rundown on where to go for information on Elliott wave analysis.

By Tim Bovee, Portland, Oregon, October 28, 2022

Disclaimer

Tim Bovee, Private Trader tracks the analysis and trades of a private trader for his own accounts. Nothing in this blog constitutes a recommendation to buy or sell stocks, options or any other financial instrument. The only purpose of this blog is to provide education and entertainment.

No trader is ever 100 percent successful in his or her trades. Trading in the stock and option markets is risky and uncertain. Each trader must make trading decisions for his or her own account, and take responsibility for the consequences.

License
Creative Commons License

All content on Tim Bovee, Private Trader by Timothy K. Bovee is licensed under a Creative Commons Attribution-ShareAlike 4.0 International License.

Based on a work at www.timbovee.com.

XOM Trade

Exxon Mobil Corp. (XOM)

Lot 2022-2

Update 10/28/2022: I exited my short bull put vertical spread on XOM, 21 days before expiration, for a $0.71 debit per contract/share, a profit before fees of $9 per contract. Shares were trading at $110.63, up $2.44 from the entry level.

The Implied Volatility Rank at exit was 50.8%,up 2.3 points from the entry level.

I exited on the day after entry because the position reached 21.1% of maximum potential profit, to my minimum target of 25% of max.

Shares rose by 2.3% over one day for a +823% annual rate. The options position produced a 12.7% return for a +4,627% annual rate.


I have entered a short bull put vertical spread on XOM, using options that trade for the last time 22 days hence, on November 18. The premium is a $0.90 credit per contract share and the stock at the time of entry was priced at $108.19.

The Implied Volatility Ratio stood at 48.5%.

Premium:$0.90Expire OTM
XOM-bull put spreadStrikeOddsDelta
Puts
Long106.0046.0%39
Break-even108.9047.5%42.5
Short108.0049.0%46

The premium is 90% of the width of the position’s short/long spread. The profit zone covers a 0.7% move to the downside and an unlimited move to the upside.

The risk/reward ratio is 1.2:1, with maximum risk of $110 and maximum reward of $90 per contract.

How I chose the trade. The trade was placed to coincide with XOM’s earnings announcement, before the closing bell after the day of entry. The short strikes were set to coincide with the expected move of $2.91 either way, based on options pricing, which gives a price range of $105.28 to $111.10. The Zacks Investment Research earnings surprise predictor gave XOM a score of 1.39%, with a rank of Buy (2). The analysts’ consensus is that XOM will announce earnings of $3.88 per share.

By Tim Bovee, Portland, Oregon, October 27, 2022

Disclaimer

Tim Bovee, Private Trader tracks the analysis and trades of a private trader for his own accounts. Nothing in this blog constitutes a recommendation to buy or sell stocks, options or any other financial instrument. The only purpose of this blog is to provide education and entertainment.

No trader is ever 100 percent successful in his or her trades. Trading in the stock and option markets is risky and uncertain. Each trader must make trading decisions for his or her own account, and take responsibility for the consequences.

License
Creative Commons License

All content on Tim Bovee, Private Trader by Timothy K. Bovee is licensed under a Creative Commons Attribution-ShareAlike 4.0 International License.

Based on a work at www.timbovee.com.