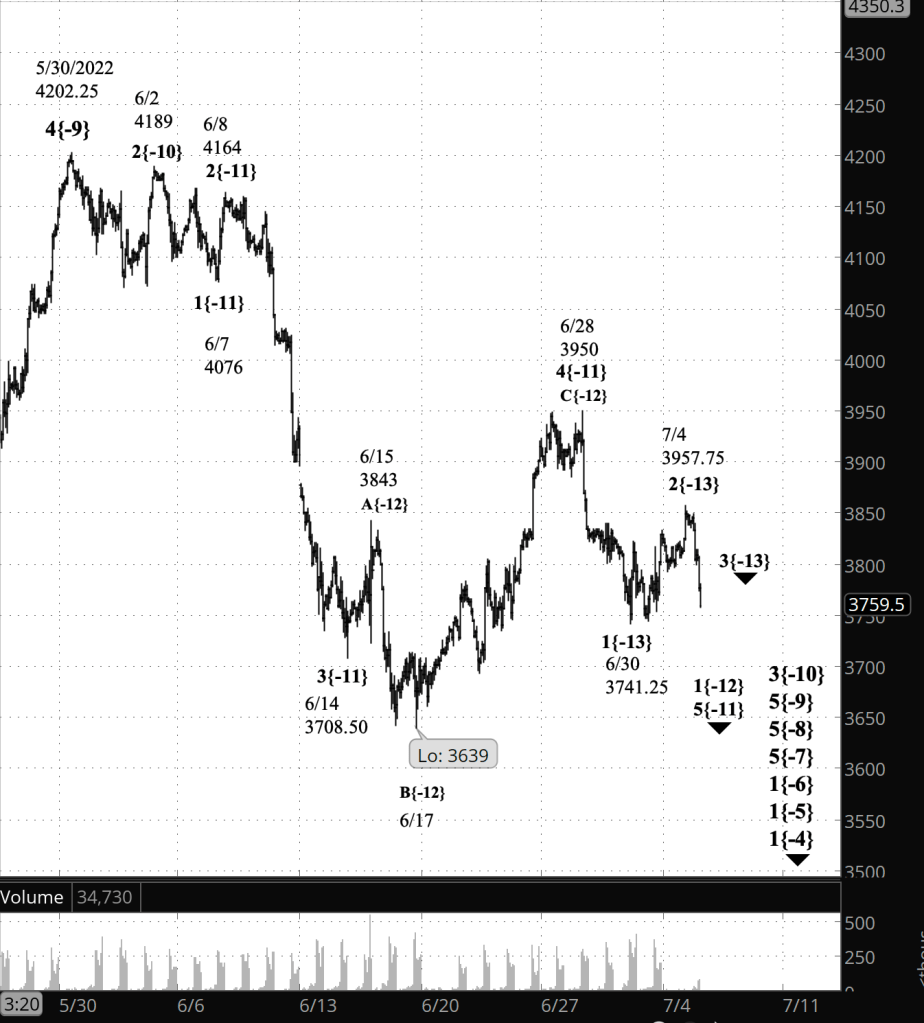
3:30 p.m. New York time
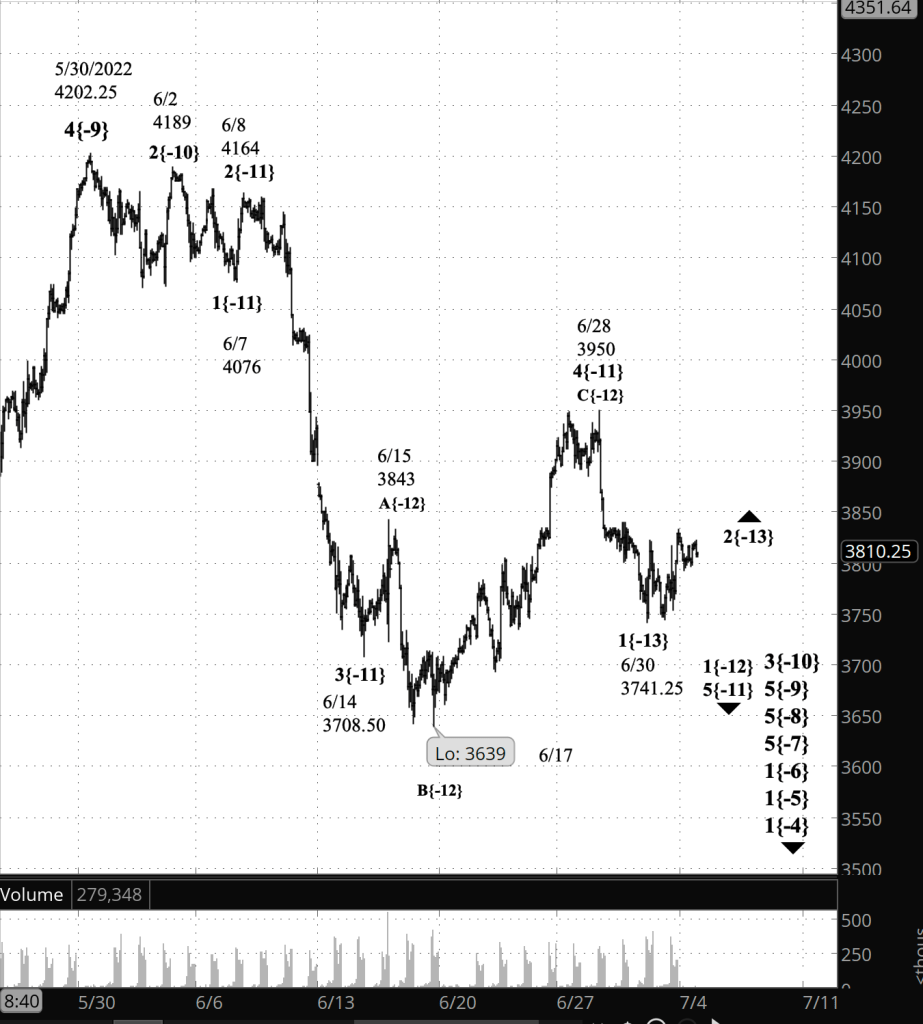
Half an hour before the closing bell. The S&P 500 zigzagged during the day, rising to 3876.50 on the futures and then falling below the overnight low, to 3819.50. The rise is consistent with a B wave, followed by a declining C wave, within wave 4{-15}. (See the Elliott wave analysis section below.) I’ve updated the chart.
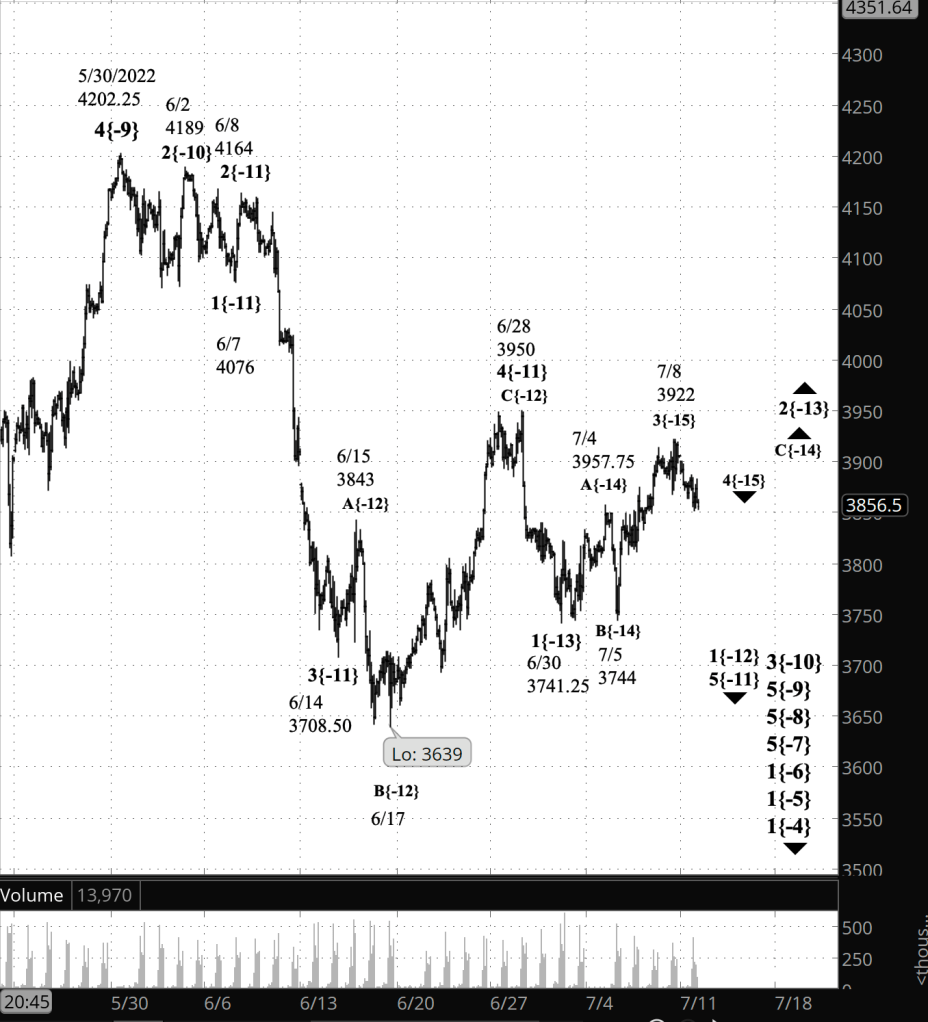
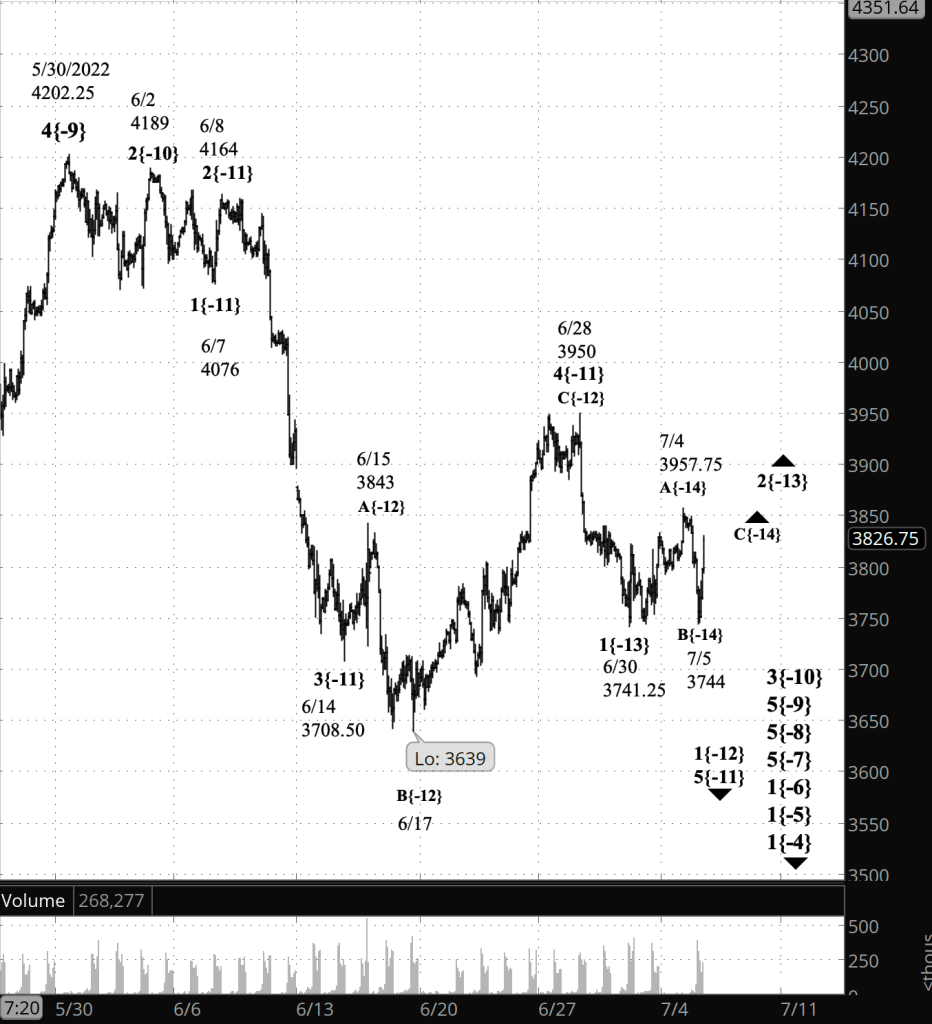
9:35 a.m. New York time
What’s happening now? The S&P 500 E-mini futures continued to fall overnight, reaching into the lower 3800s before rising slightly.
What does it mean? The downward correction that began on June 30 continues to work through its end game. The 3rd and final leg of the correction is in its next-to-the-last segment, a small declining correction that will be followed by a final upward push and then a resumption of the downtrend that began on June 28,
What are the alternatives? There are two.
Alternative #1: The July 8 high was the end of the upward correction, and the downtrend has resumed.
Alternative #2: The 3rd leg will be the end of a corrective pattern but not the end of the upward correction. Instead, it will be connected to a second corrective pattern, and after that possibly to a third, significantly delaying completion of upward correction. When the compound correction is complete, then the downtrend will resume.
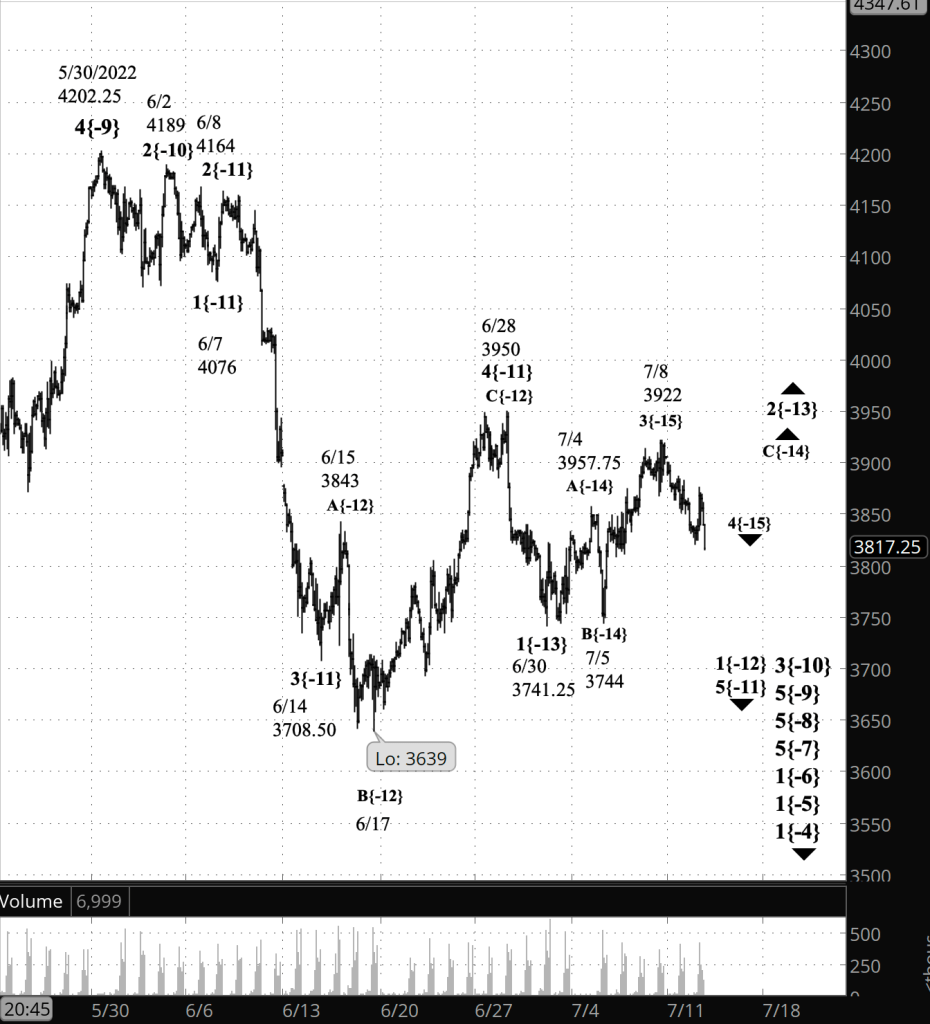
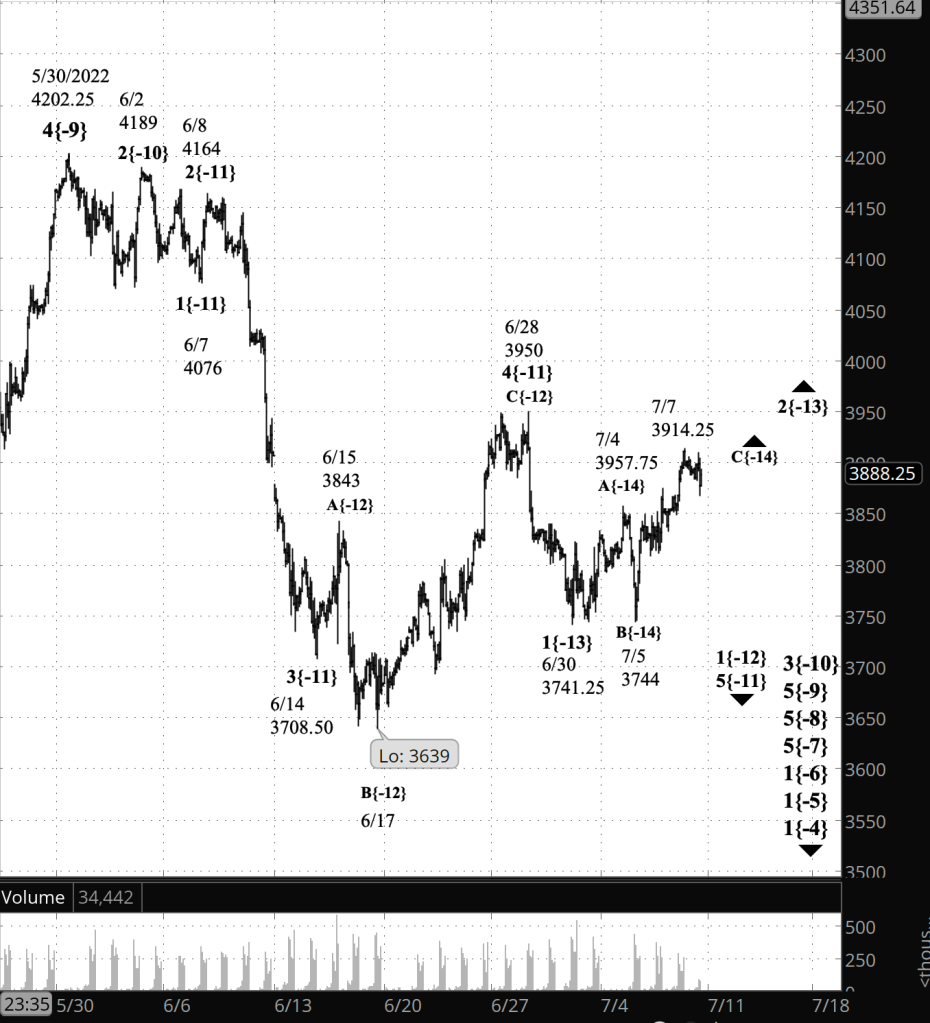
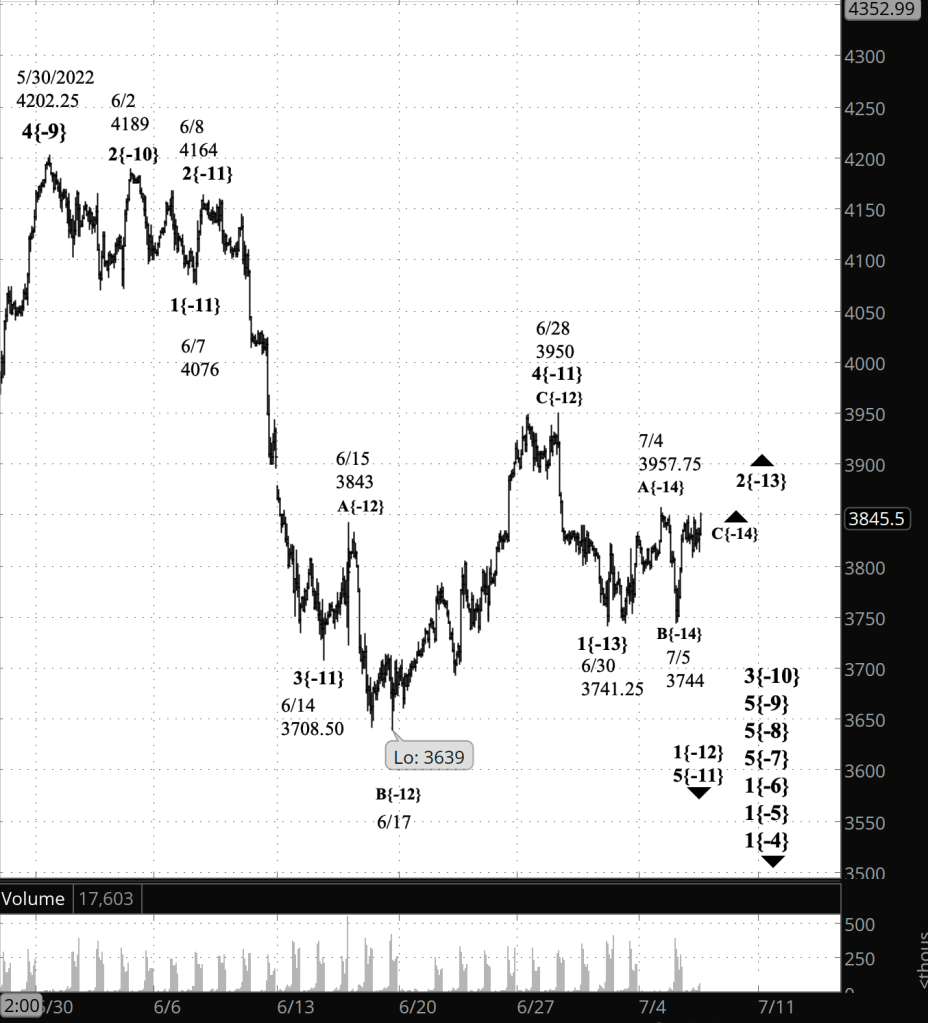
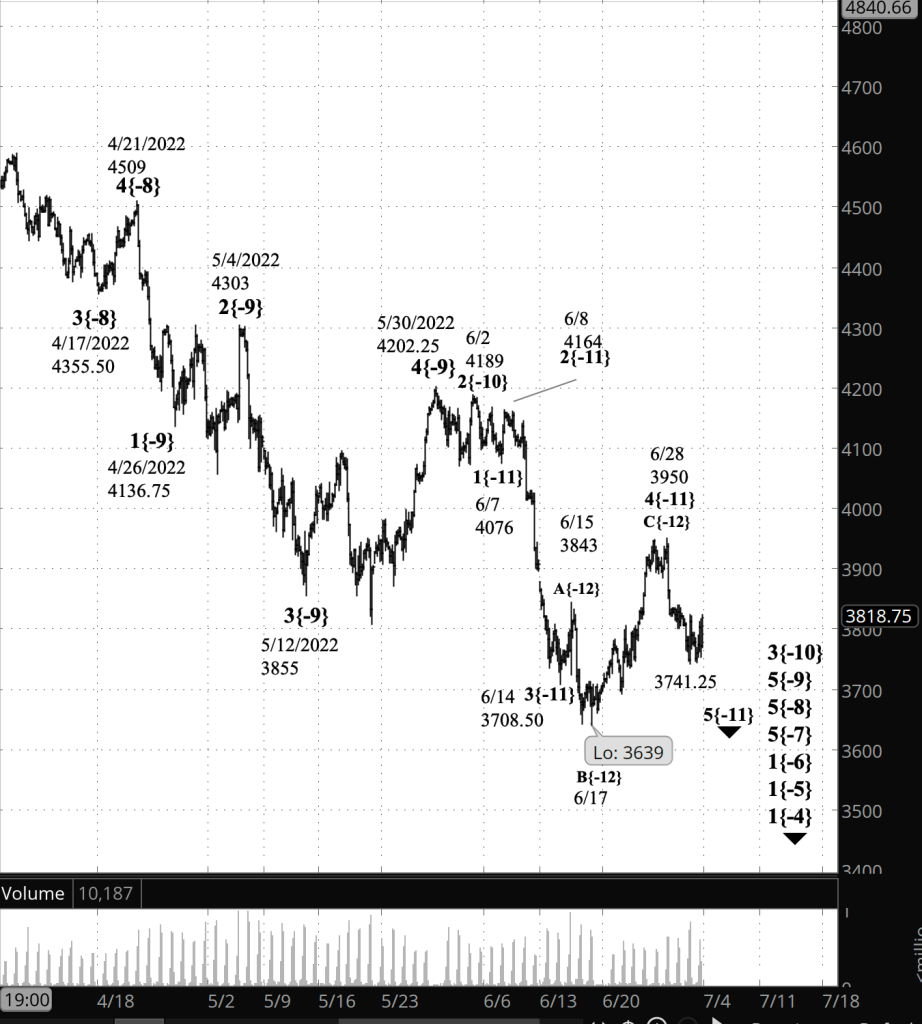
What does Elliott wave theory say? Under the principal analysis, the upward correction, wave 2{-13} is in its final wave, C{-14}, which in turn is in the 4th of 5 waves — wave 4{-15}.
Under alternative #1, the July 8 high, 3922, was the end of the upward correction, wave 2{-13}, and wave 3{-13} has begun. Like most 3rd waves, it will show a great deal of energy as it carries the price significantly below 3639, the lowest point reached since the January 4th peak triggered a large downtrend that is still in its early stages.
Under alternative #2, wave 2{-13} will form a compound correction. Wave C{-14} will be followed by a declining connector wave, X{-15}, which in turn will be followed by a second and then perhaps a third corrective pattern, forming a compound correction.
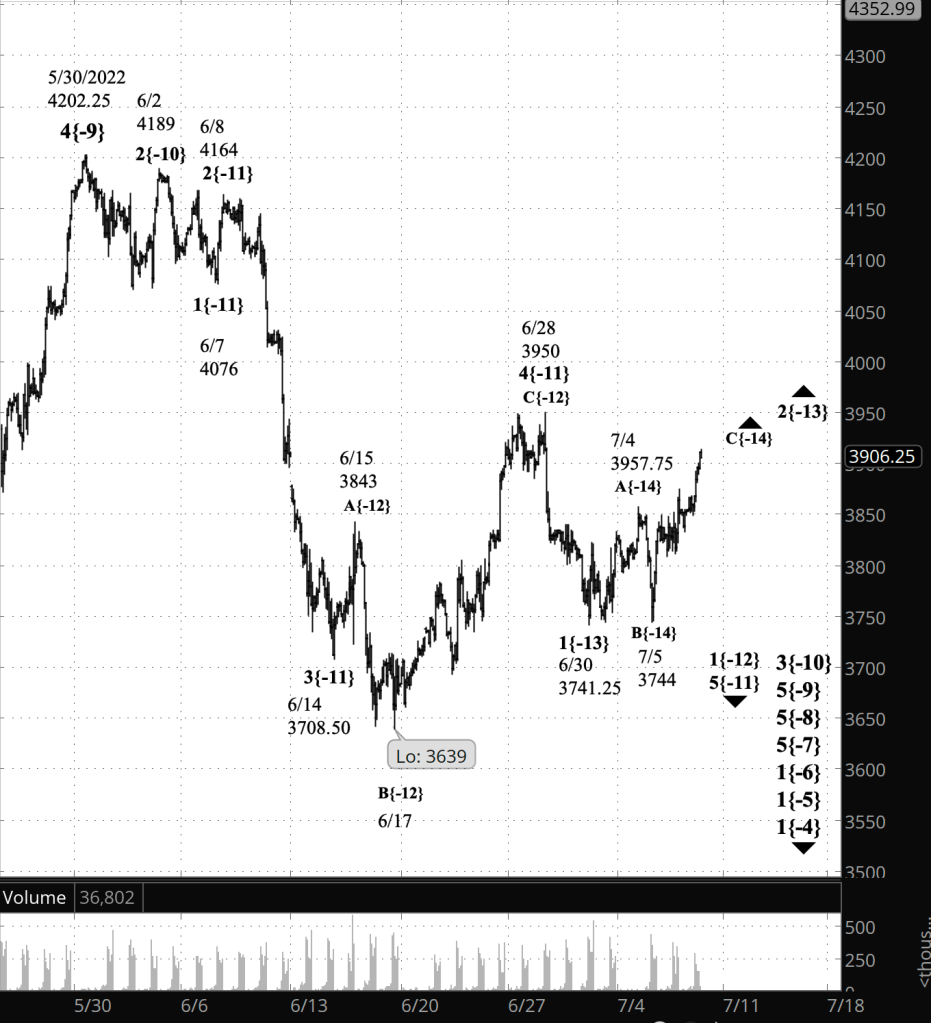
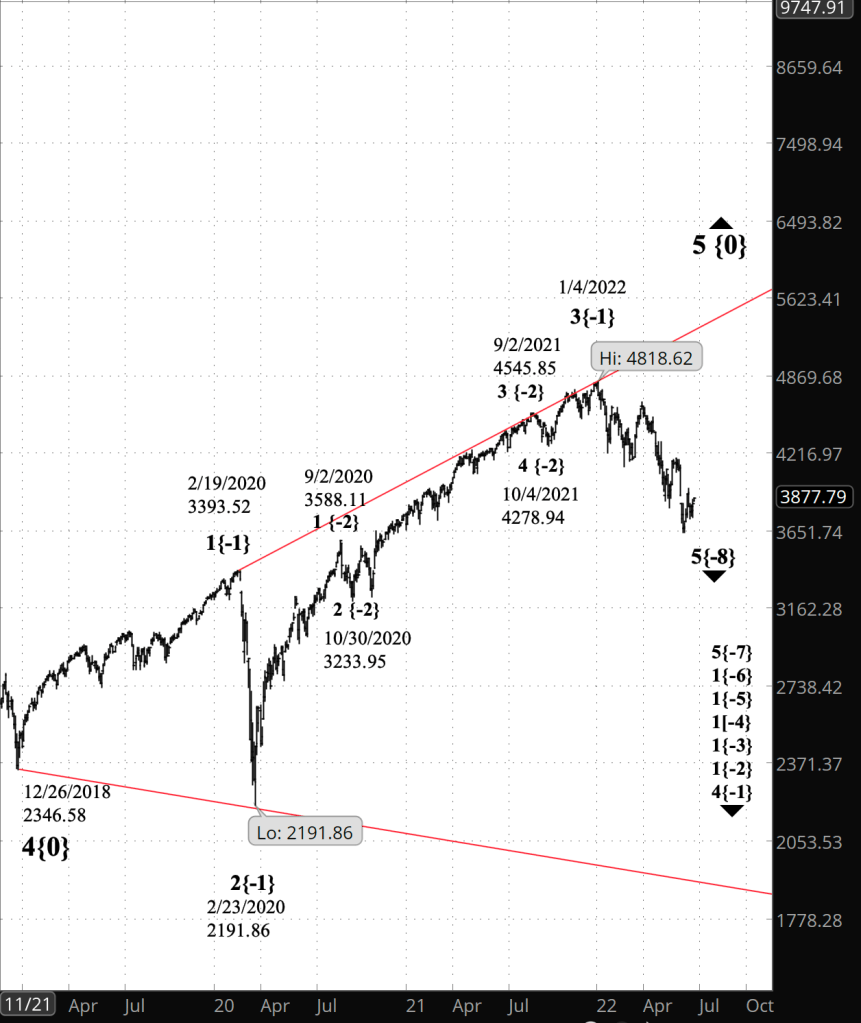
The January 4 peak I referred to above marked the end of rising wave 3{-1}, which began on February 23, 2020, from the low point of the early pandemic crash. Declining wave 4{-1} followed. Within it are a series of downtrending waves, the smaller nested within the larger. The smaller waves on the list are the upward correction, wave 2{-13}, its parent, wave 1{-12}, within wave 3{-10} within wave 5{-9}. From this point, the nested waves pick up with the “We Are Here” list below, from wave 5{-8} at the bottom and then working upward.
We Are Here.
These are the waves currently in progress under my principal analysis. Each line on the list shows the wave number, with the subscript in curly brackets, the traditional degree name, the starting date, the starting price of the S&P 500 E-mini futures, and the direction of the wave.
- S&P 500 Index:
- 5{+3} Supercycle, 7/8/1932, 4.40 (up)
- 5{+2} Cycle, 12/9/1974, 60.96 (up)
- 5{+1} Primary, 3/6/2009, 666.79 (up)
- 5{0} Intermediate, 12/26/2018, 2346.58 (up)
- 4{-1} Minor, 1/4/2022 4818.62 (down)
- 1{-2} Minute, 1/4/2022 4818.62 (down)
- S&P 500 Futures and index:
- 1{-3} Minuette, 1/4/2022, 4808.25 (down) (futures), 4818.62 (down) (index)
- S&P 500 Futures:
- 1{-4} Subminuette, 1/4/2022, 4808.25 (down)
- 1{-5} Micro, 1/4/2022, 4808.25 (down)
- 1{-6} Submicro, 1/4/2022, 4808.25 (down)
- 5{-7} Minuscule, 3/29/2022, 4631 (down)
- 5{-8} Subminuscule, 4/21/2022, 4509, (down)
Learning and other resources. Elliott wave analysis provides context, not prophecy. As the 20th century semanticist Alfred Korzybski put it in his book Science and Sanity (1933), “The map is not the territory … The only usefulness of a map depends on similarity of structure between the empirical world and the map.” And I would add, in the ever-changing markets, we can judge that similarity of structure only after the fact.
See the menu page Analytical Methods for a rundown on where to go for information on Elliott wave analysis.
By Tim Bovee, Portland, Oregon, July 12, 2022
Disclaimer
Tim Bovee, Private Trader tracks the analysis and trades of a private trader for his own accounts. Nothing in this blog constitutes a recommendation to buy or sell stocks, options or any other financial instrument. The only purpose of this blog is to provide education and entertainment.
No trader is ever 100 percent successful in his or her trades. Trading in the stock and option markets is risky and uncertain. Each trader must make trading decisions for his or her own account, and take responsibility for the consequences.
License
All content on Tim Bovee, Private Trader by Timothy K. Bovee is licensed under a Creative Commons Attribution-ShareAlike 4.0 International License.
Based on a work at www.timbovee.com.

You must be logged in to post a comment.