3:30 p.m. New York time
Half an hour before the closing bell. The S&P 500 futures has reached a peak during today’s session of 4275. It reversed from that level, declined, and now has moved again back to the upside. A close view of the day’s trading suggests that internally, the upward movement is still in its third and most likely final leg. In Elliott wave terminology, the upward movement is wave 4{-9}, and within it, I count rising wave C{-10} as being underway. The C wave will most likely have five waves within it, and I count rising wave 3{-11} as now being underway, with declining wave 4{-11} and rising wave 5{-11} to follow.
10:15 a.m. New York time
Exited MRVL earnings play. I’ve exited my short bull put options spread on MRVL at 25% of maximum potential profit and have updated the trade analysis with full results.
9:35 a.m. New York time
What’s happening now? The S&P 500 E-mini futures declined to 4178.35 in overnight trading and then in the early morning hours reversed, rising nearly 95 points, to 4233.50.
What does it mean? By my principal analysis the low, 4178.35, marks the end of the middle leg of the decline that began on March 3 from 4418.75. The upward move is a low-level correction within the larger downtrend and will be followed by a push lower that I expect to reach below the February 24 low, 4101.75.
What’s the alternative? It possible to see the overnight low as being the end of the last leg of the decline from March 3, and the subsequent rise as the beginning of a larger upward correction that will carry the price up toward the March 3 high, 4418.75. I expect the price to remain below that level. I’ll discuss my reasoning for rejecting this scenario in the Elliott wave theory, below.
Also, as a second alternative, the downward leg could still be underway. If the subsequent rise continues with three legs — up, down, up — then this alternative will be disproven.
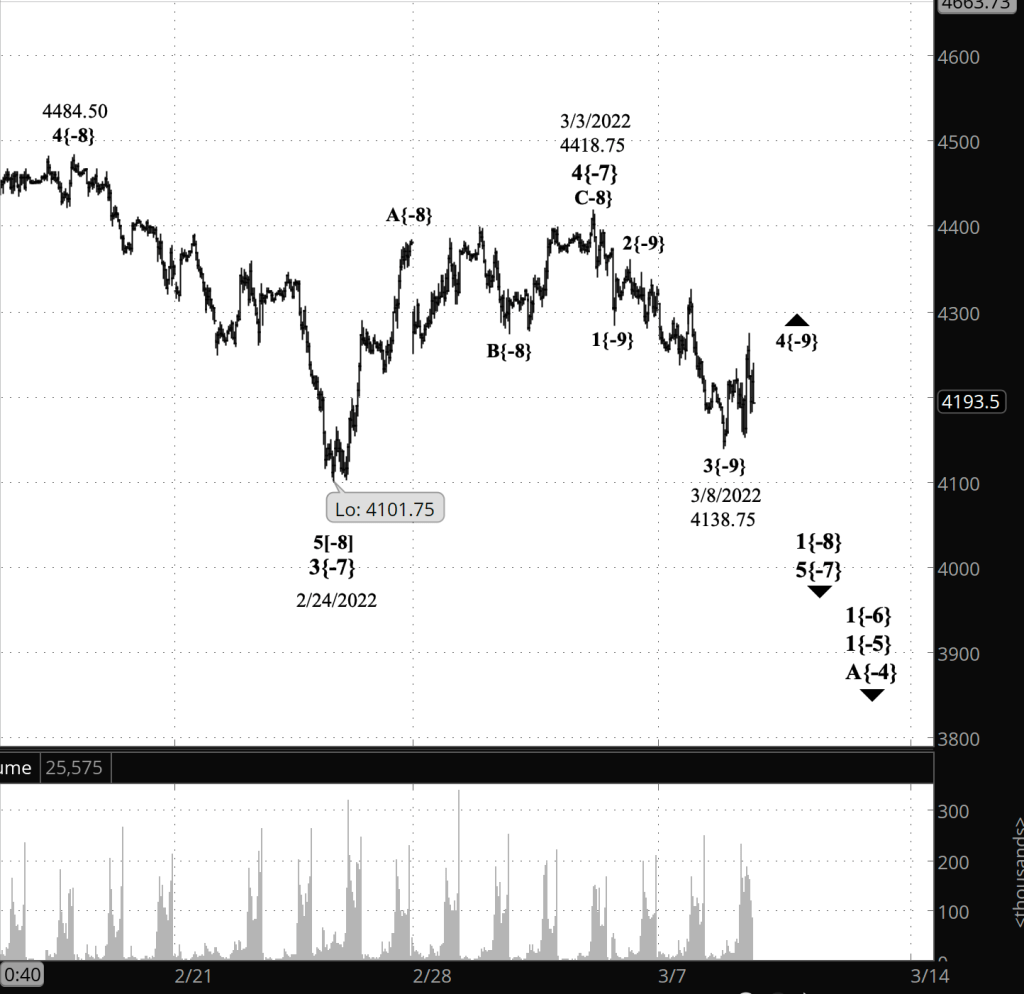
What does Elliott wave theory say? Under my principal analysis, the overnight low, 4138.75, was the end of wave 3{-9} within wave 1{-8}, both downtrending waves. The reversal from the overnight low is the beginning of wave 4{-9}, an upward correction, with three wave internally, within the larger downtrend.
Today’s analysis differs from Monday’s in that I’ve moved the end of wave 3{-9} to today’s low from Monday’s low point, 4181. The extent of the downward move had the feel of an energetic 3rd wave more than a 5th wave. Leaving the end of wave 3{-9} at 4181 produced an awkwardly short 3rd wave compared to the subsequent 5th.
Note that there is nothing in the rules that requires a 5th wave to be shorter than the preceding 3rd wave. The closest rule is that the 3rd wave can’t be shorter than both waves 1 and 5. And 5th waves have a lot of variety. They can be truncated, ending below the end of the preceding 3rd wave. Or they can extend, moving quite a bit further than seems reasonable.
As is often the case in Elliott wave analysis, it’s an aesthetic judgement — what analysis matches the look and feel of what I’ve seen before in my decades of chart analysis. If that look and feel changes, then I’ll readily alter my principal analysis to accommodate it.
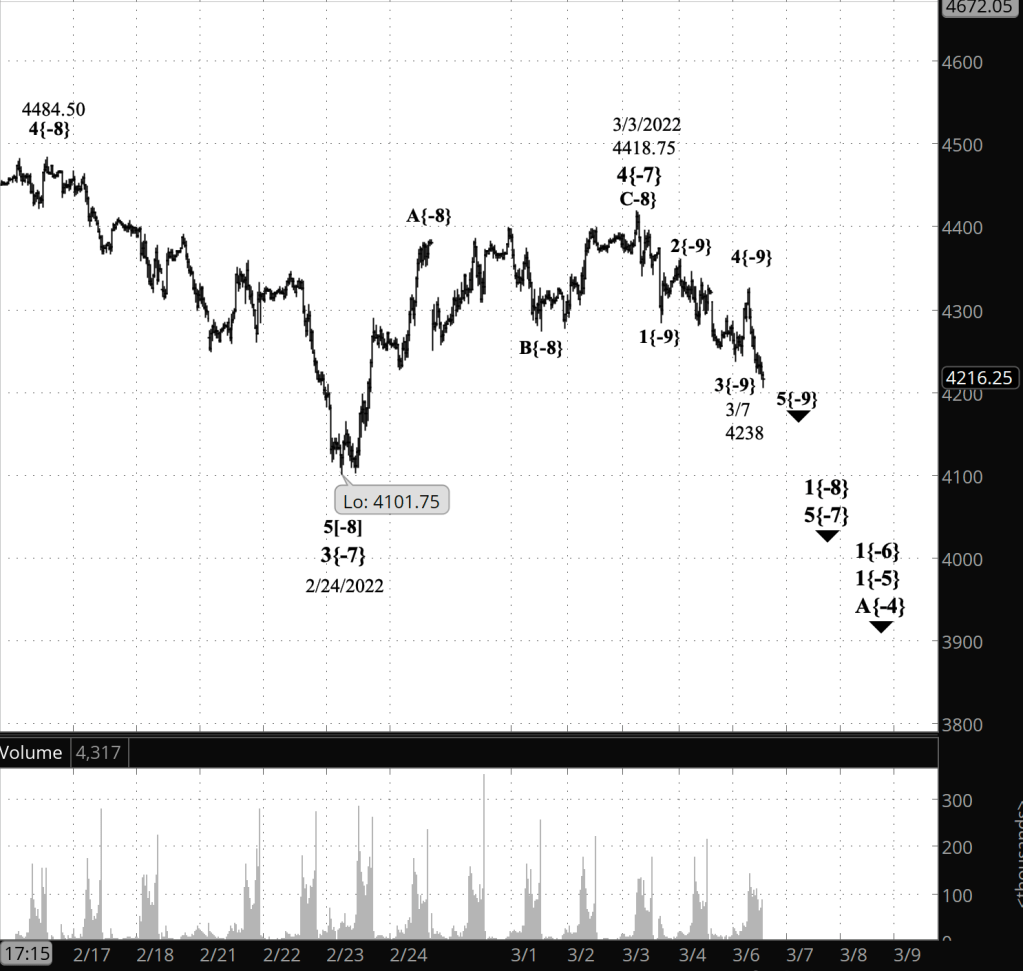
So i rejected the alternative analysis, which labels the overnight low, 4138.75, as the end of wave 5{-9} within wave 1{-8}. the subsequent rise would be labeled wave A{-9} within wave 2{-8}, an upward correction.
A second alternative is that downtrendng wave 3{-9} is still underway. A rapid return to new lows after this morning’s rise will increase the likelihood of this scenario.
We Are Here.
These are the waves currently in progress under my principal analysis. Each line on the list shows the wave number, with the subscript in curly brackets, the traditional degree name, the starting date, the starting price of the S&P 500 E-mini futures, and the direction of the wave.
- 5{0} Intermediate, 12/21/2018, 2316.75 (up)
- 3{1} Minor, 3/23/2018 2174 (up)
- 5{-2} Minute, 10/4/2020, 4267.50 (up)
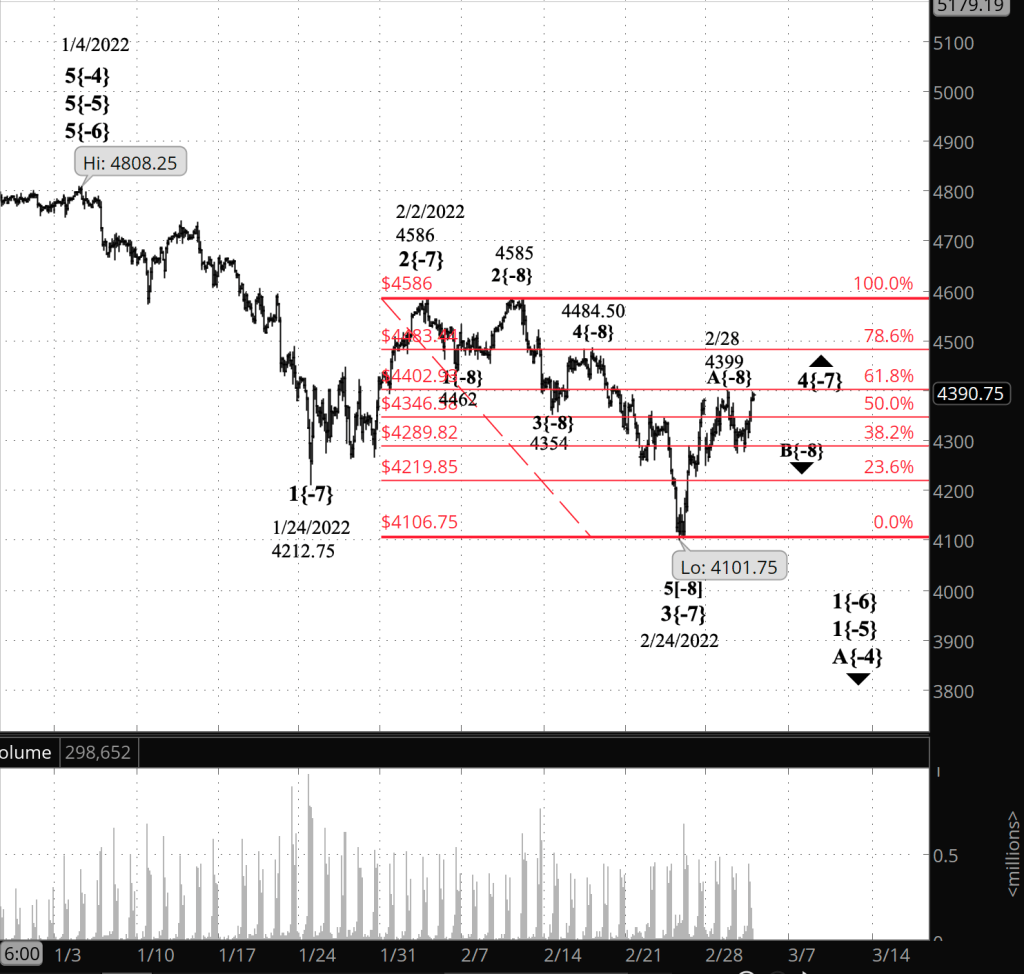
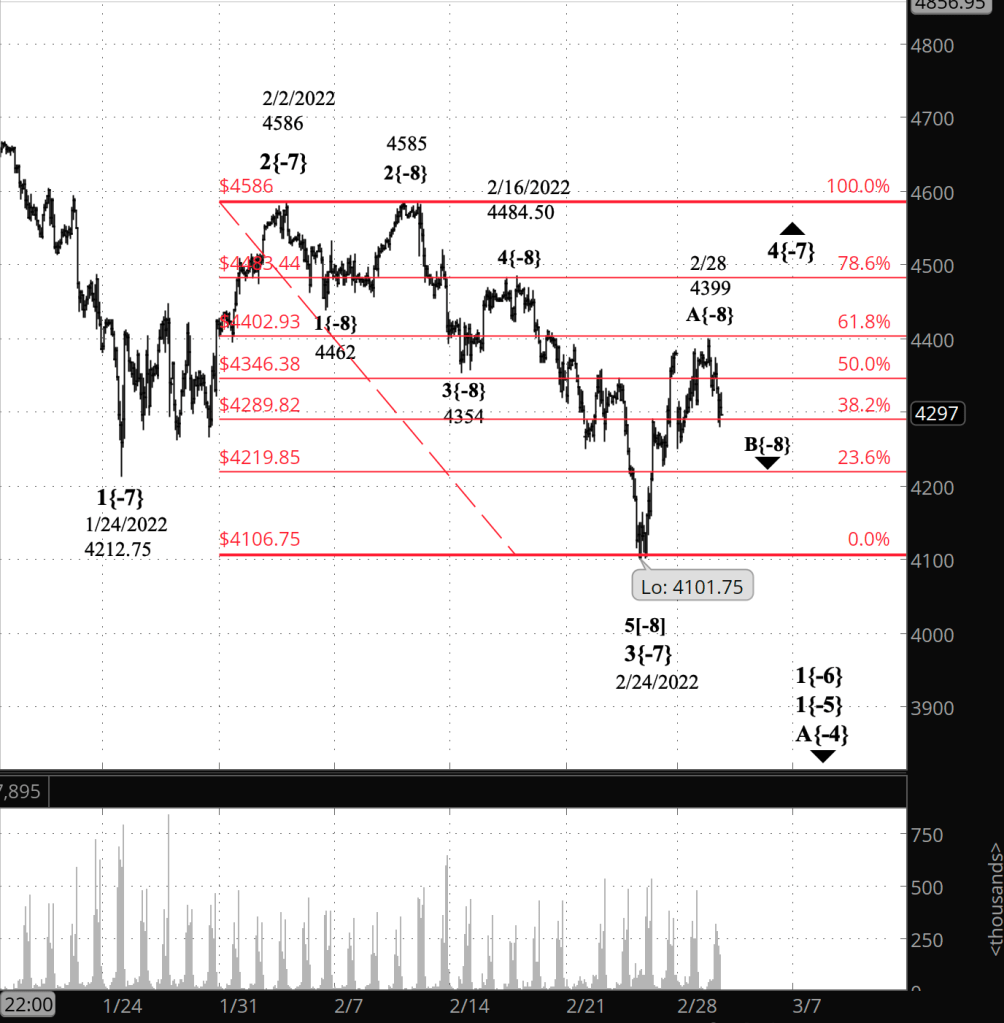
- 4{-3} Minuette, 1/4/2022, 4808.25 (down)
- A{-4} Subminuette, 1/4/2022, 4808.25 (down)
- 1{-5} Micro, 1/4/2022, 4808.25 (down)
- 1{-6} Submicro, 1/4/2022, 4808.25 (down)
- 5{-7} Minuscule, 3/3/2022, 4101.75 (down)
- 1{-8} Subminuscule, 3/3/2022, 4101.75 (down)
- 4{-9} Bitsy, 3/8/2022, 4178.35 (up)
Learning and other resources. Elliott wave analysis provides context, not prophecy. As the 20th century semanticist Alfred Korzybski put it this way in his book Science and Sanity (1933), “The map is not the territory … The only usefulness of a map depends on similarity of structure between the empirical world and the map.” And I would add, in the ever-changing markets, we can judge that similarity of structure only after the fact.
See the menu page Analytical Methods for a rundown on where to go for information on Elliott wave analysis.
By Tim Bovee, Portland, Oregon, March 8, 2022
Disclaimer
Tim Bovee, Private Trader tracks the analysis and trades of a private trader for his own accounts. Nothing in this blog constitutes a recommendation to buy or sell stocks, options or any other financial instrument. The only purpose of this blog is to provide education and entertainment.
No trader is ever 100 percent successful in his or her trades. Trading in the stock and option markets is risky and uncertain. Each trader must make trading decisions for his or her own account, and take responsibility for the consequences.
License
All content on Tim Bovee, Private Trader by Timothy K. Bovee is licensed under a Creative Commons Attribution-ShareAlike 4.0 International License.
Based on a work at www.timbovee.com.

You must be logged in to post a comment.