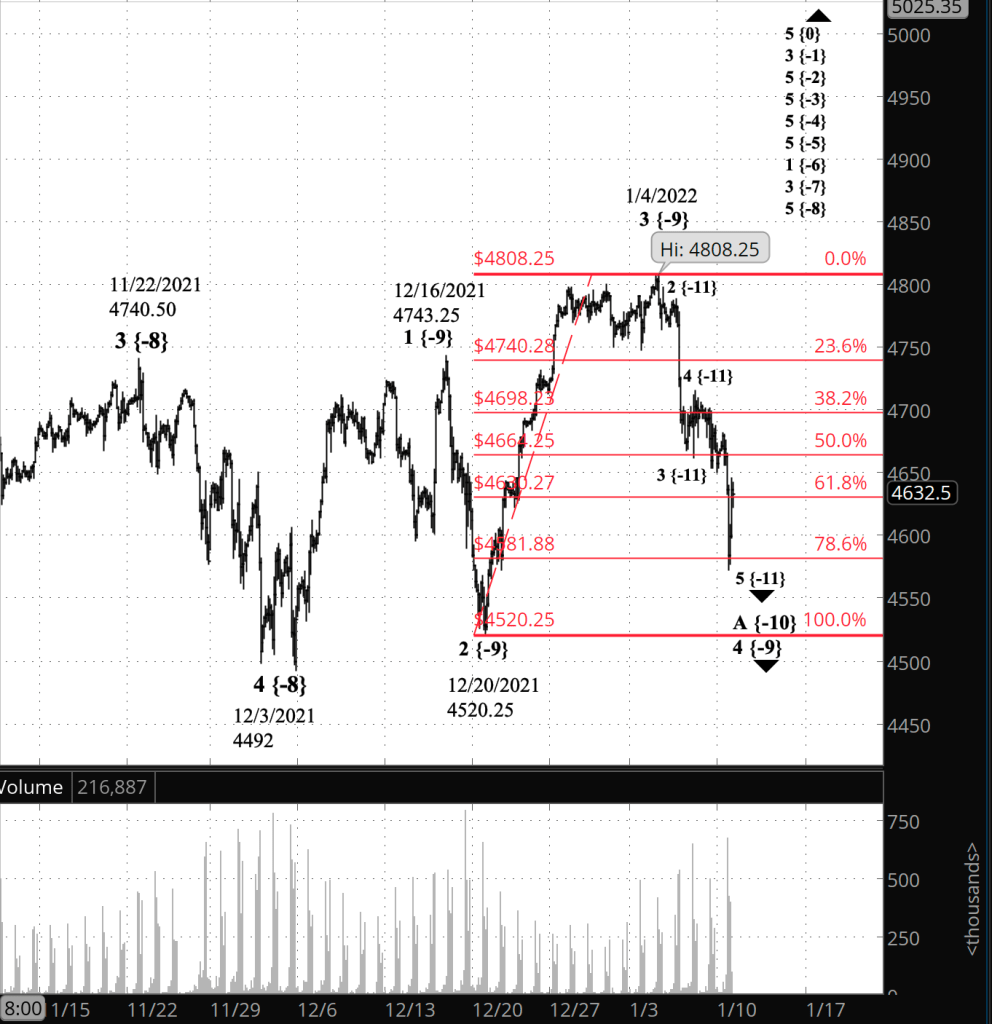
3:30 p.m. New York time
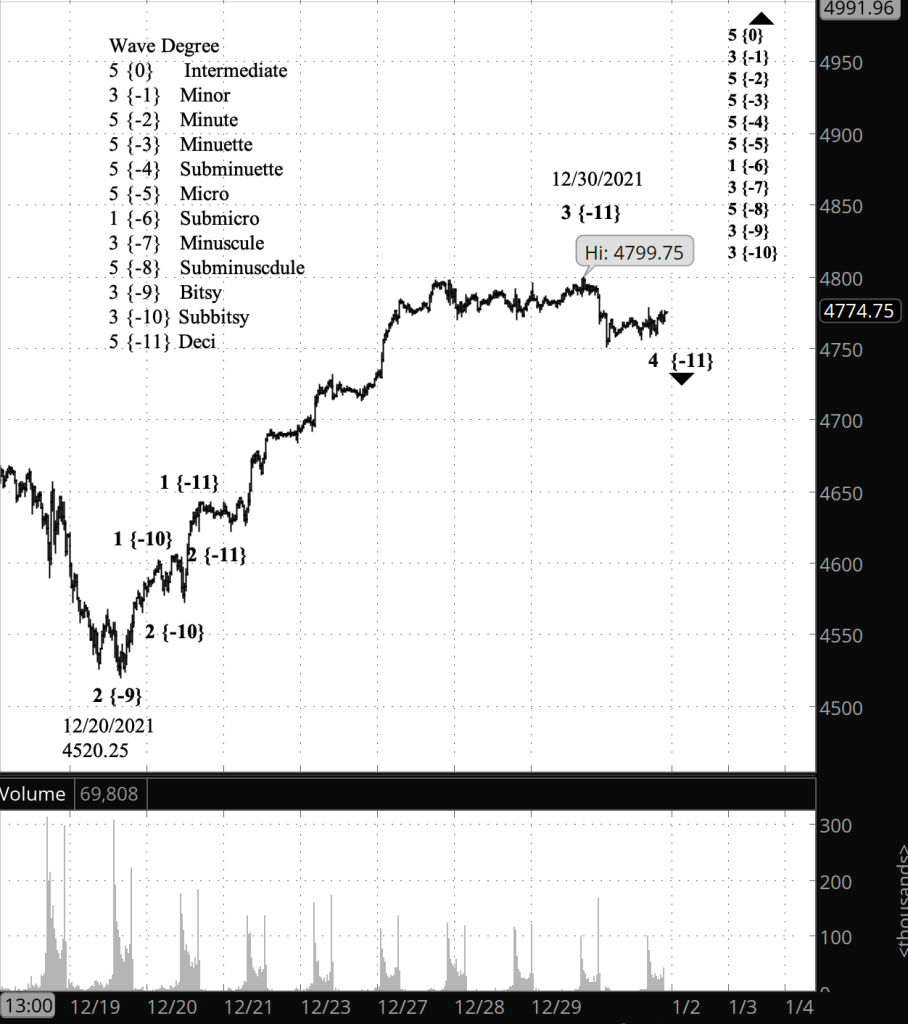
Half an hour before the closing bell. The S&P 500 futures dropped below the 78.6% Fibonacci retracement level and then reversed back to the 61.8% level. The rise back up looks like a 4th wave correction within downtrending wave 5{-11}. No change in the analysis. I’ve updated the chart.
11:30 a.m. New York time
Another trade. I erred in trading ACI as shares. It’s a perfectly good trade, but ACI also works as a potentially more profitable options position. So I’ve doubled down and entered a short iron condor position on ACI and posted an analysis of the trade.
10:45 a.m. New York time
My trades. I exited my short iron condor earnings play on PAYX after 20 days for an 89.2% return, or a 1,630% annual rate. I’ve updated the trade analysis with full results.
I also exited by long shares earnings play on TLRY for a 14.2% return over three days (including the weekend) for a 1,722% annual rate.
I’ve entered a new long shares position on ACI, which publishes earnings on Tuesday before the opening bell. Options pricing suggests a $1.27 move in either direction from the $31.98 entry price. Zacks’ Earnings Surprise Predictor gives a likelihood score of 6.25% and ranks ACI as “Buy”.
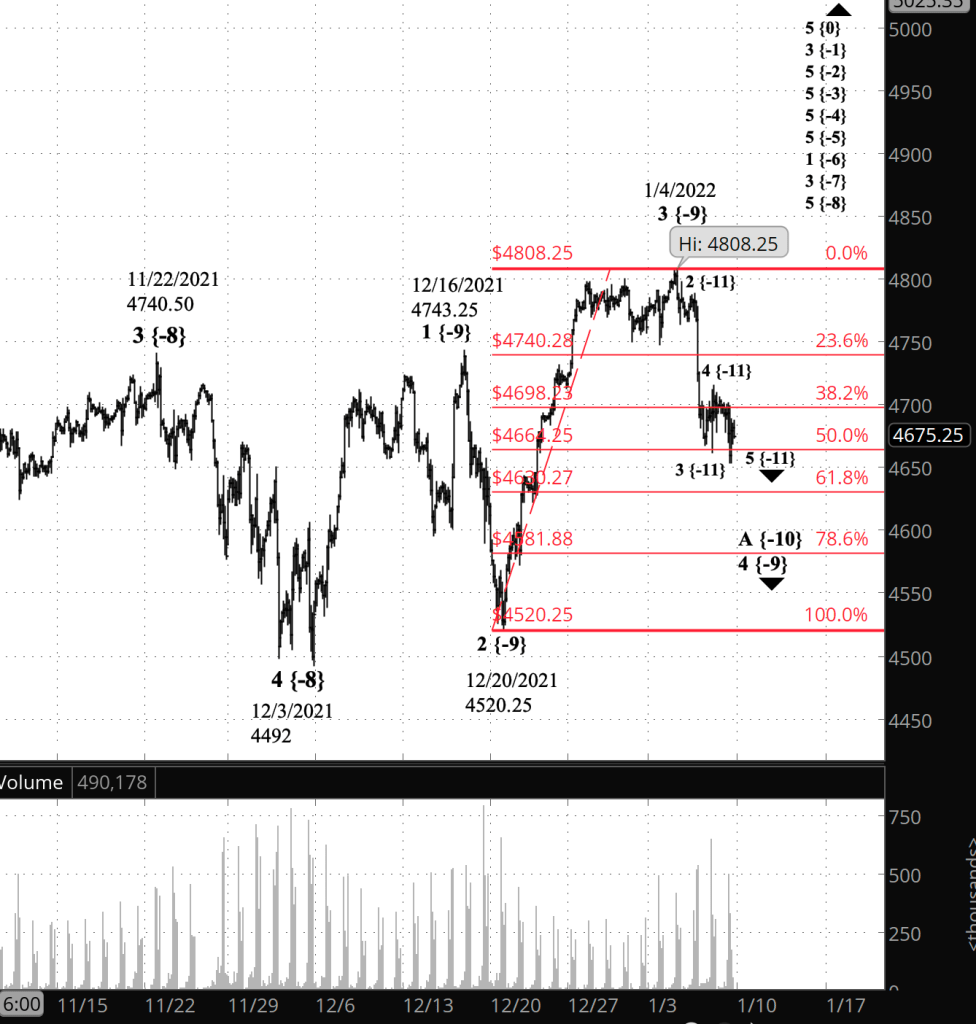
9:35 a.m. New York time
What’s happening now? The S&P 500 E-mini futures declined in overnight trading, coming close to the 61.8% retracement mark, a Fibonacci level.
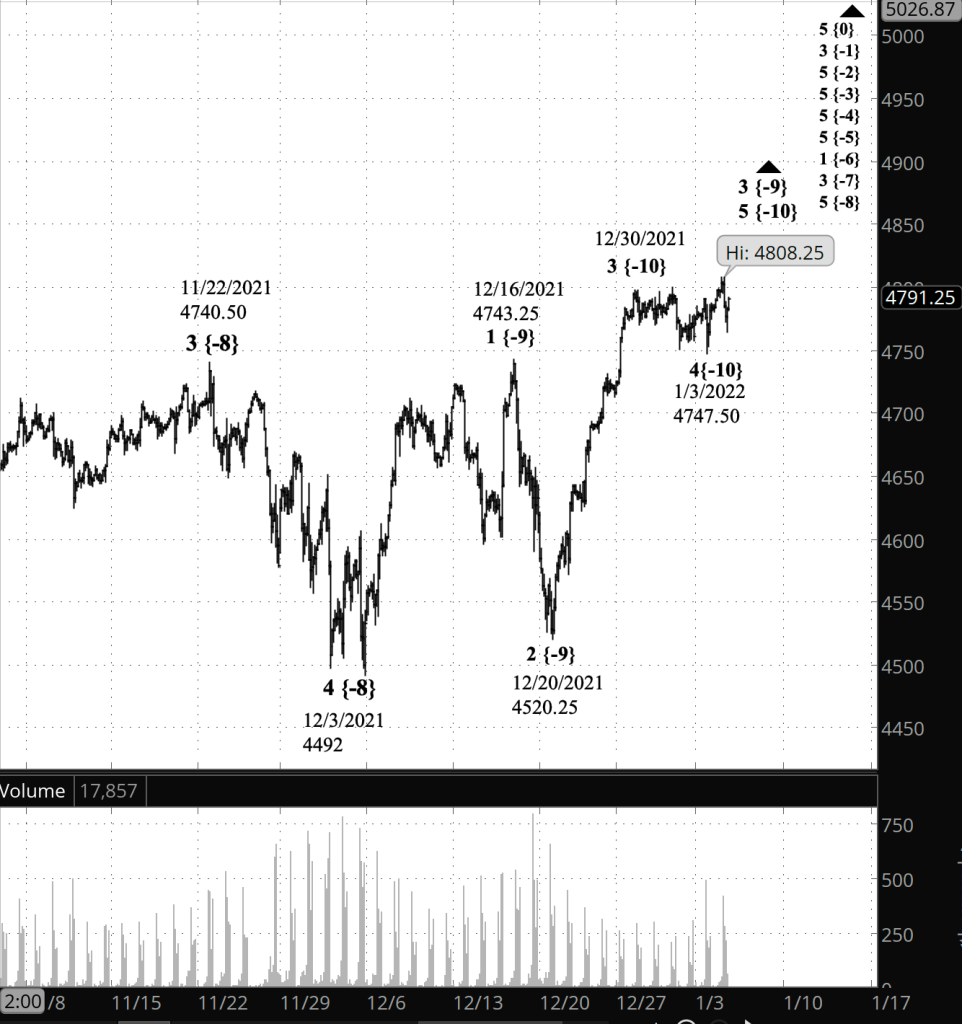
What does it mean? The downward correction that began on January 4 from 4808.25 continues.
What’s the alternative? Or is it instead the first stages of a new downtrend? I sift through the evidence in the Elliott wave theory section below.
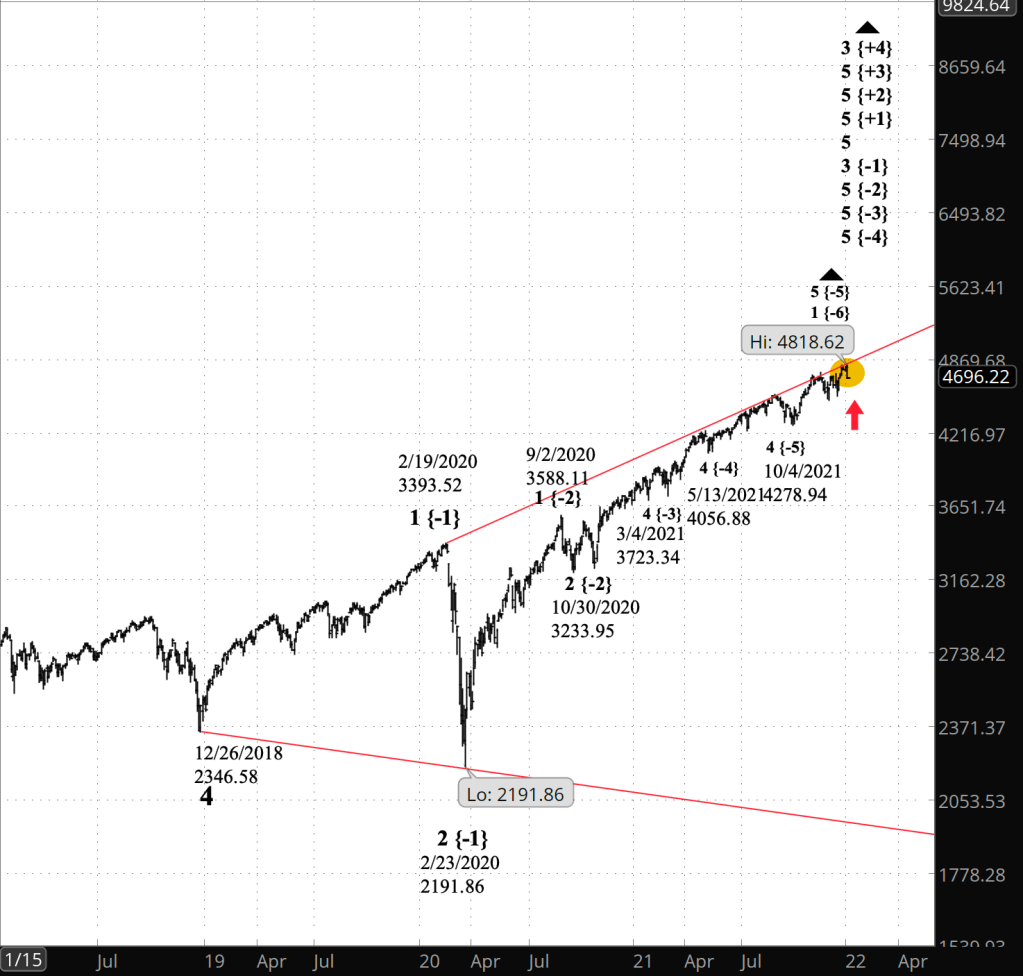
What does Elliott wave theory say? Internal wave counts are important in Elliott wave theory. Trending waves — “impulse waves” in the jargon — are always composed of five waves, and their internal wave counts are 5-3-5-3-5. Corrective waves come in threes, with several varieties of internal counts: Zigzags (5-3-5) and Flats (3-3-5). There are of course those pesky exceptions, such was Extensions and Triangles and compound corrections. Even so, internal wave counts allow us to understand where we are in the pattern and what lies ahead.
So where are the S&P 500 futures and index, and what lies ahead for them?
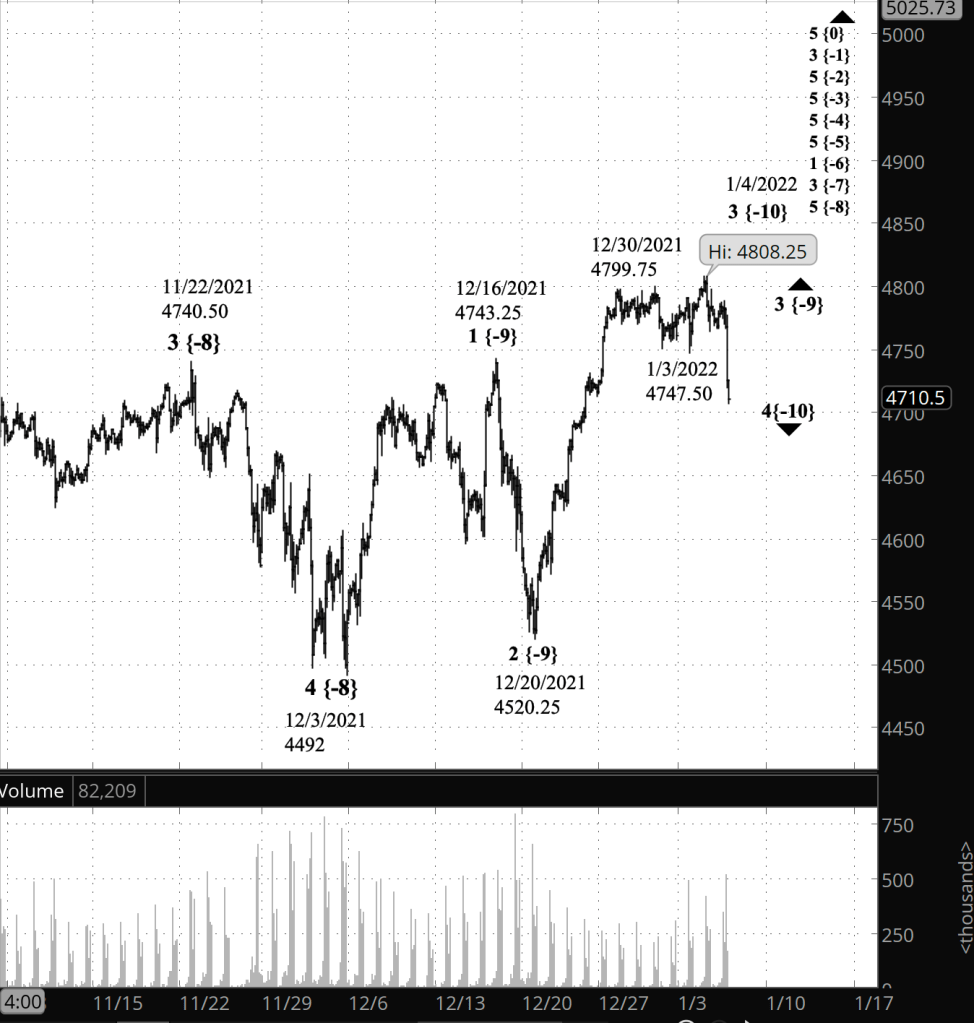
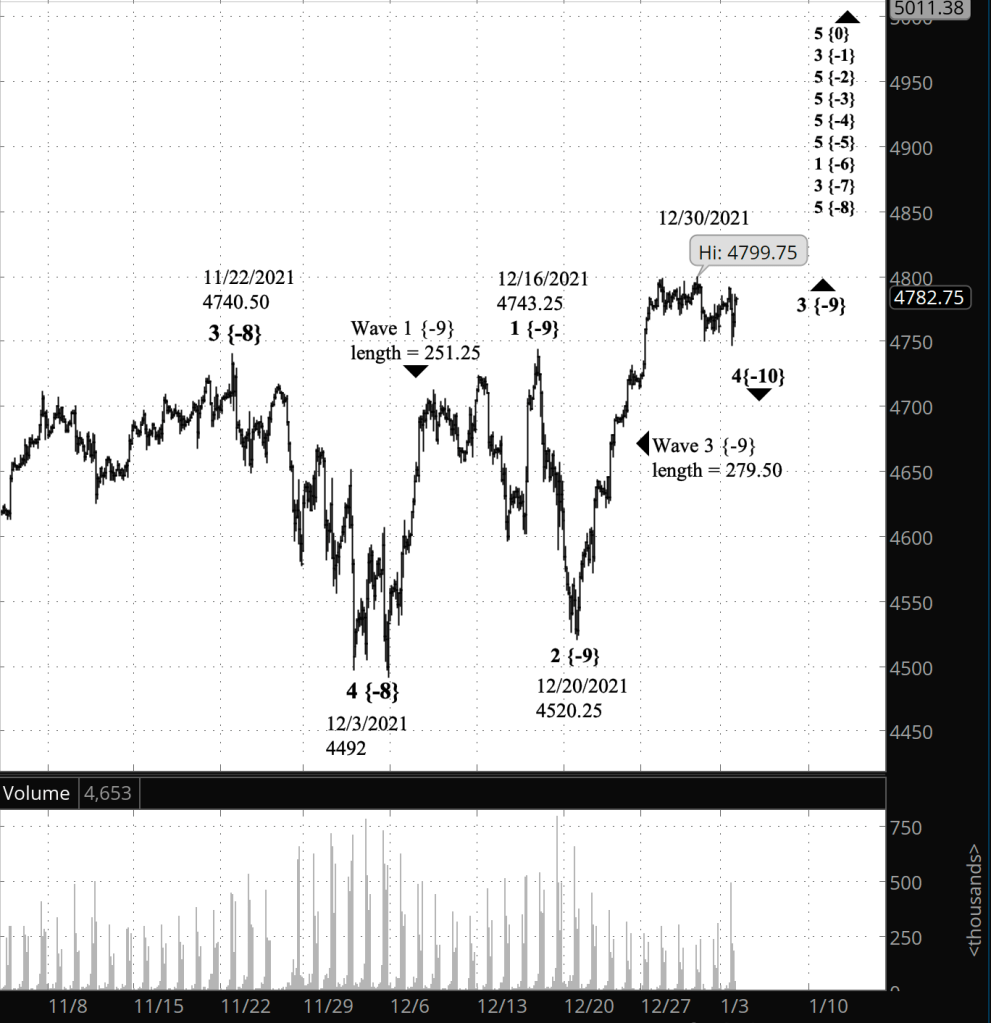
The starting point for where we are now is the January 4 high, which by my count was the end of an impulse wave, 3{-9}, which began on December 20. If my labeling it as a 3rd wave is correct — there are always ambiguities in Elliott, always — then the ensuing 4th wave decline is most likely a Zigzag or a Flat.
Fourth waves tend to be a different pattern than the preceding 2nd wave — “alternation” in the jargon. In this case, wave 2{-9} appears to have been a Zigzag, although it declined so quickly that it’s hard to get a good internal wave count. So in the normal course of things, wave 4{-9} would be a Flat.
But it’s not. It is now in its 5th wave internally, and that would fit a Zigzag (5-3-5) and not a Flat (3-3-5). Alternation is a tendency, not a firm rule, so a Zigzag wouldn’t be unheard of in this position. Nonetheless, it is a bit of a departure from the norm.
It could also be one of the exceptions to the three-wave rule for corrections, and that is a Triangle, which as five waves internally, with four of them being Zigzags. If the internal wave A is part of a Triangle, then it could very well have five wave internally, labelled A-B-C-D-E.
And the other pattern that fits is that a downtrending impulse wave began on January 4. Under this scenario, my 3{-9} count for the January 4 peak is incorrect — that peak isn’t the end of a 3rd wave. It is, instead, the end of a 5th wave: wave 5{-9}. Most waves in charts, I’ve found, have sufficient ambiguity to produce such a difficulty. And indeed, I found the internal count of the parent wave, 5{-8} to be a difficult one.
Time will tell us which count is correct.
If the present 5th wave of the decline from January 4, within wave A{-10} is followed by a three-wave rise, wave B{-10} and then a five-wave decline, wave C{-10}, followed in turn by a rise above the January 4 peak, then we’ll know that it was a Zigzag correction.
If we see five waves at the {-10} degree, with the price remaining below the January 4 peak, then the correction was most likely a Triangle — unless it was an expanding Triangle, in which case the price might well move above the January 4 high.
If the end of the present wave 5{11} within wave A{-10} within wave 4{-9} is followed by full three-wave upward correction that stays below the January 4 peak — most likely a Zigzag (5-3-5) — and if it is then followed by a five-wave impulse wave to below the December 20 low, then the January 4 peak was the end of wave 5{-9}, the present decline was wave 1{-9}, the ensuing upward movement, will be wave 2{-9} and the drop below the December 20 low will be wave 3{-9}, all of this with the declining impulse wave 1{-8}.
I’m tempted to conclude that it’s a complex time on the chart, but honestly, it’s always complex. The stock market patterns discovered by R.N. Elliott are an amazingly complex web of fractal patterns, nested the smaller within the larger like Russian matryoshka dolls. Wheels within wheels. But, I always try to remember, that complexity can be unravelled and its implications understood.
Learning and other resources. Elliott wave analysis provides context, not prophecy. As the 20th century semanticist Alfred Korzybski put it this way in his book Science and Sanity (1933), “The map is not the territory … The only usefulness of a map depends on similarity of structure between the empirical world and the map.” And I would add, in the ever-changing markets, we can judge that similarity of structure only after the fact.
See the menu page Analytical Methods for a rundown on where to go for information on Elliott wave analysis.
By Tim Bovee, Portland, Oregon, January 10, 2022
Disclaimer
Tim Bovee, Private Trader tracks the analysis and trades of a private trader for his own accounts. Nothing in this blog constitutes a recommendation to buy or sell stocks, options or any other financial instrument. The only purpose of this blog is to provide education and entertainment.
No trader is ever 100 percent successful in his or her trades. Trading in the stock and option markets is risky and uncertain. Each trader must make trading decisions for his or her own account, and take responsibility for the consequences.
License
All content on Tim Bovee, Private Trader by Timothy K. Bovee is licensed under a Creative Commons Attribution-ShareAlike 4.0 International License.
Based on a work at www.timbovee.com.


You must be logged in to post a comment.