SP500 Analysis

3:30 p.m. New York time

Half an hour before the closing bell. The S&P 500 continued to trade slightly below Friday’s high of 4590 as the session neared its end, staying within 35 points of that peak until late in the session, when the price dropped to 4550.50. No change in the analysis. I’ve updated the chart.

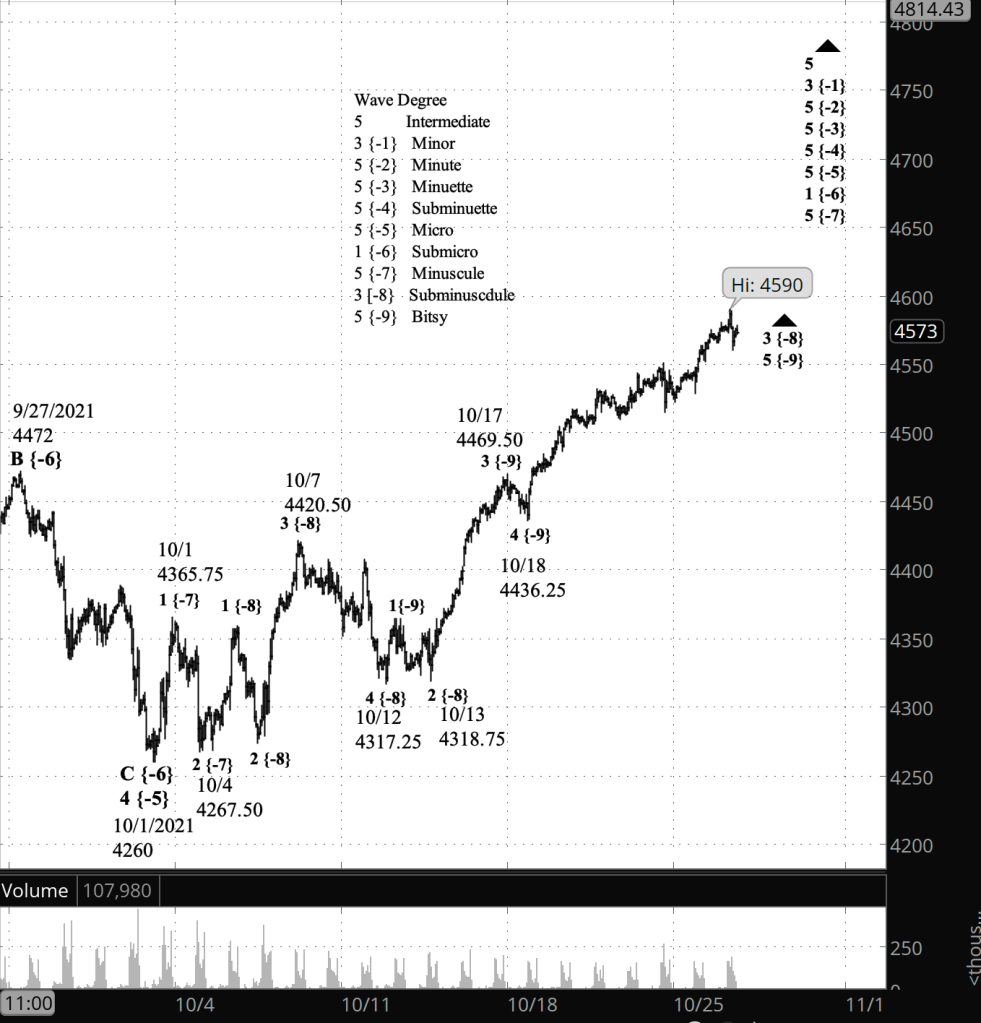
9:50 a.m. New York time

What’s happening now? The S&P 500 E-mini futures remained slightly below yesterday’s peak, 4590,

What does it mean? Two possibilities, of equal likelihood: Either the decline from the peak is a low-level correction that will be quickly followed by a rise to new highs (which is how I’ve labelled the chart).

Or the decline marks the end of larger rise that began October 13 and the beginning of a shallow correction which in turn will be followed by a rise to new highs.

What is the alternative? A bearish alternative would be to redo the analysis entirely, making yesterday’s high the end of the rise that began February 23, 2020. Based on the internal count, I consider this to be of extremely low probability.

[S&P 500 E-mini futures at 3:30 p.m., 70-minute bars, with volume]

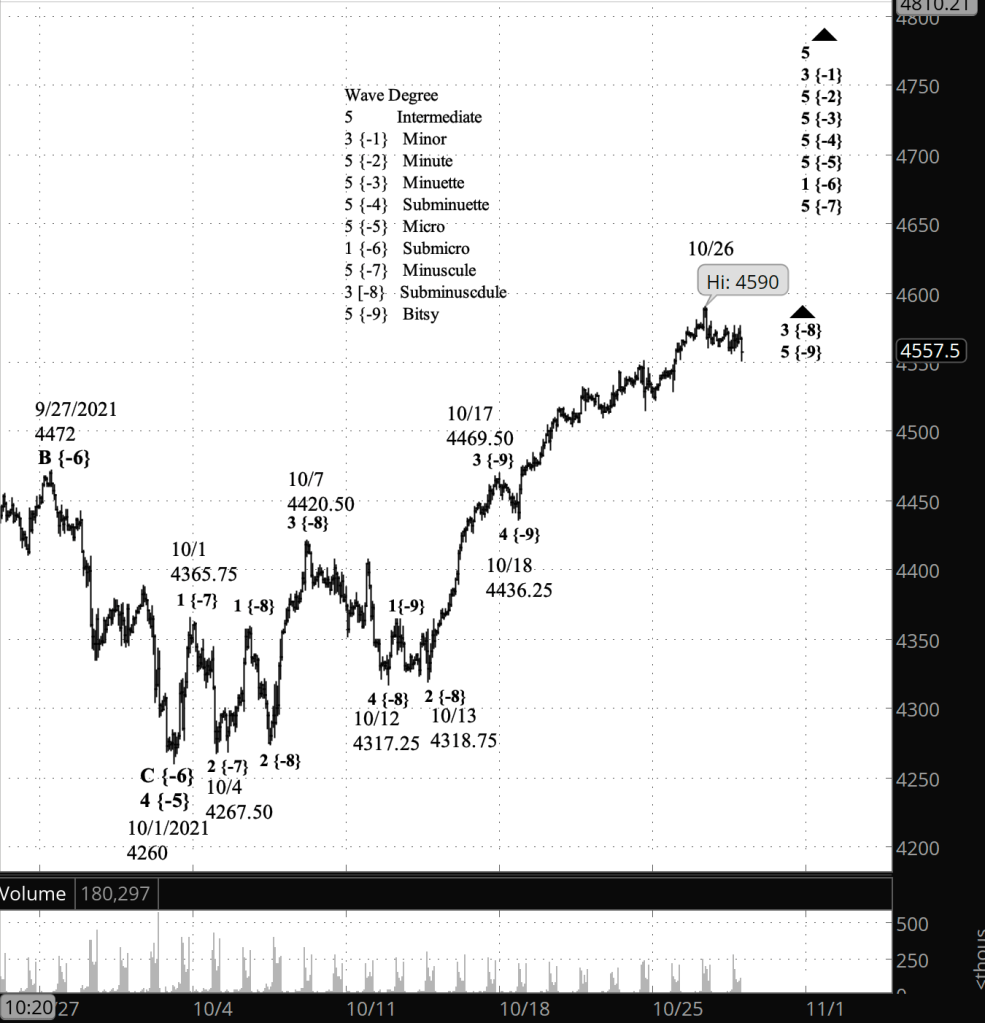
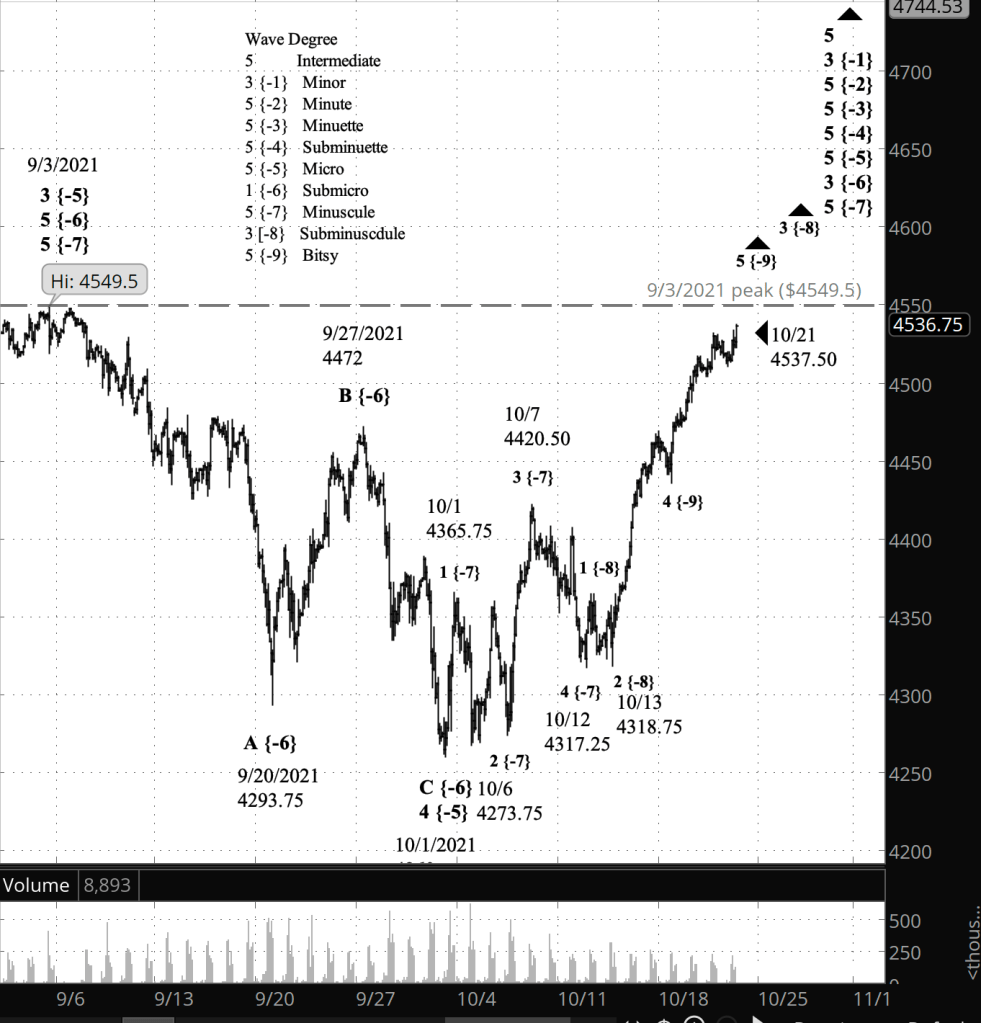
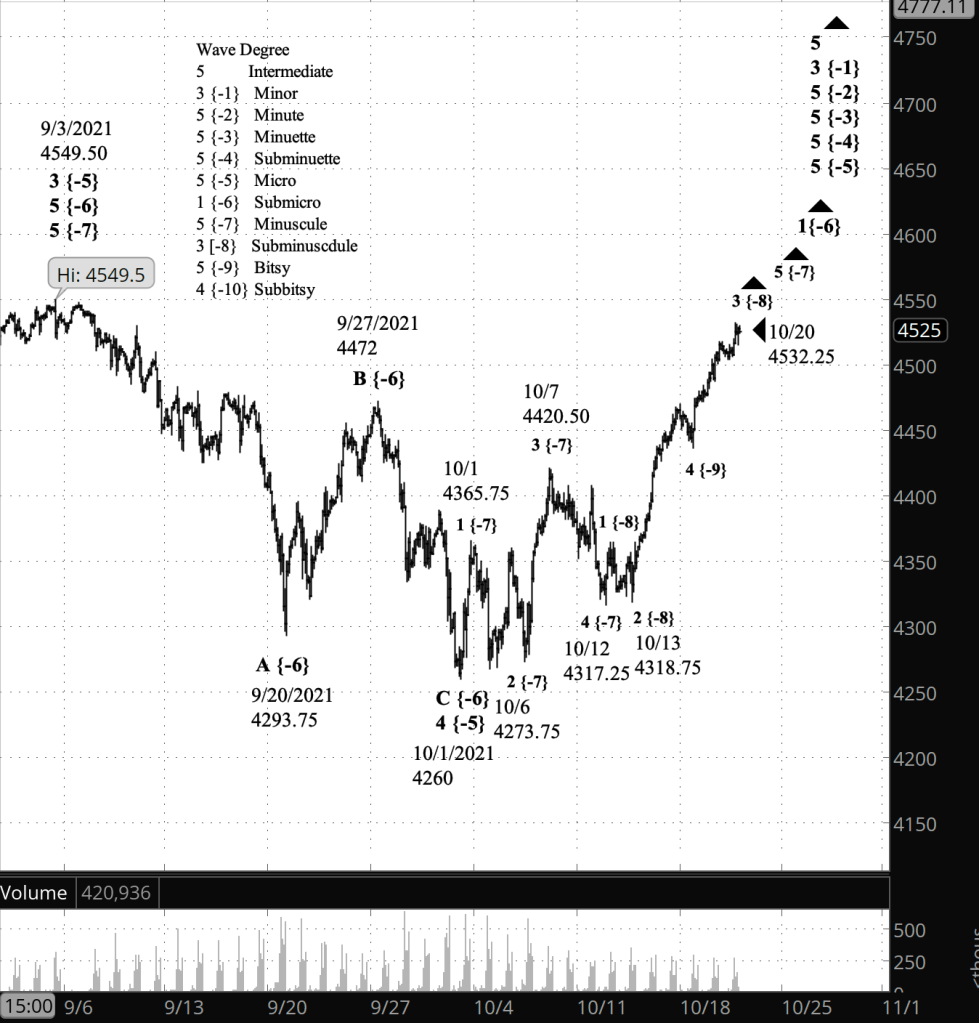
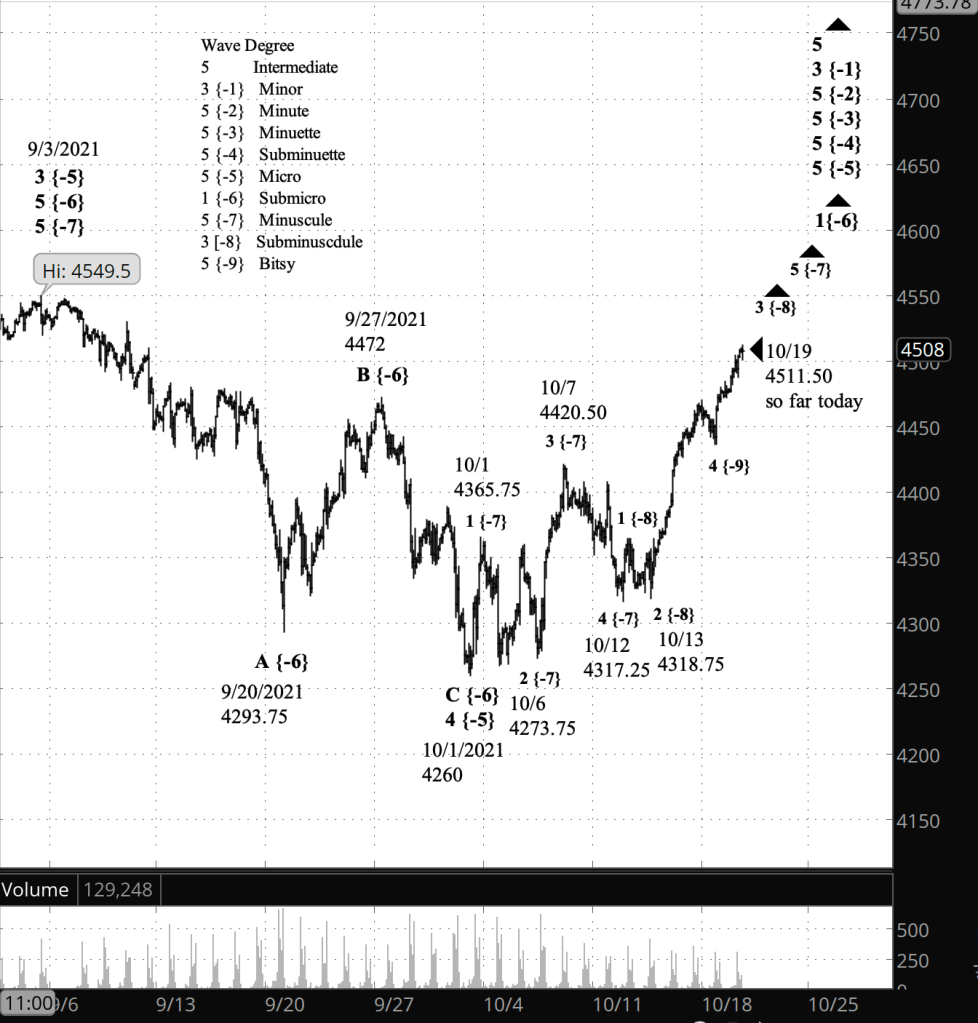
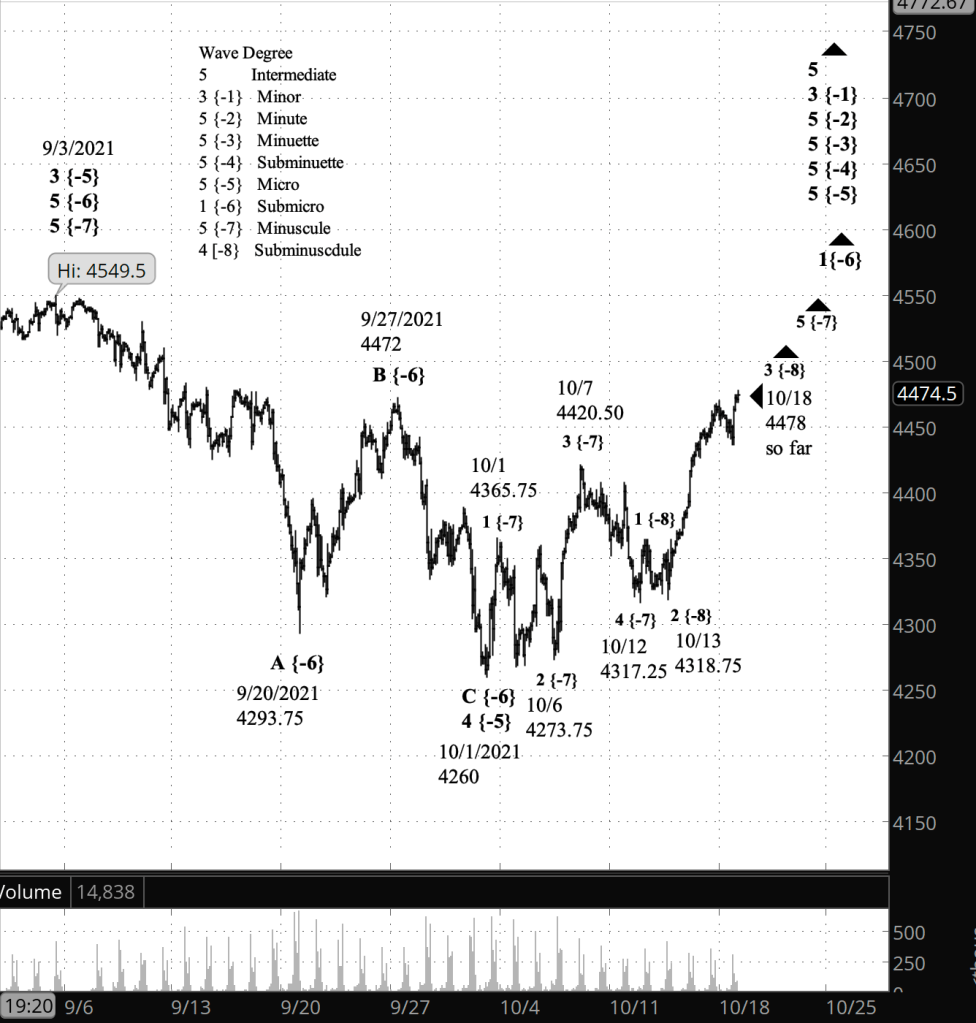
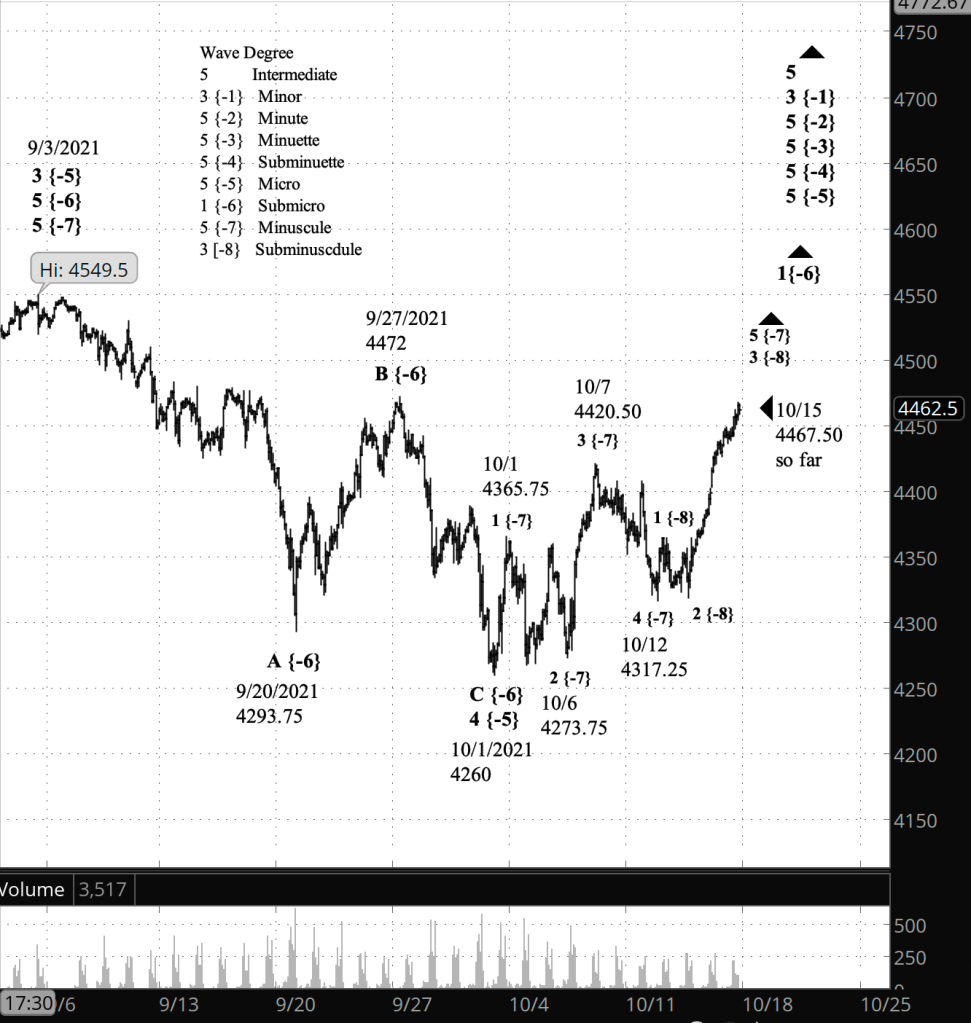
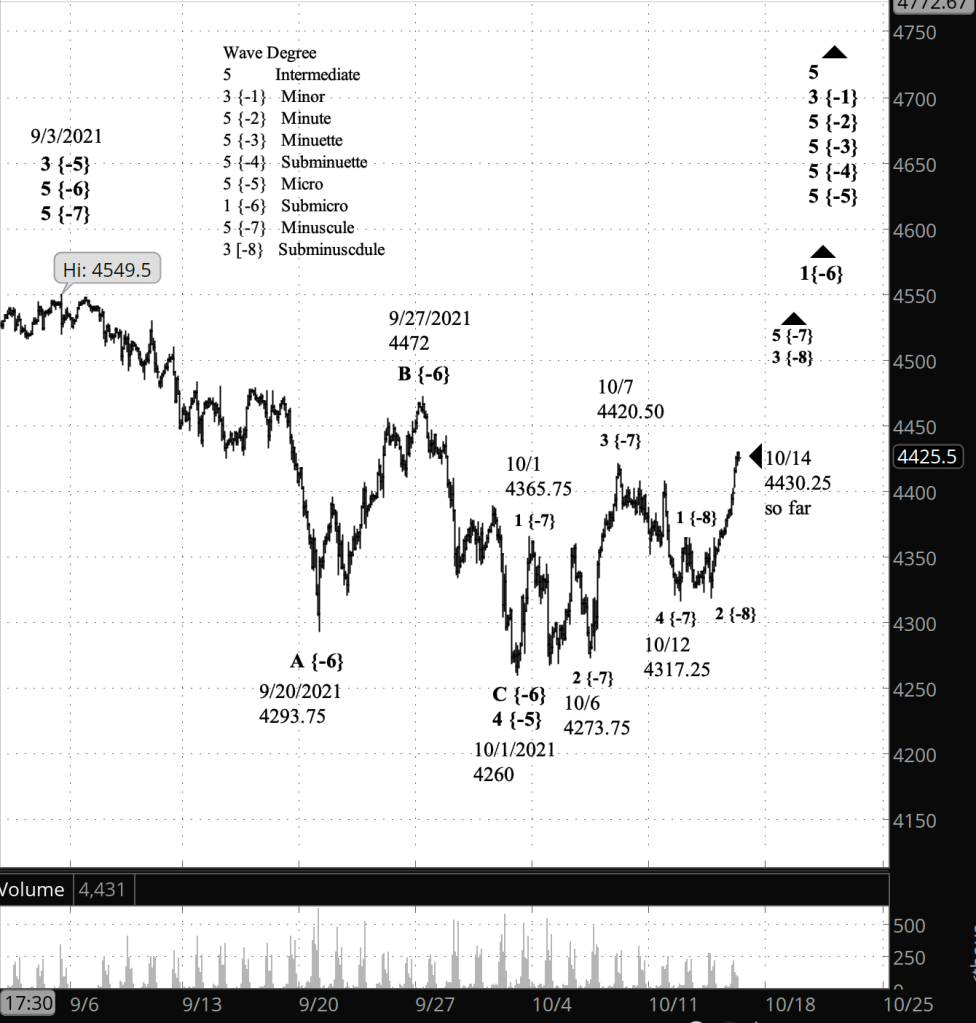
What does Elliott wave theory say? The rise from October 13 is wave 3 of Subminuscule degree. Internally, it is in wave 5 of Bitsy degree, which has turned to be a hard-to-count wave, which lots of ambiguity. I think it has met all of the Elliott requirements for completion, but it can continue extending for quite some time.

Of equal likelihood is a scenario where yesterday’s high ended wave 3 of Subminuscule degree, and the subsequent slight decline is an early stage within wave 4 of Subminuscule degree. The 4th wave could trace one of three patterns: Zigzag, Flat or Triangle. I’m betting on Flat, which is a shallow correction.

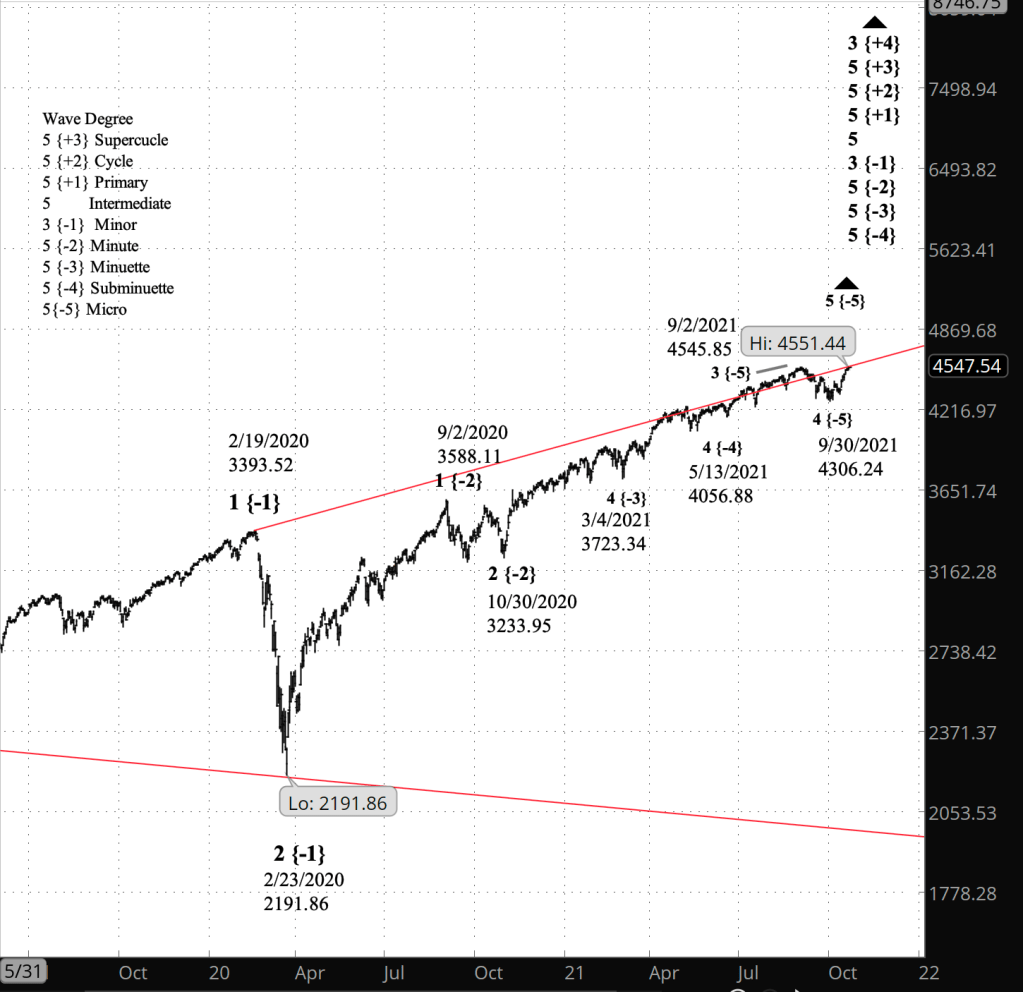
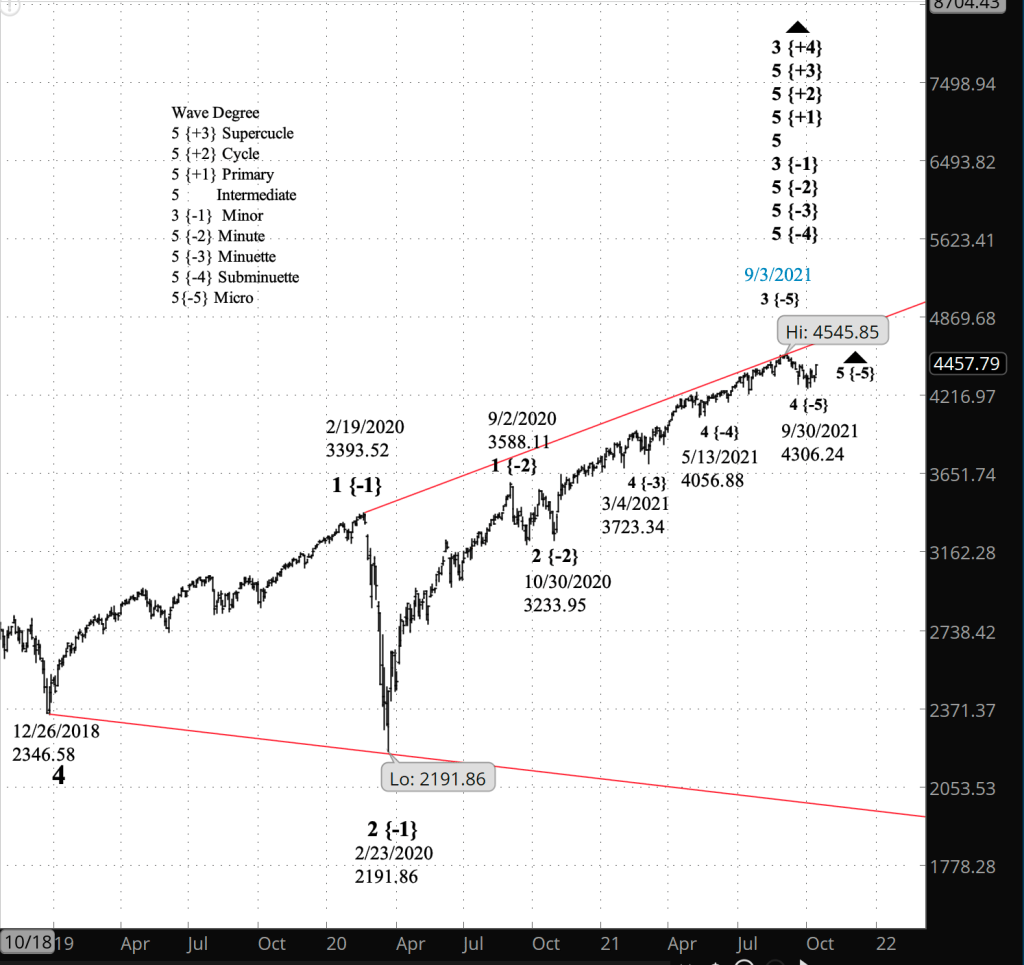
The alternative scenario sees yesterday’s high as the end of wave 2 and the beginning of wave 3 of Minor degree, at the end of the early pandemic crash, on February 23, 2000. Minor degree is seven degrees larger than Subminuscule degree and is the largest internal degree of wave 5 of Intermediate degree, an expanding Diagonal Triangle, wave 5 of Intermediate degree, that began in December 2018. The internal count suggests that the price is in wave 1 of Submicro degree, four levels below Intermediate, and that Minor wave 3 won’t be complete until the end of wave 5 of Submicro degree.

So how much high does the S&P 500 really have? As shown in the longer-term chart that I posted on Friday, the price since April has been bouncing along the upper boundary of the Diagonal Triangle that began nearly three years ago. The price can go above that boundary, but usually not by a lot. So I expect the price to continue its work at the boundary, with maybe a final push above to complete wave 5 of Intermediate degree.

Learning and other resources. Elliott wave analysis provides context, not prophecy. As the 20th century semanticist Alfred Korzybski put it in his book Science and Sanity (1933), “The map is not the territory … The only usefulness of a map depends on similarity of structure between the empirical world and the map.” And I would add, we can judge that similarity of structure only after the fact.

See the menu page Analytical Methods for a rundown on where to go for information on Elliott wave analysis.

By Tim Bovee, Portland, Oregon, October 27, 2021

Disclaimer

Tim Bovee, Private Trader tracks the analysis and trades of a private trader for his own accounts. Nothing in this blog constitutes a recommendation to buy or sell stocks, options or any other financial instrument. The only purpose of this blog is to provide education and entertainment.

No trader is ever 100 percent successful in his or her trades. Trading in the stock and option markets is risky and uncertain. Each trader must make trading decisions for his or her own account, and take responsibility for the consequences.

License
Creative Commons License

All content on Tim Bovee, Private Trader by Timothy K. Bovee is licensed under a Creative Commons Attribution-ShareAlike 4.0 International License.

Based on a work at www.timbovee.com.

SP500 Analysis

3:30 p.m. New York time

Half an hour before the closing bell. The S&P 500 pulled back slightly from the overnight peak of 4580.75 on the futures, 4598.53 on the index when the session opened. No change in the analysis. I’ve updated the chart.

9:35 a.m. New York time

What’s happening now? The S&P 500 E-mini futures continued to rise overnight, reaching a peak so far of 4580.75.

What does it mean? The rise that began October 18 is still underway, marking the final leg of the uptrend that began on October 12 within the middle leg of the uptrend that began on October 4.

What’s the alternative? Any peak can mark the uptrend’s completion and the beginning of a downward movement. We’ll never know until the decline has become sufficiently large.

[S&P 500 E-mini futures at 3:30 p.m., hourly bars, with volume]

What does Elliott wave theory say? The rise from October 18 is wave 5 of Bitsy degree within wave 3 of Subminuscule degree. Under the Elliott rules, there is no limit on how high an impulse wave can go, except for the need to preserve a balance in distance covered and time taken that is appropriate for the degree. Waves at the Subminuscule level tend to be over in days — weeks at most.

Learning and other resources. Elliott wave analysis provides context, not prophecy. As the 20th century semanticist Alfred Korzybski put it in his book Science and Sanity (1933), “The map is not the territory … The only usefulness of a map depends on similarity of structure between the empirical world and the map.” And I would add, we can judge that similarity of structure only after the fact.

See the menu page Analytical Methods for a rundown on where to go for information on Elliott wave analysis.

By Tim Bovee, Portland, Oregon, October 26, 2021

Disclaimer

Tim Bovee, Private Trader tracks the analysis and trades of a private trader for his own accounts. Nothing in this blog constitutes a recommendation to buy or sell stocks, options or any other financial instrument. The only purpose of this blog is to provide education and entertainment.

No trader is ever 100 percent successful in his or her trades. Trading in the stock and option markets is risky and uncertain. Each trader must make trading decisions for his or her own account, and take responsibility for the consequences.

License
Creative Commons License

All content on Tim Bovee, Private Trader by Timothy K. Bovee is licensed under a Creative Commons Attribution-ShareAlike 4.0 International License.

Based on a work at www.timbovee.com.

SP500 Analysis

3:30 p.m. New York time

Half an hour before the closing bell. The futures peak attained earlier in the session remains in place, 4564. The index is a bit higher, at 4572.62. Wave 3 of Subminuscule degree continues its rise.

1:40 p.m. New York time

A new peak. The S&P 500 exceeded Friday’s high, setting a peak so far of 4564 on the futures, 4571.98 on the index. This means that the alternative analysis is correct. Wave 3 of Subminuscule degree, which began on October 13, is still underway. I’ve updated the chart.

10:05 a.m. New York time

What’s happening now? The S&P 500 E-mini futures rose in overnight trading to 4548, slightly below Friday’s peak, 4551.50, and then five minutes before the opening bell fell sharply, to 4528.75.

What does it mean? The shallow correction that began with Friday’s peak continues.

What’s the alternative? If the price pushes above above 4551.50, then the correction is over and the uptrend that began October 12 has resumed.

[S&P 500 E-mini futures at 3:30 p.m., 115-minute bars, with volume]

What does Elliott wave theory say? The correction is a 4th wave, and given the small magnitude of the correction so far, I think the movement we’re seeing are subwaves smaller than Bitsy degree, the largest degree within the correction, wave 4 of Subminuscule degree. As I’ve noted before, establishing which degree is being tracked early in the game is a guess at best. The proper degree will become apparent as the market movement continues.

Here’s what Elliott has to say about 4th waves: They alternate in form with 2nd waves; in this case the 2nd wave was a Zigzag, and so this correction is most likely a Flat, or perhaps a Triangle or a combination of forms. A 4th wave is never moves beyond the end of the 1st wave, which was 4365 in this case. A 4th wave generally ends within the 4th subwave of the 3rd wave of the same degree.

In this case, that’s wave 4 of Bitsy degree within wave 3 of Subminuscule degree, which I’ve marked on the chart with a circle. Bitsy wave 4 within the 3rd wave ranges from 4469.50 down to 4436.25, suggesting that the present correction, wave 4 of Subminuscule degree, has 100 points of downside potential, more or less,

Learning and other resources. Elliott wave analysis provides context, not prophecy. As the 20th century semanticist Alfred Korzybski put it in his book Science and Sanity (1933), “The map is not the territory … The only usefulness of a map depends on similarity of structure between the empirical world and the map.” And I would add, we can judge that similarity of structure only after the fact.

See the menu page Analytical Methods for a rundown on where to go for information on Elliott wave analysis.

By Tim Bovee, Portland, Oregon, October 25, 2021

Disclaimer

Tim Bovee, Private Trader tracks the analysis and trades of a private trader for his own accounts. Nothing in this blog constitutes a recommendation to buy or sell stocks, options or any other financial instrument. The only purpose of this blog is to provide education and entertainment.

No trader is ever 100 percent successful in his or her trades. Trading in the stock and option markets is risky and uncertain. Each trader must make trading decisions for his or her own account, and take responsibility for the consequences.

License
Creative Commons License

All content on Tim Bovee, Private Trader by Timothy K. Bovee is licensed under a Creative Commons Attribution-ShareAlike 4.0 International License.

Based on a work at www.timbovee.com.

SP500 Analysis

3:30 p.m. New York time

Half an hour before the closing bell. The S&P 500 peaked at 4551.50 on the futures, 4559.67 on the index, and then immediately withdrew by 36 points on the futures, bouncing up again in a clear corrective pattern of very small degree. The price so far remains below the peak. I’ve marked the upper, near-term chart based on a scenario that peak marked the end of wave 5 of Subminuscule degree. That scenario makes the 3rd the shortest wave, followed by the 5th and then the 1st. This meets the strict Elliott wave analysis rule that the 3rd wave cannot be the shortest wave in the direction of the trend. If events prove 4551.50 to not be the end of Subminuscule 5, then I’ll reanalyze the chart. Upper chart updated.

10:45 a.m. New York time

New all-time high. The S&P 500 E-mini futures moved to an all-time high of 4551.50 so far, exceeding the September 3 peak of 4549.50. This follows the index, which set a new peak yesterday.

9:35 a.m. New York time

What’s happening now? The S&P 500 E-mini futures continued to rise during the night, reaching 4548, which is 1.50 below the September 3 high. The S&P 500 index exceeded the early September high in yesterday’s trading.

What does it mean? The rise that began on October 13 continues and is in its last leg. When the rise is complete, it will be followed by a shallow correction and then a rise to new heights.

What’s the alternative? The chart is unambiguous at this point and I have no alternative analysis. Ambiguities can develop at any time.

Two charts. The upper chart is a shorter-term chart, showing movement beginning with the September 3 high. The lower chart is a longer-term chart tracing the early pandemic crash and the rise that followed.

[S&P 500 E-mini futures at 3:30 p.m., 115-minute bars, with volume]
[S&P 500 index at 9:33 a.m., daily bars]

What does Elliott wave theory say? Shorter-term chart: The rise that began October 13 is wave 3 of Subminuscule degree, and internally, it is in its 5th and final wave, of Bitsy degree. Subminuscule 3 is the middle wave within wave 5 of Minuscule degree, which is the final wave within wave 1 of Submicro degree, which began on October 1 from 4260. Submicro 1 will be followed by a sharp downward correction, retracing much of the rise from October 1, and then by a 3rd wave reaching new heights, a shallow 4th wave correction, and a 5th wave, likely going still higher, that will complete the parent wave 4 of Micro degree, which began May 13.

Micro degree is the smallest movement I’ve labelled on the long-term chart. It is the final wave within, in ascending order, 5th waves of Subminuette, Minuette and Minute degrees, and when Minute 5 is complete, it will also mark the end of wave 3 of Minor degree, which began on February 23 from 2191.86, the end of the early pandemic crash.

Longer-term chart: All of that is happening within Intermediate wave 5, which began in December 2018 and is taking the form of an expanding Diagonal Triangle, meaning the price reversal boundaries are moving further apart from each other day by day.

Minor wave 3 will be followed by Minor wave 4, which will carry the price to the lower boundary of the Diagonal Triangle, which is in the 2050s at this point but will be far lower by the time the price reaches it. After Minor wave 4, the price as Minor wave 5 will again return to the upper boundary completing the parent, wave 5 of Intermediate degree, which will be followed by a downward correction of epic proportions.

Learning and other resources. Elliott wave analysis provides context, not prophecy. As the 20th century semanticist Alfred Korzybski put it in his book Science and Sanity (1933), “The map is not the territory … The only usefulness of a map depends on similarity of structure between the empirical world and the map.” And I would add, we can judge that similarity of structure only after the fact.

See the menu page Analytical Methods for a rundown on where to go for information on Elliott wave analysis.

By Tim Bovee, Portland, Oregon, October 22, 2021

Disclaimer

Tim Bovee, Private Trader tracks the analysis and trades of a private trader for his own accounts. Nothing in this blog constitutes a recommendation to buy or sell stocks, options or any other financial instrument. The only purpose of this blog is to provide education and entertainment.

No trader is ever 100 percent successful in his or her trades. Trading in the stock and option markets is risky and uncertain. Each trader must make trading decisions for his or her own account, and take responsibility for the consequences.

License
Creative Commons License

All content on Tim Bovee, Private Trader by Timothy K. Bovee is licensed under a Creative Commons Attribution-ShareAlike 4.0 International License.

Based on a work at www.timbovee.com.

SP500 Analysis

4 p.m. New York time

At the closing bell. Three minutes before the closing bell the S&P 500 index rose above the September 3 high of 4545.85, reaching a new peak of 4551.44. The S&P 500 futures remained below the September 3 high. This has no effect on my analysis.

3:30 p.m. New York time

Half an hour before the closing bell. The S&P 500 climbed during the day to 4537.50, exceeding yesterday’s high but remaining below the September 3 all-time high of 4549.50. I’ve updated the chart, adding a dotted line at the level of the September 3 peak.

9:55 a.m. New York time

What’s happening now? The S&P 500 E-mini futures stayed below yesterday’s high, 4532.25, in overnight trading.

What does it mean? The rise that began October 1 is still rising but nearing the end of its middle leg, which will be followed by a shallow correction and then a move to new highs. .

What’s the alternative? Or, possibly, the price will reach above the previous peak, 4549.50 attained on September 3, before the shallow correction begins. The uncertainty lies in how much energy the rise from October 1 still has in it.

[S&P 500 E-mini futures at 3:30 p.m., 110-minute bars, with volume]

What does Elliott wave theory say? The rise from October 1 is wave 5 of Minuscule degree within wave 3 of Submicro degree. Within Minuscule 5, from larger to smaller, the price is tracing wave 3 of Subminuscule degree, its child wave 5 of Bitsy degree, and — unlabelled on the chart — its grandchild, wave 5 of Subbitsy degree. I’m less certain of the Subbitsy count, and indeed, yesterday’s high may in fact be the end of Subitsy 5, Bitsy 5 and Subminuscule 3, and the beginnging of the 4th wave of Subminusule degree, a shallow correction.

Learning and other resources. Elliott wave analysis provides context, not prophecy. As the 20th century semanticist Alfred Korzybski put it in his book Science and Sanity (1933), “The map is not the territory … The only usefulness of a map depends on similarity of structure between the empirical world and the map.” And I would add, we can judge that similarity of structure only after the fact.

See the menu page Analytical Methods for a rundown on where to go for information on Elliott wave analysis.

By Tim Bovee, Portland, Oregon, October 21, 2021

Disclaimer

Tim Bovee, Private Trader tracks the analysis and trades of a private trader for his own accounts. Nothing in this blog constitutes a recommendation to buy or sell stocks, options or any other financial instrument. The only purpose of this blog is to provide education and entertainment.

No trader is ever 100 percent successful in his or her trades. Trading in the stock and option markets is risky and uncertain. Each trader must make trading decisions for his or her own account, and take responsibility for the consequences.

License
Creative Commons License

All content on Tim Bovee, Private Trader by Timothy K. Bovee is licensed under a Creative Commons Attribution-ShareAlike 4.0 International License.

Based on a work at www.timbovee.com.

SP500 Analysis

3:30 p.m. New York time

Half an hour before the closing bell. Today’s high of the day remains at 4532.25. No change to the morning analysis and the 1:55 p.m. update. I’ve updated the chart.

1:55 p.m. New York time

Approaching a new high. The S&P 500 is approaching the all-time high it set on September 3. The present high so far today is 4532.25 on the futures The September 3 futures peak was 4549.50.

There is nothing in the rules of Elliott wave analysis that forbids the present rise from exceeded the September 3 peak. The S&P 500 is present in wave 5 of Micro degree; the September 3 peak was wave 3 of Micro degree. It is normal and expected for the 5th wave to exceed the prior 3rd wave of the same degree. So what we’re seeing in the markets today is business as usual.

On the other hand, there is nothing that requires the present 3rd wave of Subminuscule degree to exceed the September 3 high, which is three degrees larger. So today may not be the day the price hits a new high. No guarantees, either way.

9:35 a.m. New York time

What’s happening now? The S&P 500 E-mini futures traded below yesterday’s high, 4517.50, in overnight trading, rising back to that price minutes after the opening bell this morning.

What does it mean? The pause in the rise is a shallow correction within middle leg of an uptrend that began on October 12. The pause will be followed by a resumption of the uptrend.

What’s the alternative? At this point the chart has a great deal of clarity and I have no alternative analysis. As always, price movements can turn ambiguous at any moment.

[S&P 500 E-mini futures at 3:30 p.m., 105-minute bars, with volume]

What does Elliott wave theory say? The present sideways movement is wave 4 of Subbitsy degree within wave 5 of Bitsy degree within wave 3 of Subminuscule degree. Fourth wave corrections tend to be shallow, and this very low degree 4th wave is following the pattern.

The end of Bitsy 5 will also be the end of the parent, Subminuscule 3, which will be followed by a Subminuscule 4th wave correction two degrees larger than Subbitsy. Afterward, wave 5 of Subminuscule degree will begin, pushing higher, where its completion will also end the parent, wave 5 of Minuscule degree and the grand-parent, wave 1 of Submicro degree.

With the end of Submicro 1, things start to get interesting. Submicro 1 and its parent wave, Micro 5, began on October 1 from 4269. Submicro 1 will be followed by a 2nd wave correction, and 2nd waves tend to retrace a great deal of the preceding 1st wave. So with wave 2 of Submicro degree I’m expecting the price to fall back in to the region of Submicro wave 1’s beginning — the upper 4200s or, if the correction stops short, perhaps the lower 4300s.

Following the 2nd wave correct, the uptrend will resume, in the form of an energetic wave 3 of Submicro degree.

Learning and other resources. Elliott wave analysis provides context, not prophecy. As the 20th century semanticist Alfred Korzybski put it in his book Science and Sanity (1933), “The map is not the territory … The only usefulness of a map depends on similarity of structure between the empirical world and the map.” And I would add, we can judge that similarity of structure only after the fact.

See the menu page Analytical Methods for a rundown on where to go for information on Elliott wave analysis.

By Tim Bovee, Portland, Oregon, October20, 2021

Disclaimer

Tim Bovee, Private Trader tracks the analysis and trades of a private trader for his own accounts. Nothing in this blog constitutes a recommendation to buy or sell stocks, options or any other financial instrument. The only purpose of this blog is to provide education and entertainment.

No trader is ever 100 percent successful in his or her trades. Trading in the stock and option markets is risky and uncertain. Each trader must make trading decisions for his or her own account, and take responsibility for the consequences.

License
Creative Commons License

All content on Tim Bovee, Private Trader by Timothy K. Bovee is licensed under a Creative Commons Attribution-ShareAlike 4.0 International License.

Based on a work at www.timbovee.com.

SP500 Analysis

3:30 p.m. New York time

Half an hour before the closing bell. The S&P 500 continued to rise throughout the trading session, reaching a high of 4511.50 so far. No change in the analysis. I’ve updated the chart.

1 p.m. New York time

My trading. I’ve exited my bull put options spread position on SPY for a profit and have updated the analysis with details.

9:35 a.m. New York time

What’s happening now? The S&P 500 E-mini futures continued to rise overnight, reaching 4504.50 before the opening bell.

What does it mean? The rise that began yesterday is the final leg of a rise that began October 13, which in turn is the middle leg of a rise that began October 12. That middle leg will be followed by a decline that may carry the price back down to the low 4300s. Long story short: More rising prices in the S&P 500’s near future, punctuated by at least one correction that will startle the market..

What’s the alternative? None at the moment. The chart is quite clear. Which isn’t to say ambiguities won’t develop during today’s trading.

[S&P 500 E-mini futures at 3:30 p.m., 180-minute bars, with volume]

What does Elliott wave theory say? The present line-up, small to large, is wave 5 of Bitsy degree within wave 3 of Subminuscule degree within wave 5 of Minuscule degree withing wave 1 of Submicro degree. Subminuscule 3 will be followed by a shallow correction and then a rise to new heights that will complete the parent, Minuscule wave 5, and the grand-parent, Submicro wave 1.

The ensuing Submicro 2, as is typical of second waves, will likely retrace a large portion of the rise from October 1, sending a wave of fear through the markets, and will be followed by an energetic 3rd wave to the upside, a shallow 4th-wave downward correction, and a final 5th wave push upward that will complete 5th waves at four levels, from Micro to Minute, which in turn will complete wave 3 of Minor degree within wave 5 of Intermediate degree, which began on December 26, 2018.

Learning and other resources. Elliott wave analysis provides context, not prophecy. As the 20th century semanticist Alfred Korzybski put it in his book Science and Sanity (1933), “The map is not the territory … The only usefulness of a map depends on similarity of structure between the empirical world and the map.” And I would add, we can judge that similarity of structure only after the fact.

See the menu page Analytical Methods for a rundown on where to go for information on Elliott wave analysis.

By Tim Bovee, Portland, Oregon, October 19, 2021

Disclaimer

Tim Bovee, Private Trader tracks the analysis and trades of a private trader for his own accounts. Nothing in this blog constitutes a recommendation to buy or sell stocks, options or any other financial instrument. The only purpose of this blog is to provide education and entertainment.

No trader is ever 100 percent successful in his or her trades. Trading in the stock and option markets is risky and uncertain. Each trader must make trading decisions for his or her own account, and take responsibility for the consequences.

License
Creative Commons License

All content on Tim Bovee, Private Trader by Timothy K. Bovee is licensed under a Creative Commons Attribution-ShareAlike 4.0 International License.

Based on a work at www.timbovee.com.

SP500 Analysis

3:30 p.m. New York time

Half an hour before the closing bell. The S&P 500 fell from the peak attained by the futures in overnight trading and then resumed the rise. In my revised principal Elliott wave analysis, I’ve counted the wave 3 correction of Subminuscule degree as still being underway. The decline from the overnight peak had five waves, which is too many for a complete correction. So the new high is either an expanding triangle pattern within the 4th wave correction or a continuation of wave 3 of Subminuscule degree. I’ve opted for the continuation of wave 3, which is plausible, given the internal count of that wave.

9:35 a.m. New York time

What’s happening now? The S&P 500 E-mini futures in overnight trading completed their rise that began on October 13 and began a shallow correction.

What does it mean? The correction will be followed by a push higher that will complete the first leg of the rise that began on October 1 and will be followed buy a sharp move to the downside that will remain above 4260.

What’s the alternative? The rise since October 1 could prove to be a separator, marking the boundary between two corrective patterns within a compound structure.

[S&P 500 E-mini futures at 3:30 p.m., 100-minute bars, with volume]

What does Elliott wave theory say? The overnight peak at 4469.50 marked the end of wave 3 of Subminuscule degree and the beginning of a shallow 4th-wave correction, all within wave 5 of Minuscule degree. The end of Minuscule 5 will trigger the simultaneous end of wave 1 of Submicro degree, which began October 1 from 4260. The ensuing wave 2 of Submicro degree, if it follows the pattern of most 2nd waves I’ve seen, will retrace much of the 1st-wave rise from October 1. Under the rules of Elliott wave analysis, 2nd waves never move beyond the start of the preceding 1st wave, and so the price will remain above the October 1 low of 4260.

The alternative is unchanged from the last few days: The rise from October 1 is an X wave of Submicro degree separating two corrective patterns in a compound correction. Such compound corrections are common in 4th waves, which matches the nature of the parent, wave 4 of Micro degree, which began September 3.

Learning and other resources. Elliott wave analysis provides context, not prophecy. As the 20th century semanticist Alfred Korzybski put it in his book Science and Sanity (1933), “The map is not the territory … The only usefulness of a map depends on similarity of structure between the empirical world and the map.” And I would add, we can judge that similarity of structure only after the fact.

See the menu page Analytical Methods for a rundown on where to go for information on Elliott wave analysis.

By Tim Bovee, Portland, Oregon, October 18, 2021

Disclaimer

Tim Bovee, Private Trader tracks the analysis and trades of a private trader for his own accounts. Nothing in this blog constitutes a recommendation to buy or sell stocks, options or any other financial instrument. The only purpose of this blog is to provide education and entertainment.

No trader is ever 100 percent successful in his or her trades. Trading in the stock and option markets is risky and uncertain. Each trader must make trading decisions for his or her own account, and take responsibility for the consequences.

License
Creative Commons License

All content on Tim Bovee, Private Trader by Timothy K. Bovee is licensed under a Creative Commons Attribution-ShareAlike 4.0 International License.

Based on a work at www.timbovee.com.

SP500 Analysis

3:30 p.m. New York time

Half an hour before the closing bell. The S&P 500 has continued its rise, reaching 4467.50 on the futures, 4475.82 on the index. Wave 3 of Subminuscule degree within wave 5 of Minuscule degree continues. No change in the analysis. I’ve updated the upper chart.

9:35 a.m. New York time

What’s happening now? The S&P 500 E-mini futures continued to rise overnight, reaching a high of 4446.15.

What does it mean? The rise is the final leg of an uptrend that began October 1 and will be followed by followed by a correction of the rise that began on May 13 from 4046.88 on the index.

What’s the alternative? The present rise is a wave connecting two corrective patterns in a compound structure. The final leg of the uptrend has not yet begun.

Chart. The upper chart is a short-term view of the futures, from September to the present. The lower chart is a long-term view of the index, from 2018 to the present.

[S&P 500 E-mini futures at 3:30 p.m., 90-minute bars, with volume]
[S&P 500 index, 2-day bars]

What does Elliott wave theory say? The present rise is wave 3 of Subminuscule degree within wave 5 of Minuscule degree, whose completion will mean the end of wave 1 of Submicro degree.

But what does that really signify? One of the great discoveries of R.N. Elliott in the 1930s, as he developed the theory named after him, was that on stock charts, the large and the small follow the same patterns. There is nothing to distinguish a weekly chart with 30-minute bars from a yearly chart with daily bars from a 20-year chart with monthly bars. Large or small, the charts trace patterns that follow the same rules and tendencies.

The larger waves — what I call the parent waves — provide context for understanding the implications of the smaller waves — the child waves. And this operates all the up and down the degrees tracked in Elliott wave theory, from the present wave 3 of Subminuscule degree all the way up to wave 3 of Grand Supercycle degree, which, according to Elliott wave analyst Robert Prechter, founder of Elliott Wave International, got its start in the 18th century.

A brief homage: Prechter’s work taught me everything I know about Elliott wave theory, since I first read his book, The Elliott Wave Principle, in the early 1980s. The Elliott Wave International site is a generous teacher, and I recommend it to anyone who wants to improve their Elliott wave analytical skills. (Not a paid ad. This is me speaking from the heart.)

Here I’ll trace the degrees from small to large, as I understand them through my analysis, describing what I see as the significance of each.

Wave 3 of Subminuscule degree is the middle wave of its parent degree. When it is complete, it will go through a shallow 4th wave correction, and then push up further as a 5th wave. Subminuscule degrees tend to reach completion within a week.

Wave 5 of Minuscule degree is the final wave within its parent wave. When complete, it will mark the end of its parent wave 1 of Micro degree.

Wave 1 of Submicro degree is the first of five waves. First waves tend to be a bit tentative, as though traders aren’t quite able to believe that an uptrend is underway. It is followed by 2nd wave correction that reclaims much of the 1st wave’s rise, and then by an energetic 3rd wave. It is that 3rd wave, in my opinion, that will be likely to break above the September 1 peak of 4545.85 on the index, 4549.50 on the futures.

The parent, wave 5 of Micro degree, is the main actor at the moment. The end of its child wave 5 of Submicro degree will also be the end of wave 5 of Micro degree.

The end of wave 5 of Submicro degree will trigger the end of a series of ancestral waves, all the way up to great-grand-parent: Micro 5, Subminuette 5, Minuette 5 and Minute 5. The largest of the degrees, Minute 5, began on September 30 and so far has lasted a month and a half, with still more time to go.

Wave 3 of Minor degree, Minute degree’s parent, will be complete by the end of the wave 5 of Minute degree and will go into a 4th wave correction. Minor wave 3 is a subwave within an expanding Diagonal Triangle that began on February 26, 2018. In Triangles, the price bounces between the upper boundary and the lower boundary. In expanding Triangles, the boundaries keep getting farther apart. So wave 4 will reach down into the 2000s or lower, and then be followed by wave 5, which will return to a still higher level. The decline will surely feel a bit like the end of the world as we know it.

Wave 5 of Intermediate degree, the expanding Diagonal Triangle that is Minor degree’s parent, will be complete when wave 5 of Minor degree reaches its end. This sets up another cascade of completions, since the end of Intermediate 5 also means the end of its parent, grand-parent and great-grand parent waves, of degrees Primary, Cycle and Supercycle — each in wave 5 — and of wave 3 Grand Supercycle degree.

Wave 3 of Grand-Supercycle degree will be followed by a shallow 4th wave correction upon completion, although “shallow” isn’t what it will feel like, since the decline will be correcting a rise reaching back into early 18th century. It’s quite possible that no one alive today will see the end of wave 4 of Grand-Supercycle degree.

And there we have it, from an overnight rise to a correction potentially lasting a century or more.

And a note on the alternative analysis: If the price reverses and moves back down toward the 4260 level, then the likelihood is that wave 4 of Micro degree is still underway, and the rise-fall pattern is wave X of Submicro degree, standing between two corrective patterns in a compound structure. This has the effect of pushing the beginning of wave 5 of Micro degree down the road a week or more. But eventually wave 4 of Micro degree will end, and the movements described in the principal forecast will begin.

Learning and other resources. Elliott wave analysis provides context, not prophecy. As the 20th century semanticist Alfred Korzybski put it in his book Science and Sanity (1933), “The map is not the territory … The only usefulness of a map depends on similarity of structure between the empirical world and the map.” And I would add, we can judge that similarity of structure only after the fact.

See the menu page Analytical Methods for a rundown on where to go for information on Elliott wave analysis.

By Tim Bovee, Portland, Oregon, October 15, 2021

Disclaimer

Tim Bovee, Private Trader tracks the analysis and trades of a private trader for his own accounts. Nothing in this blog constitutes a recommendation to buy or sell stocks, options or any other financial instrument. The only purpose of this blog is to provide education and entertainment.

No trader is ever 100 percent successful in his or her trades. Trading in the stock and option markets is risky and uncertain. Each trader must make trading decisions for his or her own account, and take responsibility for the consequences.

License
Creative Commons License

All content on Tim Bovee, Private Trader by Timothy K. Bovee is licensed under a Creative Commons Attribution-ShareAlike 4.0 International License.

Based on a work at www.timbovee.com.

SP500 Analysis

3:30 p.m. New York time

Half an hour before the closing bell. The S&P 500 has risen during the session, reaching above the October 7 high, to 4430.25 so far, in a movement that lends credence to my principal analysis: Wave 3 of Subminuscule degree within wave 5 of Minuscule degree is underway, in an Elliott wave pattern that will eventually carry the price above the September 3 peak, 4549.50, which marked the end of wave 3 of Micro degree.

9:35 a.m. New York time

What’s happening now? The S&P 500 E-mini futures continued to rise overnight, coming within one point of 4400.

What does it mean? The rise is an energetic middle leg of the rise that began on October 12 following a correction within the larger rise that began on October 1.

What’s the alternative? The correction that began October 7 is still underway and the present rise will connect two corrective patterns in a compound structure.

[S&P 500 E-mini futures at 3:30 p.m., 90-minute bars, with volume]

What does Elliott wave theory say? Under the principal scenario, the overnight rise is wave 3 of Subminuscule degree within wave 5 of Minuscule degree within wave 1 of Submicro degree within a series of 5th waves of increasing degree, from Micro up to Minute, all within wave 3 of Minor degree, which began on February 23 with the end of the early pandemic crash. This scenario requires the price in the next month or so to work its way above the September 3 high, 4549.50, which was the endpoint of wave 3 of Micro degree.

Under the alternative scenario, the rise will stop short of the October 7 high, 4420.50, and will begin tracing a second corrective pattern within a compound correction, wave 4 of Subminuette degree.

Learning and other resources. Elliott wave analysis provides context, not prophecy. As the 20th century semanticist Alfred Korzybski put it in his book Science and Sanity (1933), “The map is not the territory … The only usefulness of a map depends on similarity of structure between the empirical world and the map.” And I would add, we can judge that similarity of structure only after the fact.

See the menu page Analytical Methods for a rundown on where to go for information on Elliott wave analysis.

By Tim Bovee, Portland, Oregon, October 14, 2021

Disclaimer

Tim Bovee, Private Trader tracks the analysis and trades of a private trader for his own accounts. Nothing in this blog constitutes a recommendation to buy or sell stocks, options or any other financial instrument. The only purpose of this blog is to provide education and entertainment.

No trader is ever 100 percent successful in his or her trades. Trading in the stock and option markets is risky and uncertain. Each trader must make trading decisions for his or her own account, and take responsibility for the consequences.

License
Creative Commons License

All content on Tim Bovee, Private Trader by Timothy K. Bovee is licensed under a Creative Commons Attribution-ShareAlike 4.0 International License.

Based on a work at www.timbovee.com.