3 p.m. New York time
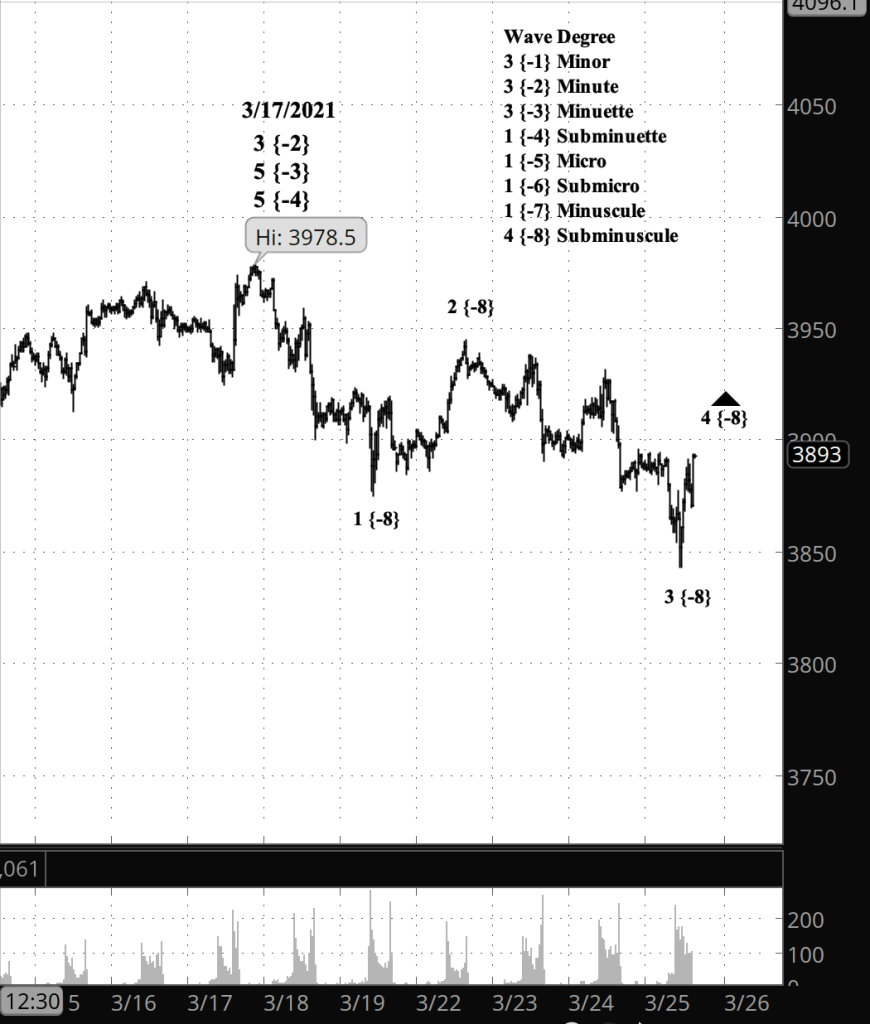
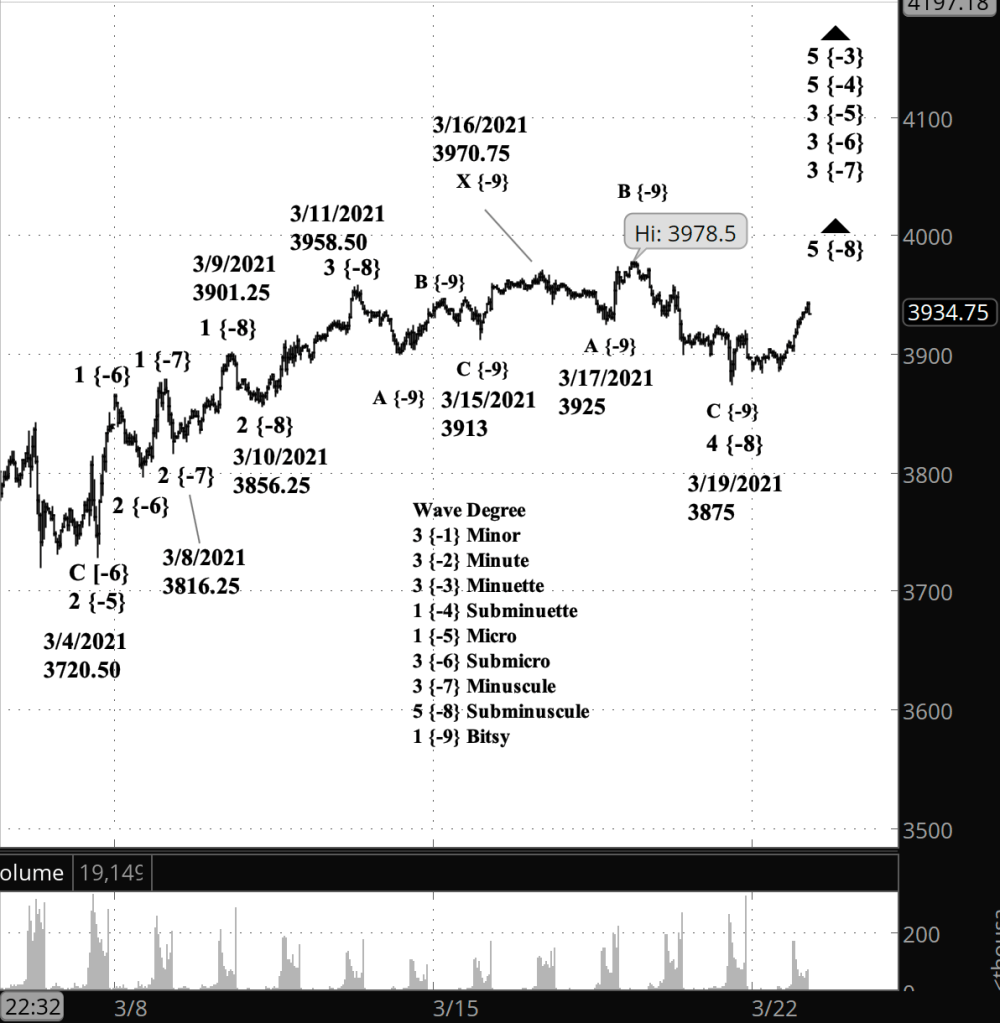
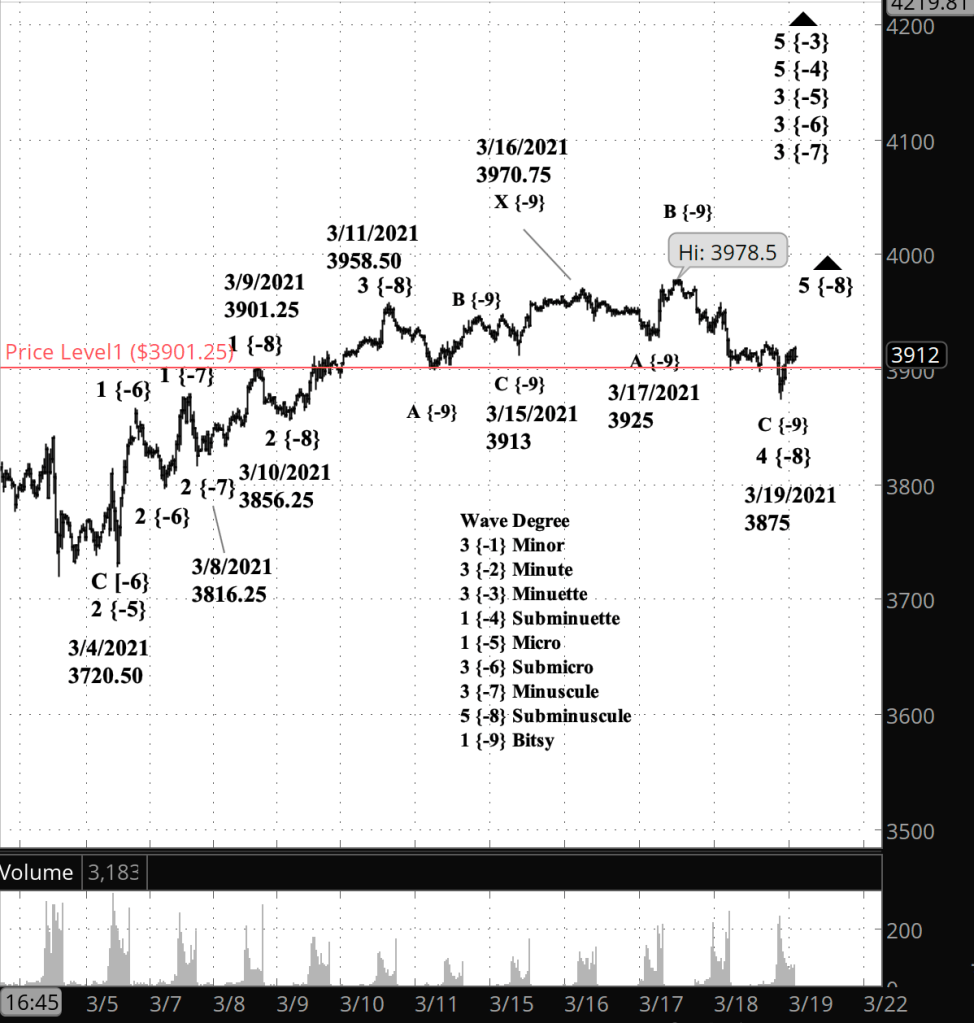
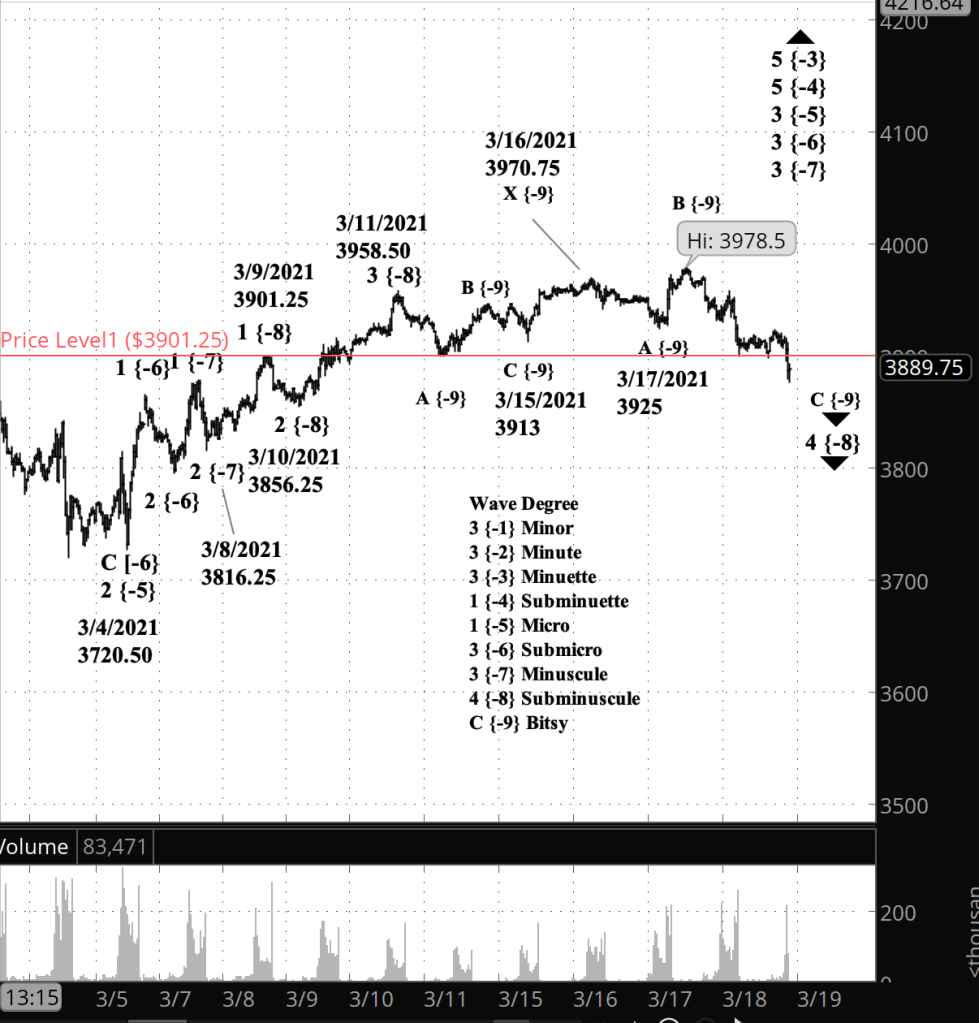
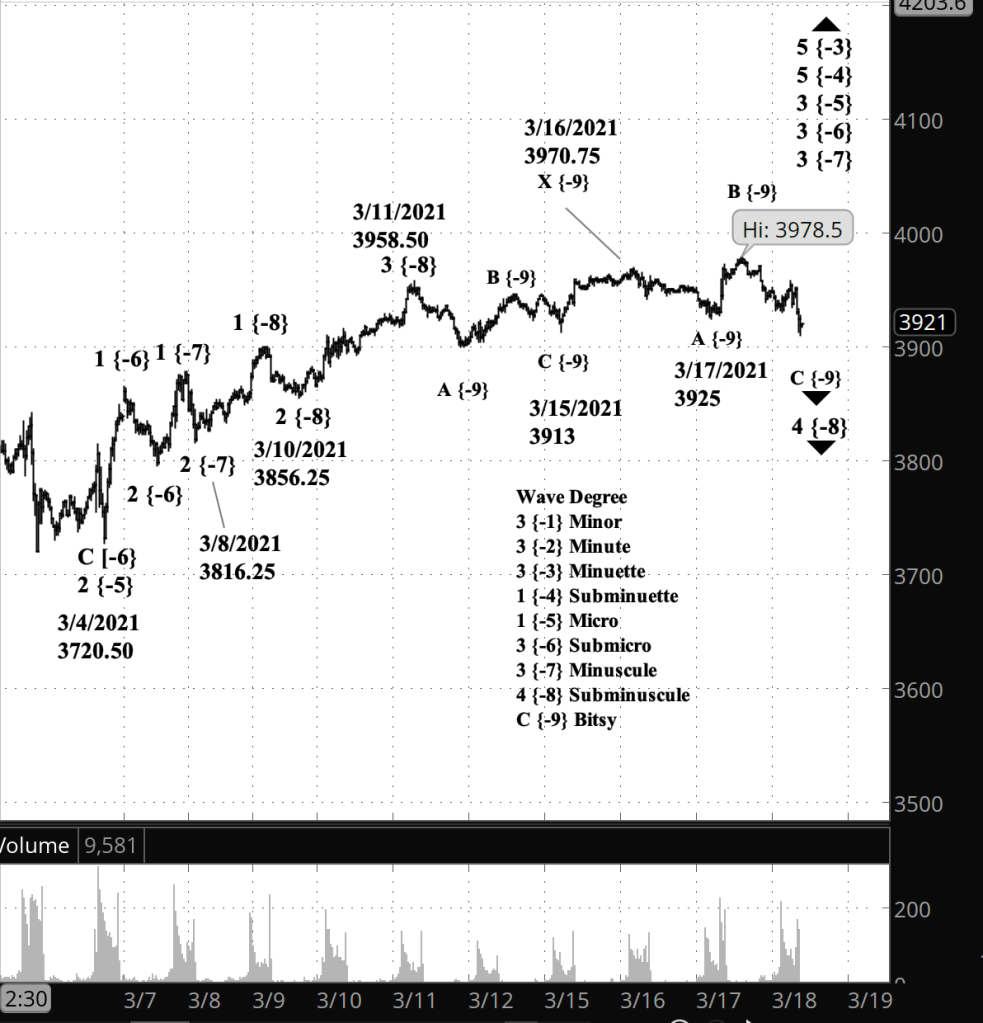
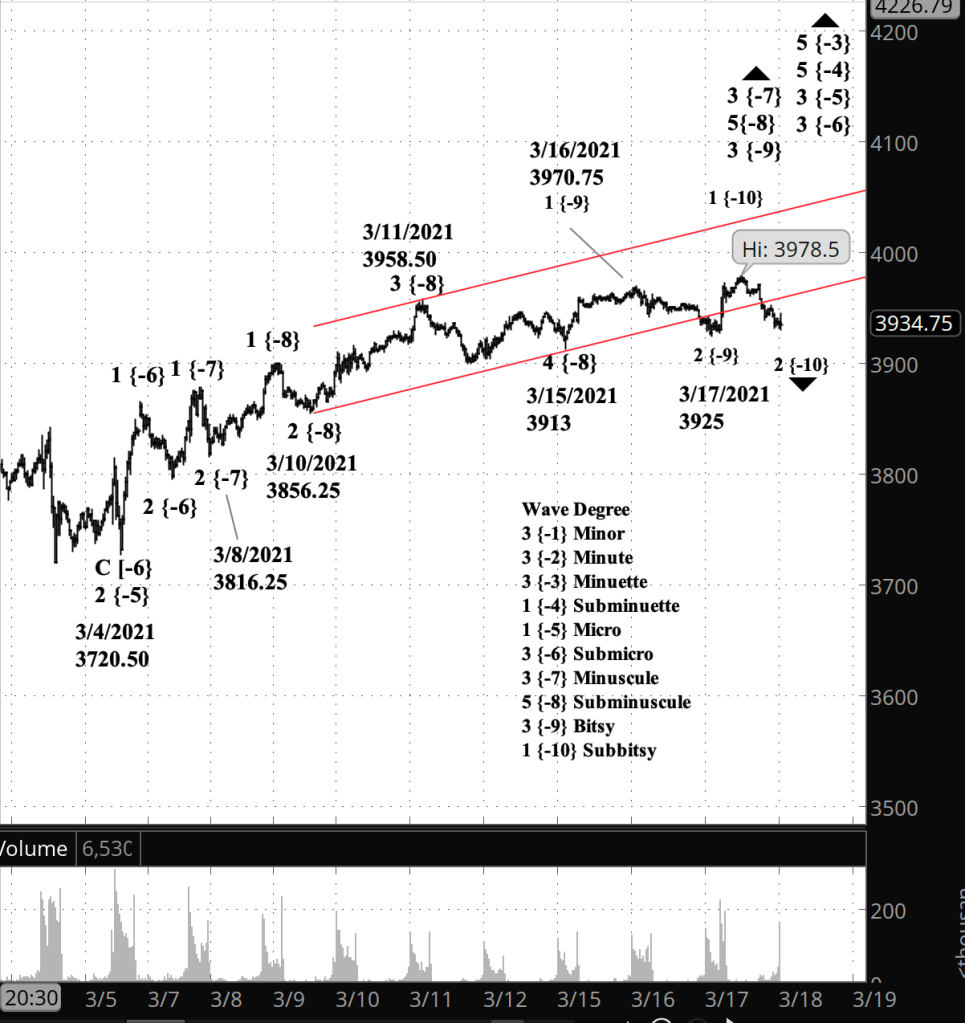
An hour before the closing bell. The S&P 500 continues the early downward movements of a 4h wave correction at the Minute degree. Here’s a chart of the E-mini futures showing details of the decline that began March 17 from 3978.50 (3983.87 on the index).
9:35 a.m. New York time
What’s happening now? The S&P 500 index, having peaked on March 17 at 3983.87 — the E-mini futures equivalent is 3978.50 — continues to work through the early phases of a decline.
What does it mean? The downward movement is a correction at higher levels, but to traders more interested in the shorter term — weeks or months — the decline will present itself as a downtrend. See the Elliott wave section for further discussion.
What is the alternative? It is possible that the final upward push of the trend that began February 20, 2020 is not yet complete, that 3983.87 is not the peak. If that proves to be the case, then there will be more net gain in the S&P 500’s near future.
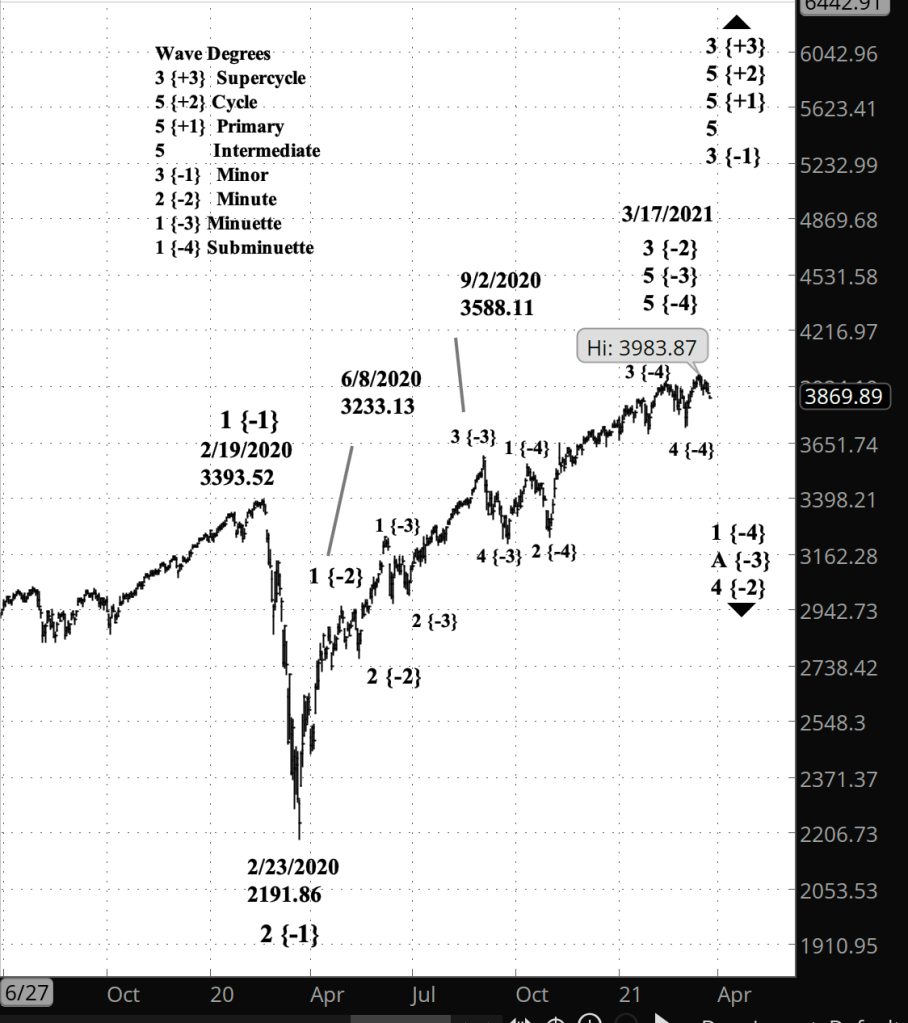
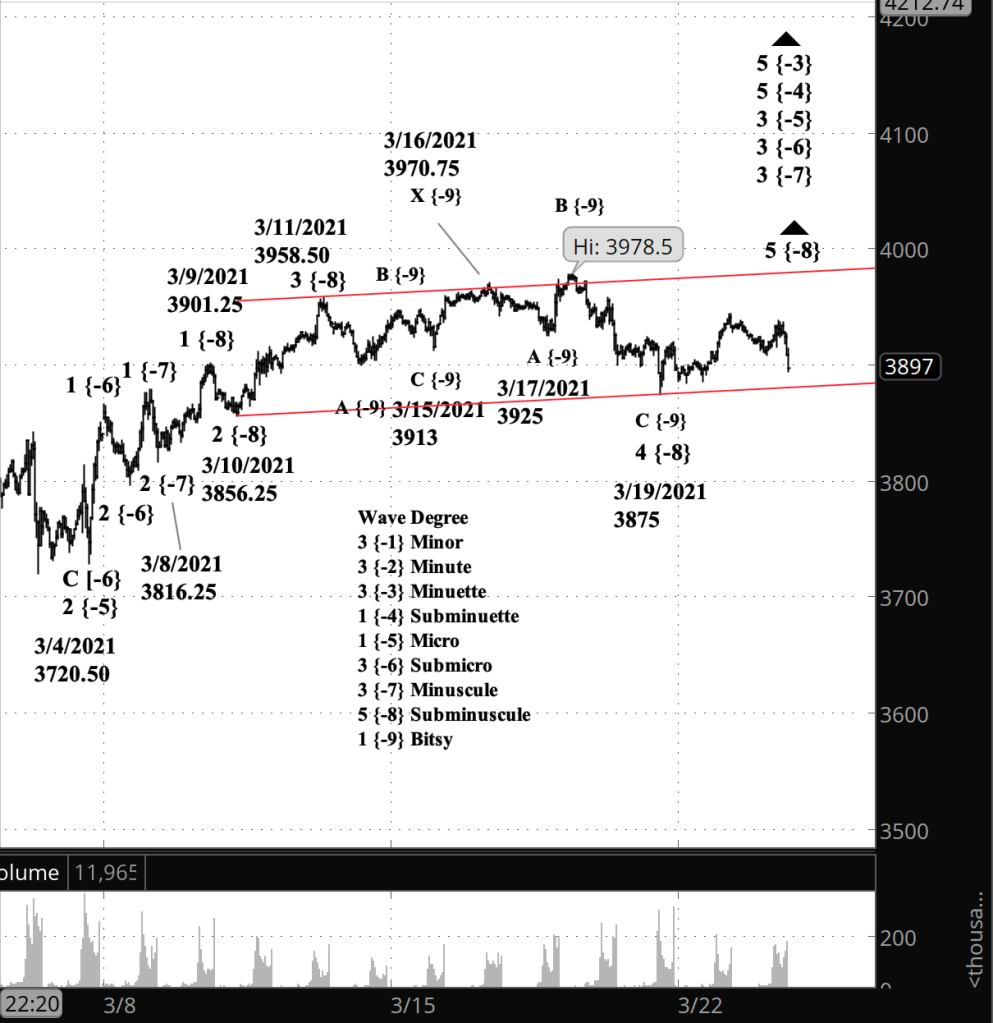
What does Elliott wave theory say? The March 17 peak marks the end of wave 5 of Subminuette degree and its parent wave 5 of Minuette degree. In turn, the end of those 5th waves marks the end of wave 3 of Minute degree, one degree higher than Minuette.
So at the Minuette degree, the index has begun a 4th wave correction to the downside. But what does that look like?
The first wave within a correction is an A wave, and an A wave within wave 4 can have either three subwaves if it is the beginning of a Flat pattern or five subwaves if it is the start of a Zigzag.
At this higher degree, wave A is presently within its first subwave, wave 1 of Minuette degree, which will look like any 1st wave: Five subwaves, just like any movement in the direction of the main trend.
The bottom line is that the word “trend” in Elliott wave analysis is a complex concept. Each wave in the direction of a trend — 1, 3 or 5 — has within it at each smaller degree counter-trend corrections as well as trending movements. Whether “the market” is in an uptrend or a downtrend depends upon what degree we’re looking at.
To my thinking that fractal complexity gives Elliott wave analysis much of its power.
What does this mean for my trading? My options trades generally last a few weeks, and so I’ll be treating this market as downtrending, at the Minuette degree and smaller. Yesterday I exited my options position that expired April 16. The next monthly series expires April 21, which gives me an optimal entry date of April 6, within a window stretching from March 30 to April 13.
Read More »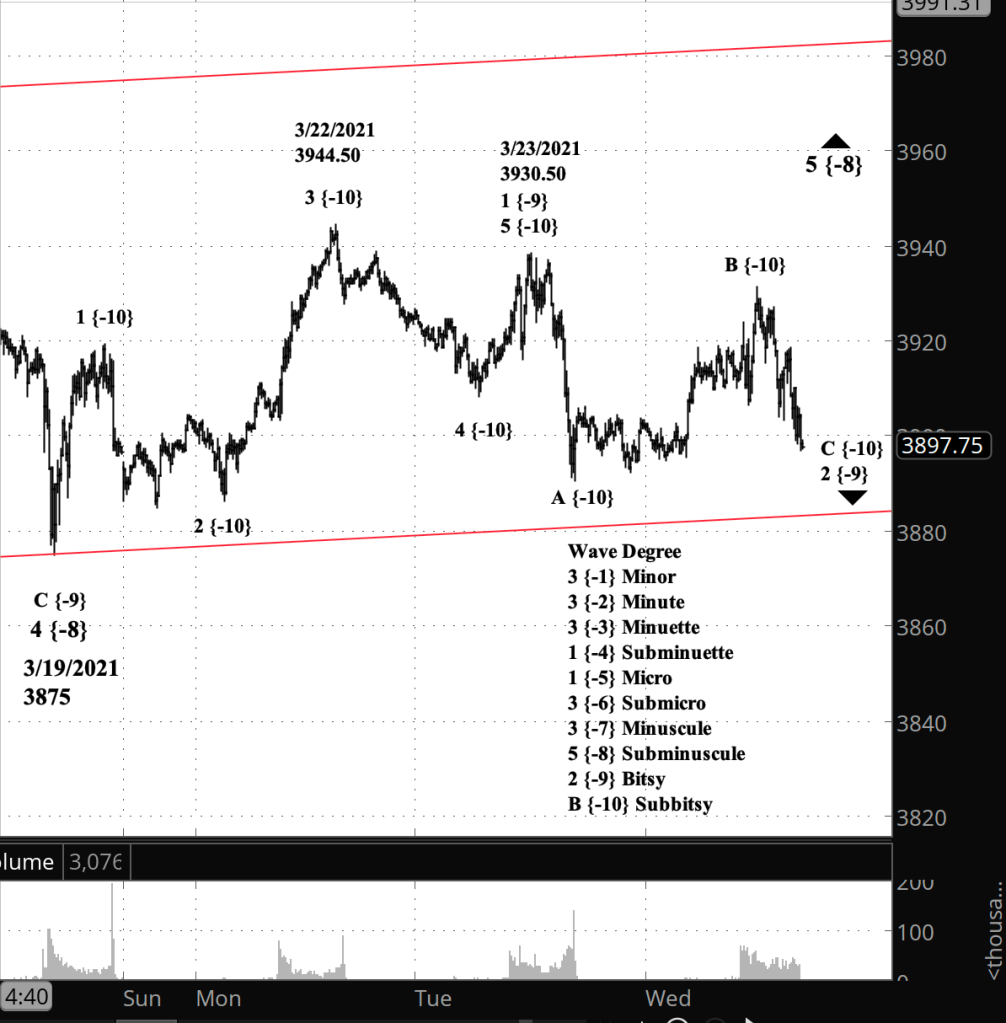


You must be logged in to post a comment.