3:30 p.m. New York time
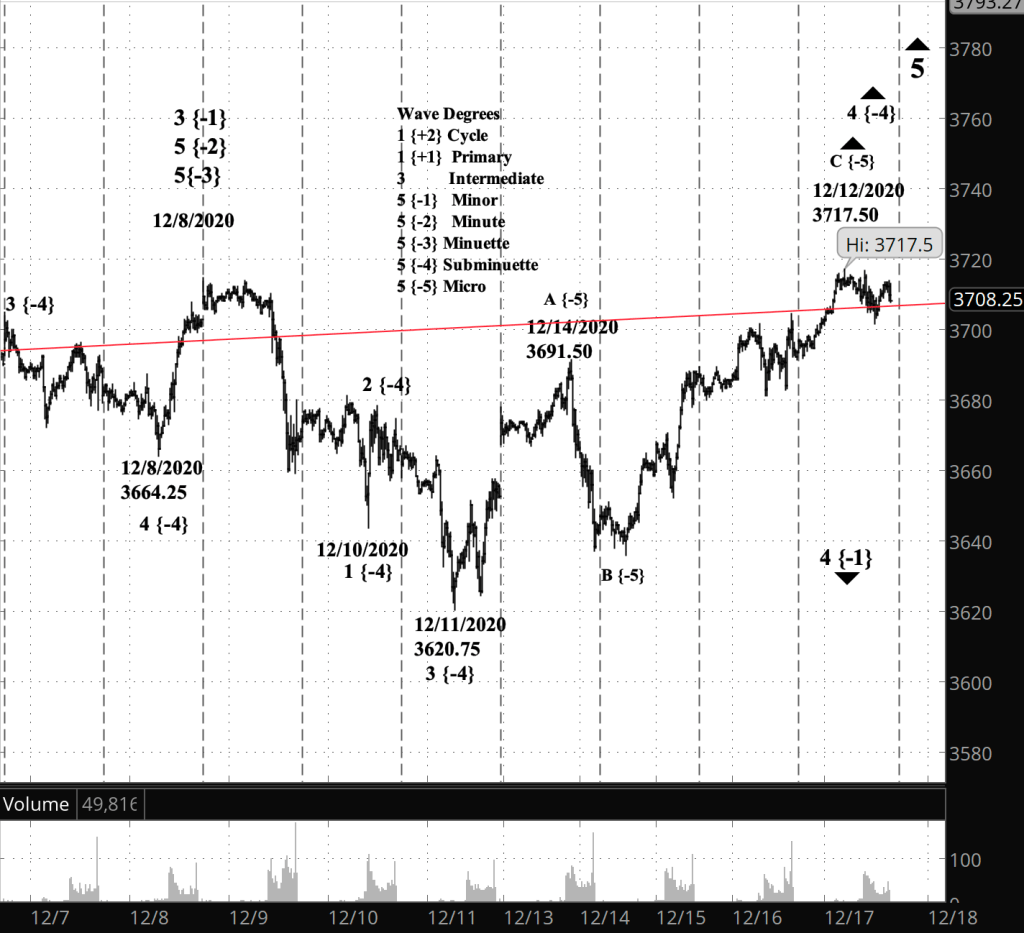
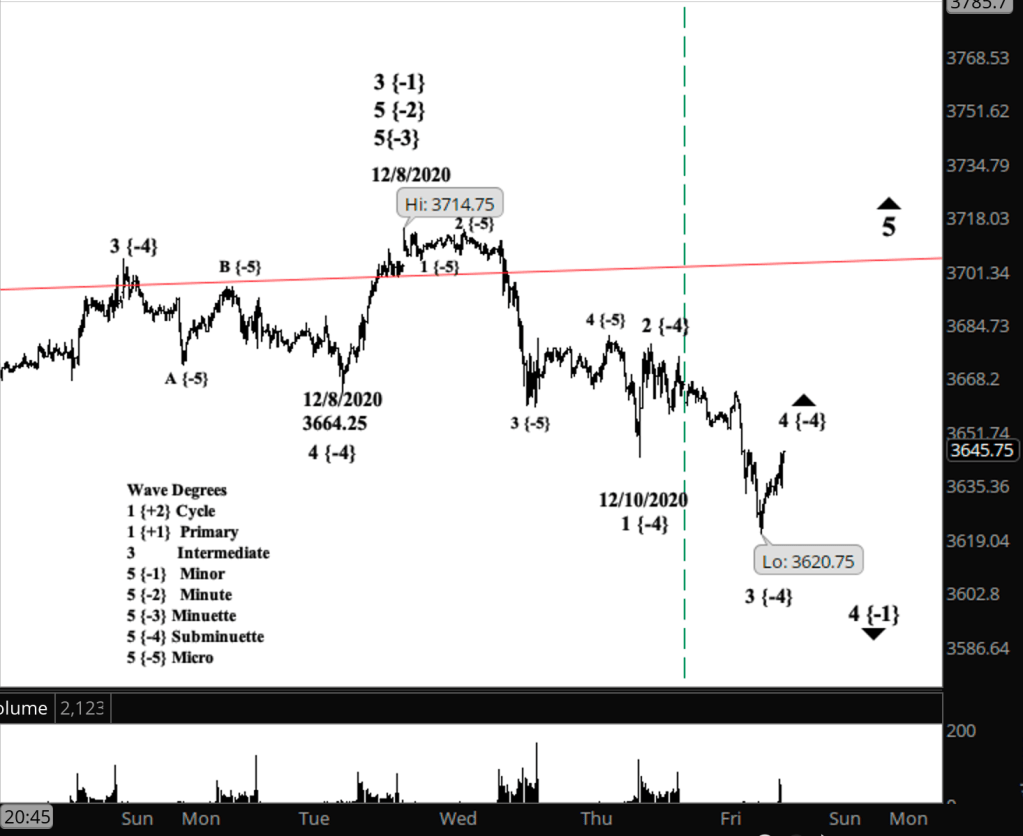
Half an hour before the closing bell. The S&P 500 peaked and drop back a little after — apparently — completing the 5th wave within wave C of Micro degree. If in fact C is indeed complete, then the ensuing decline will be either the first step of Subminuette wave 5 to the downside or the beginning of a downward wave X that will glue the corrective pattern just finished to another, future corrective pattern in a compound structure. I’ve updated the chart below.
10:30 a.m. New York time
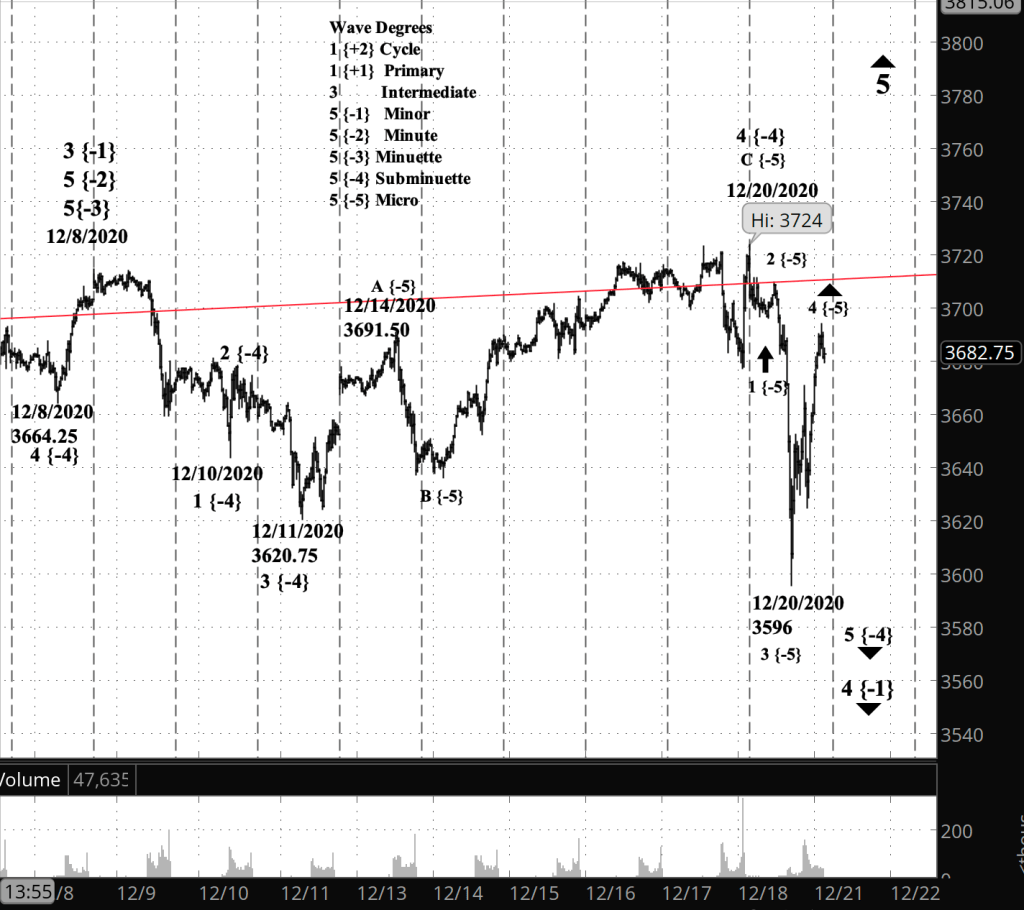
What’s happening now? The S&P 500 index E-mini futures are working through the third wave of an upward correction that began December 20.
What does it mean? The correction, once complete, will be followed by a downtrend that initially will reach below the beginning of the correction’s beginning at 3596.
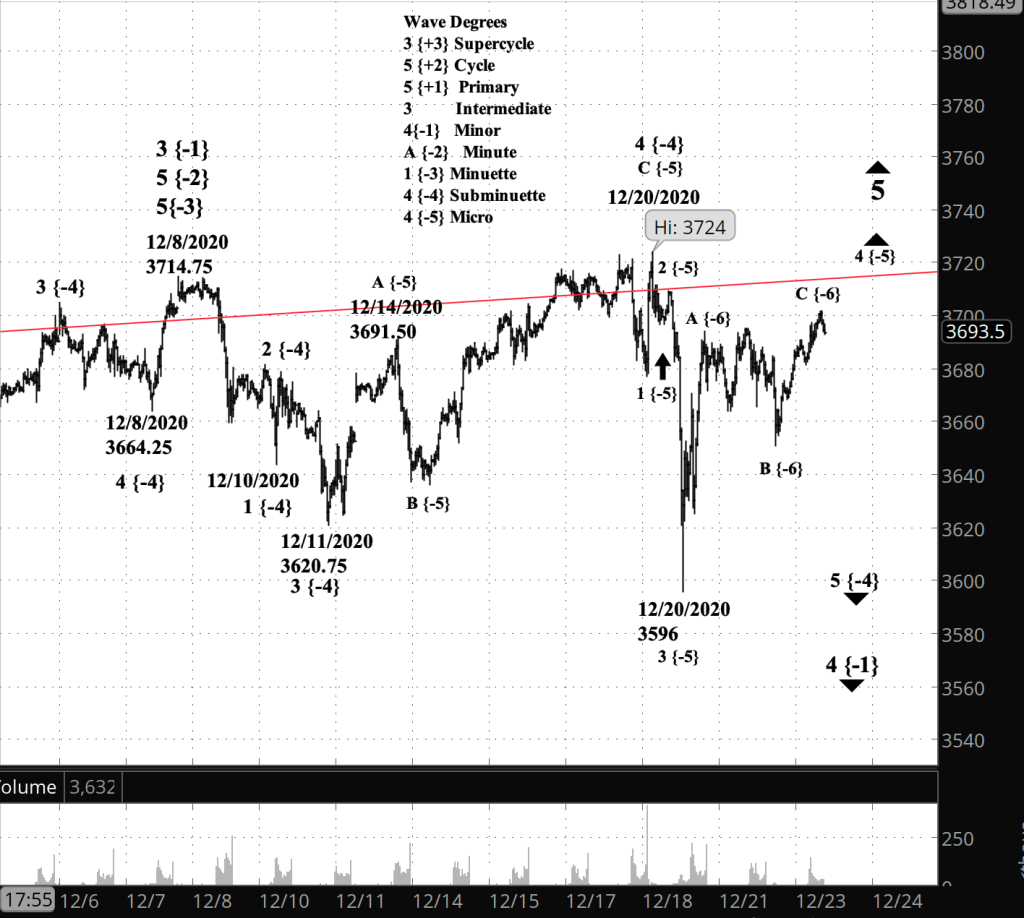
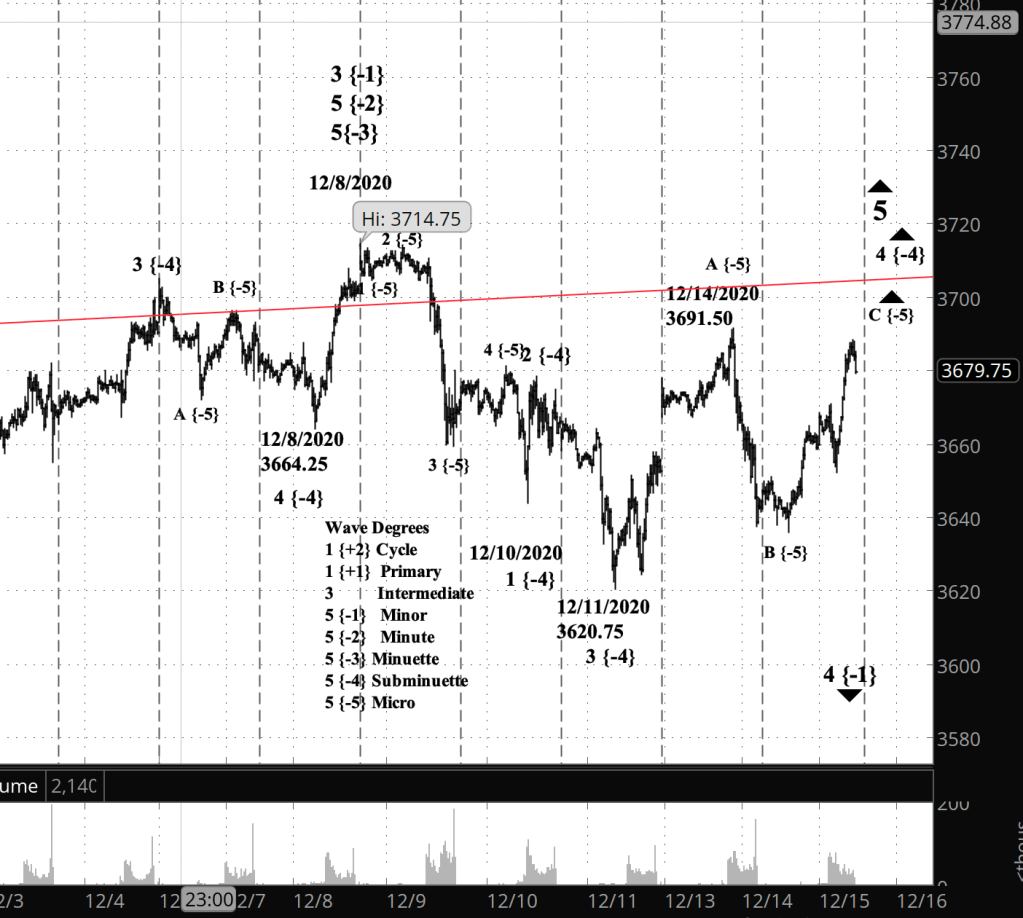
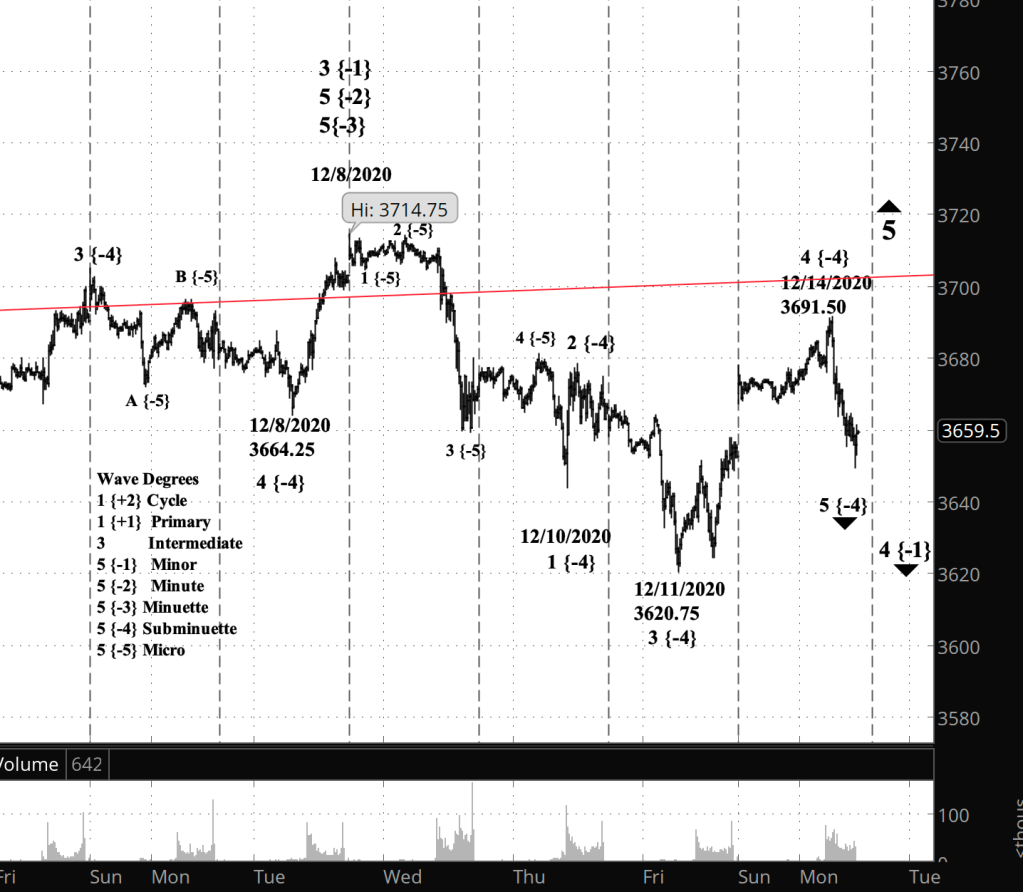
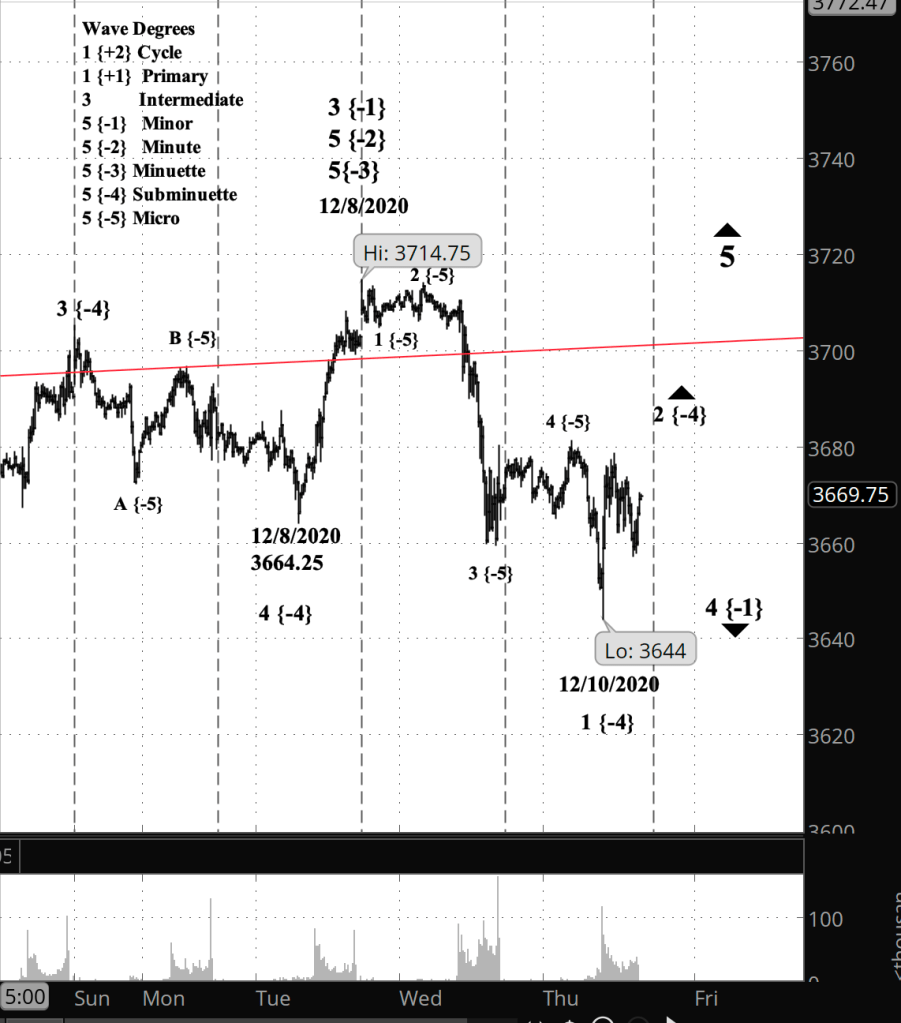
What does Elliott wave theory say? The correction, the 4th wave of Micro degree, has so far traced three waves internally and is now rising in the C wave. The correction is happening within downtrending wave 5 of Subminuette degree, which began on December 20 from 3724.
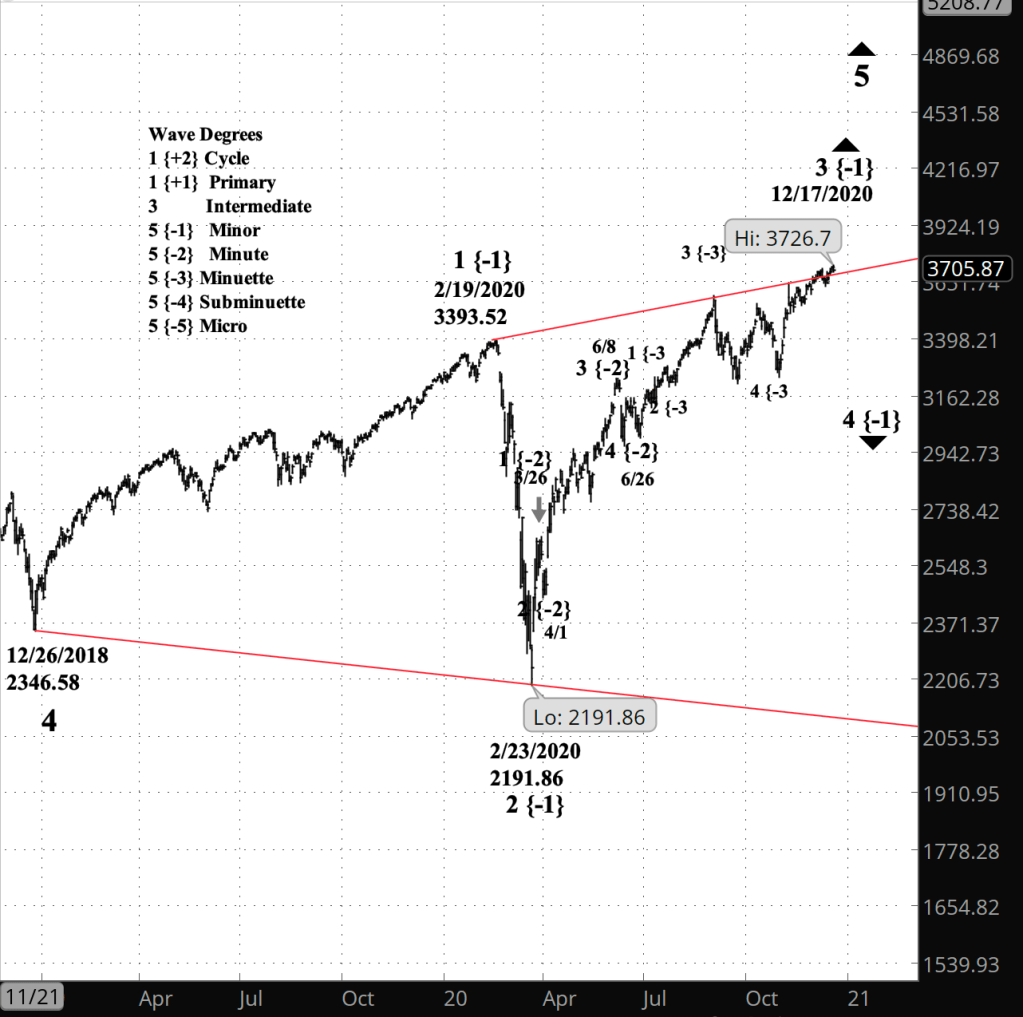
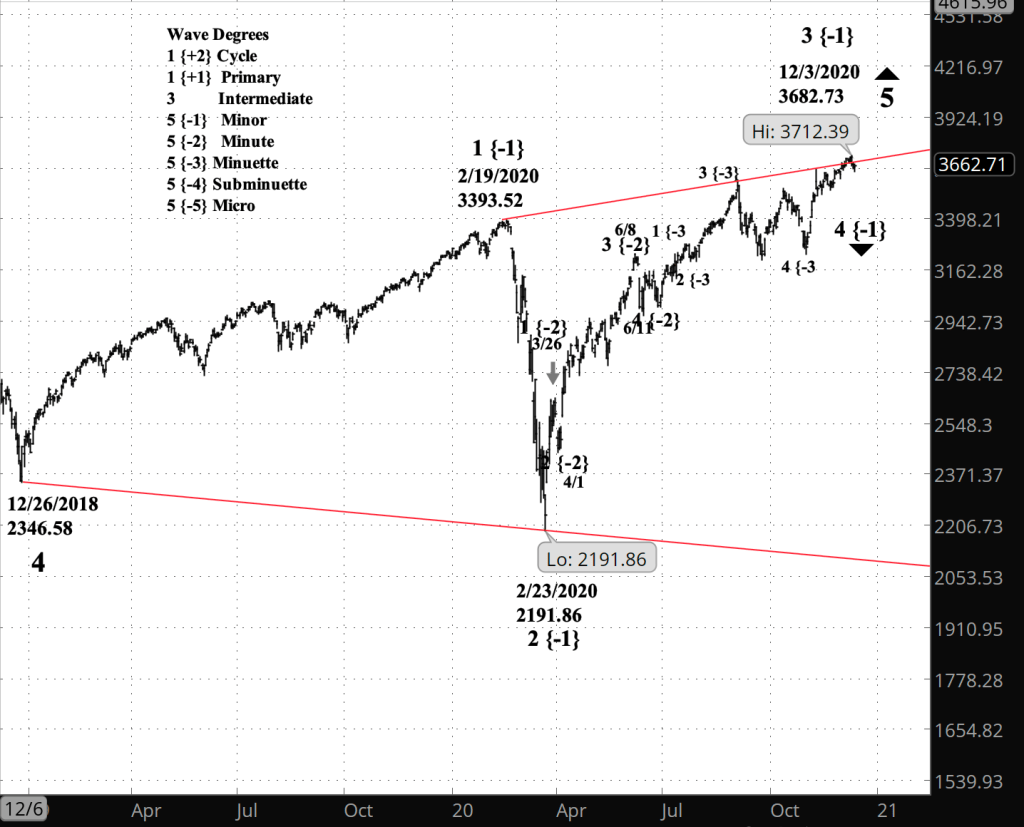
There’s a lot of complexity to the chart, especially the interrelation of the degrees. To provide guide, I’ve changed the wave numbers in the “Wave Degrees” box to reflect my count on the chart. The low level movements I’ve been tracking are all part of wave 1 of Minuette degree within descending wave A of Minute degree within wave 4 of Minor degree, the latter being a correction within rising wave 5 of Intermediate degree, which began in 2018.
Read More »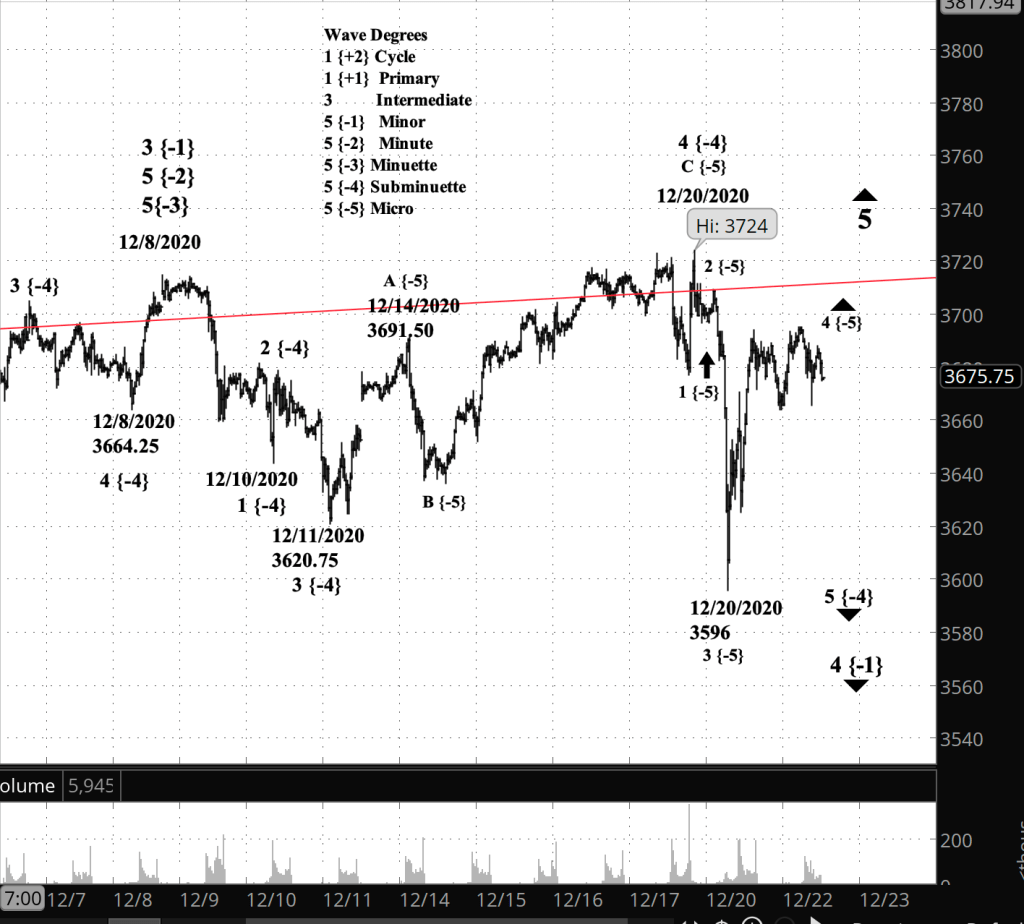



You must be logged in to post a comment.