3:30 p.m. New York time
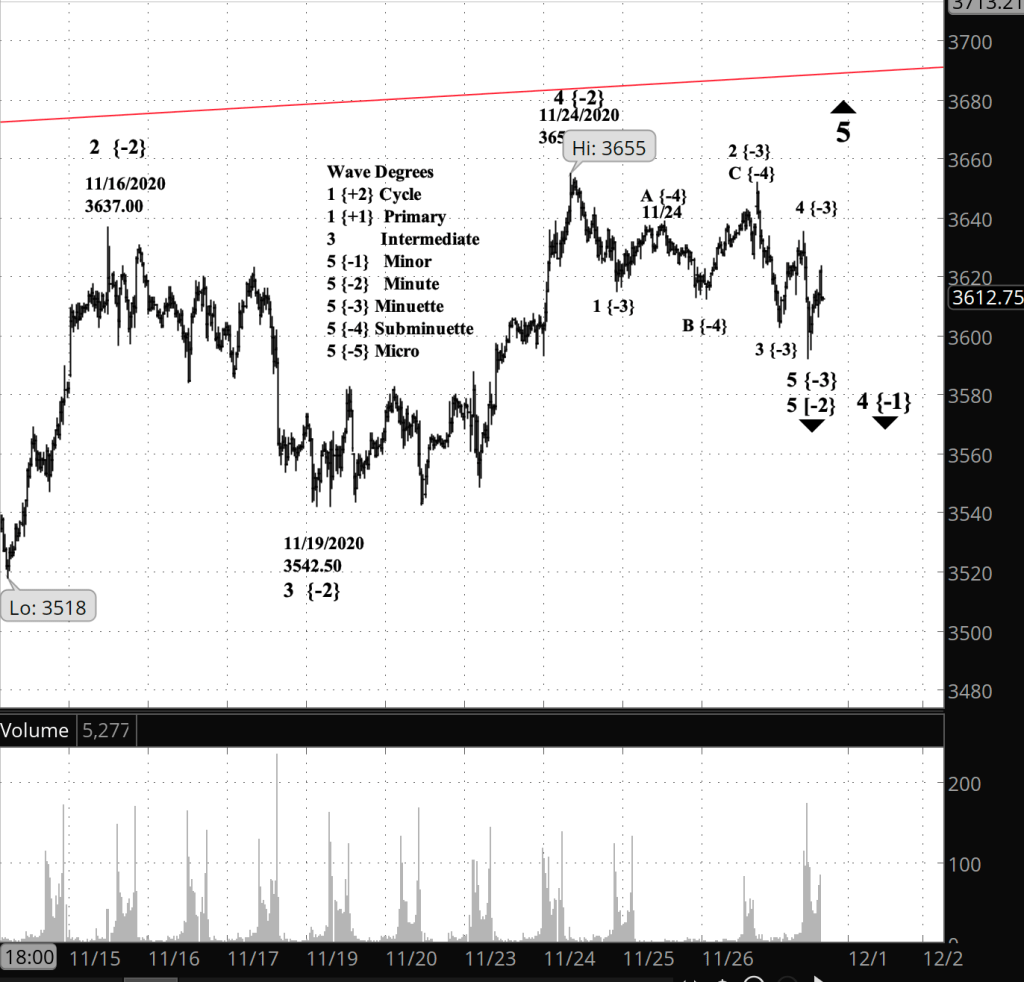
The S&P 500 continued to decline during the day. I’ve updated the chart, below, with some preliminary wave labels on the decline.
10:20 a.m. New York time
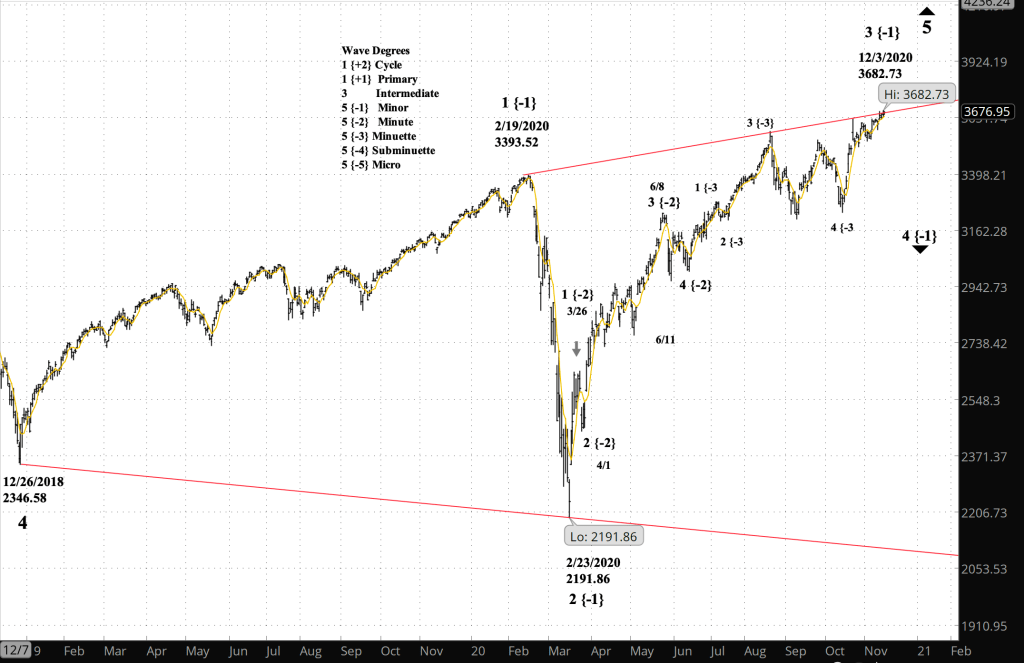
What’s happening now? The S&P 500 index and its derivatives remain above the upper boundary of a two-year-long Diagonal Triangle, peaking at 3714.75 on Tuesday and now curving around toward the downside.In the first 20 minutes of today’s trading the price fell back below the triangle boundary.
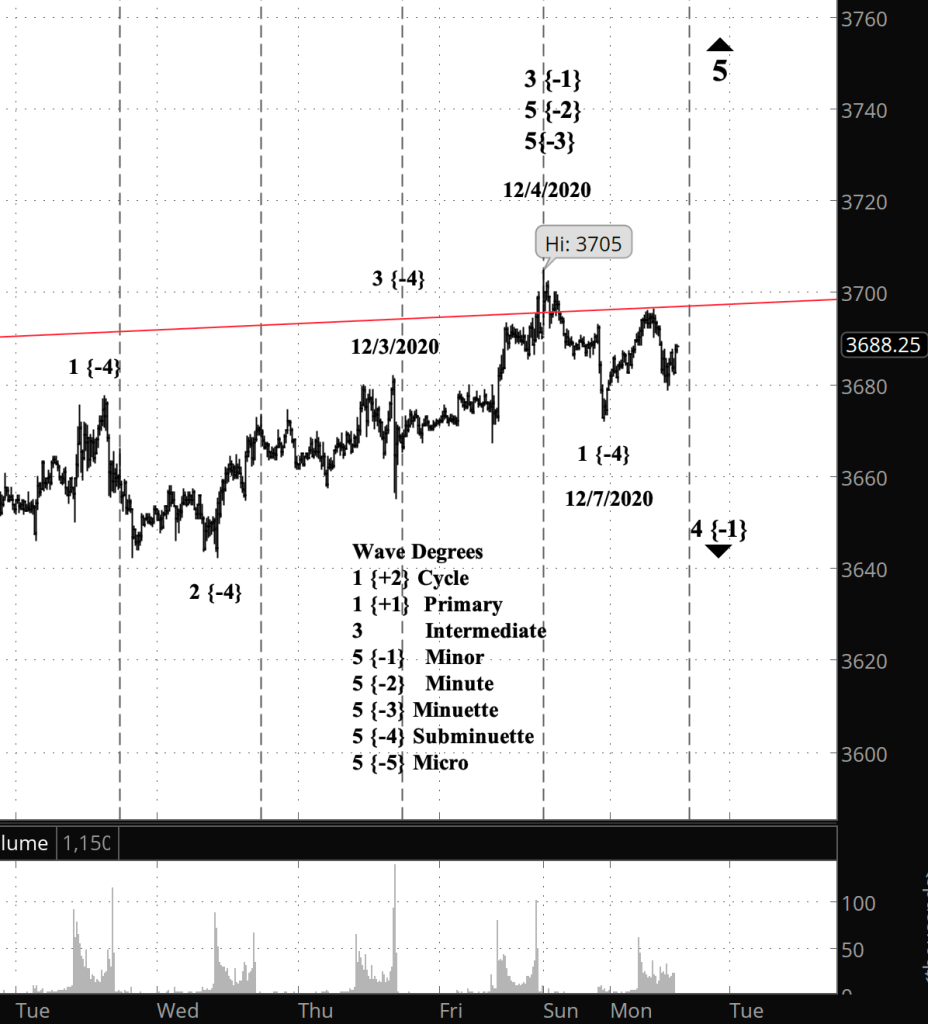
What does it mean? Three times so far I’ve had to adjust my analysis of the top of the rise that began in February, and the current top is within the rules of Elliott wave analysis show, as were its predecessors. If this indeed proves to be the top, then the market is preparing for a significant decline.
What is the alternative? It may be that Tuesday’s top will be exceeded, and if that happens, then I’ll adjust the wave count. Elliott wave analysis, after all, is about the implications of what has occurred. It says nothing about the timing of events.
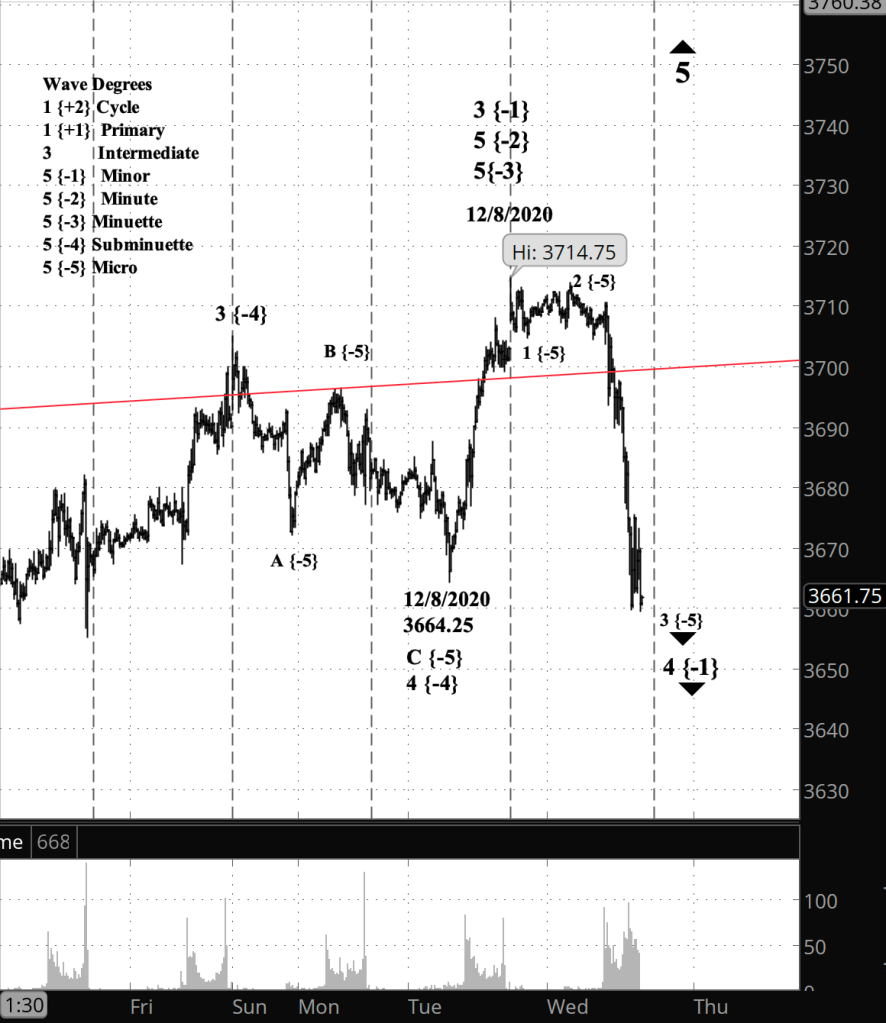
What does Elliott wave theory say? The rise from Tuesday’s low (3664.25) has so far traced five waves, with a bit of ambiguity regarding the first wave. I count that rise as wave 5 of Subminuette degree, leading to a wave 5 completion up to the parent Minute degree, and a wave 3 completion one degree up from there, at the Minor degree.
The fall below the triangle boundary, which happened just minutes ago, marks the beginning of wave 1 of Subminuette degree and, going up the scale, wave 4 of Minor degree.
My trading strategy. I’m continuing to hold my short bear call options spreads and my shares in SDS, an inverse exchange-traded fund based on the S&P 500.
Read More »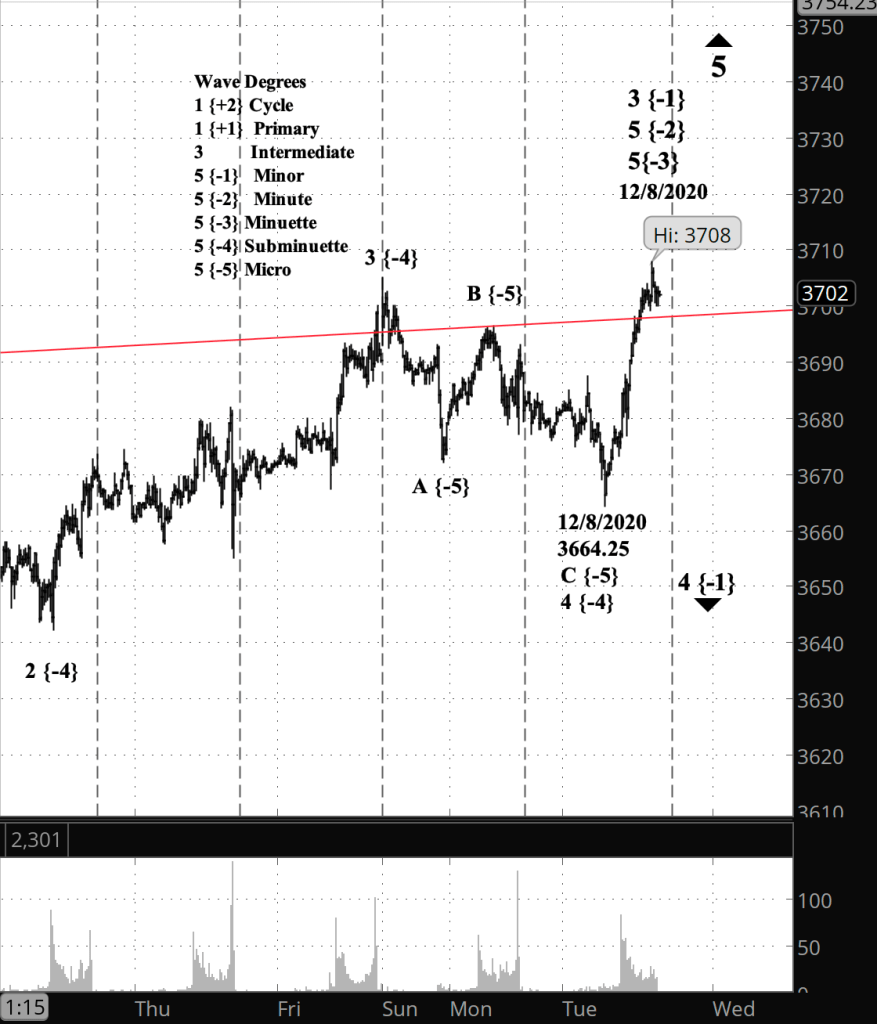



You must be logged in to post a comment.