What’s happening now? The S&P 500 index moved slightly lower at mid-day Thursday, to 3,328.82, tentatively marking the end of the decline that began the day before.
What does it mean? The index has begun an upward correction within the downward move that began on Thursday. The correction will remain below 3,428.92, the starting point of the decline.
What is the alternative? It is still possible for the price to reverse and extend the correction that began September 11 from 3,310.47. I find it to be unlikely but can’t rule it out entirely.
S&P 500 index, 30-minute bars
What does Elliott wave theory say? Thursday’s low begins the uptrending wave 2 of Subminuette degree within downtrending wave 3 of Minuette degree. At the Subminuette 2 will end below 3,428.92, the starting point of Minuette 3 and within it, Subminuette 1. A firm rule of Elliott wave analysis posits that a 2nd wave cannot move beyond the start of the preceding 1st wave. Subminuette 2 will be followed by Subminuette 3, which will take the price down to new lows in the decline since September 16
My trading strategy. My short iron condor options position on SPY, the exchange-traded fund based on the S&P 500, is 28 days from expiration and seven days until management day, when I take profits. It is trading at 12% of maximum potential profit, and I shall exit at 50% of max.
Also, I’m holding inverse exchange-traded fund shares on the S&P 500 (SDS is the symbol).
What’s happening now? The S&P 500 index moved slightly lower at mid-day Thursday, to 3,328.82, tentatively marking the end of the decline that began the day before.
What does it mean? The index has begun an upward correction within the downward move that began on Thursday. The correction will remain below 3,428.92, the starting point of the decline.
What is the alternative? It is still possible for the price to reverse and extend the correction that began September 11 from 3,310.47. I find it to be unlikely but can’t rule it out entirely.
S&P 500 index, 30-minute bars
What does Elliott wave theory say? Thursday’s low begins the uptrending wave 2 of Subminuette degree within downtrending wave 3 of Minuette degree. At the Subminuette 2 will end below 3,428.92, the starting point of Minuette 3 and within it, Subminuette 1. A firm rule of Elliott wave analysis posits that a 2nd wave cannot move beyond the start of the preceding 1st wave. Subminuette 2 will be followed by Subminuette 3, which will take the price down to new lows in the decline since September 16
My trading strategy. My short iron condor options position on SPY, the exchange-traded fund based on the S&P 500, is 28 days from expiration and seven days until management day, when I take profits. It is trading at 12% of maximum potential profit, and I shall exit at 50% of max.
Also, I’m holding inverse exchange-traded fund shares on the S&P 500 (SDS is the symbol).
What’s happening now? The S&P 500 index rose to within 4% of the upper of the trend channel.
What does it mean? The index is nearing the end of its uptrend and most likely will reverse before reaching the upper boundary of the trend channel.
What does Elliott wave theory say? The S&P E-mini futures on Sunday rose above their February 19 high, returning all of the major S&P 500 vehicles to alignment on the fifth day after they diverged. I’ll continue to focus my analysis on the S&P 500 index, turning to the E-mini futures to fill in the blanks where the index isn’t trading. (See “The Wave 2 Rule Collides With Reality“ for a description of the discrepancy.)
The index last Thursday began its 5th wave of Micro degree, the smallest degree I’ve counted as the 5th wave of Intermediate degree — five levels higher — nears completion in a Diagonal Triangle pattern.
Diagonal Triangles tend to reverse before reaching the trend channel boundary, so the end of the rise may be nearer than the boundary line might suggest.
Elliott wave theory says that the end of Intermediate 5 will mark the beginning of a downward correction that will march the price down to beyond the lower boundary of the triangle, perhaps around the 2000 level as a start, depending upon how quickly the decline progresses, and afterword, significantly below that level.
What is the alternative? There’s no limit, in the Elliott analysis rule set, on how far a 5th wave can travel, and there’s nothing that prohibits the price from breaking above the trend channel, by a little or a lot. I can guess that we’re within months of the end of Intermediate 5 and the start of the decline, but not necessarily. As always with the markets, the timing of things is a mystery.
What about my trades? I’ll continue to hold my bear shares (the inverse S&P 500 exchanged fund SDS) in the expectation that they will return to profitability during the fall after Intermediate wave 5 reaches its end. Regarding options: I’m reluctant to trade this close to the end of wave 5 while there’s also a possibility of an extended rise. So I shall bide my time.
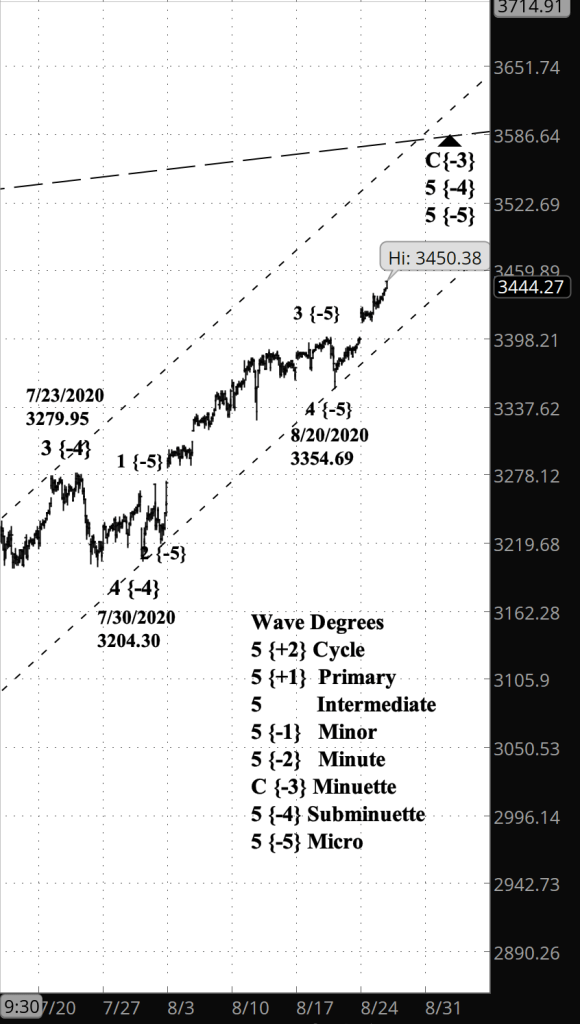
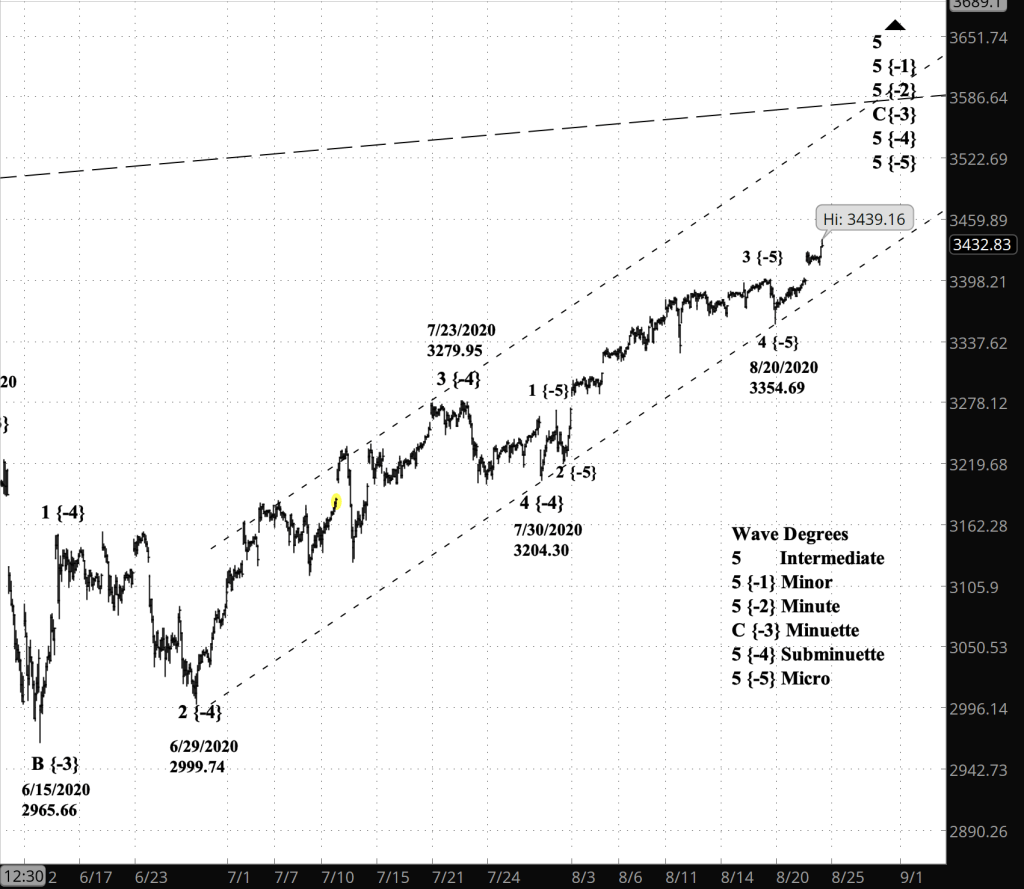
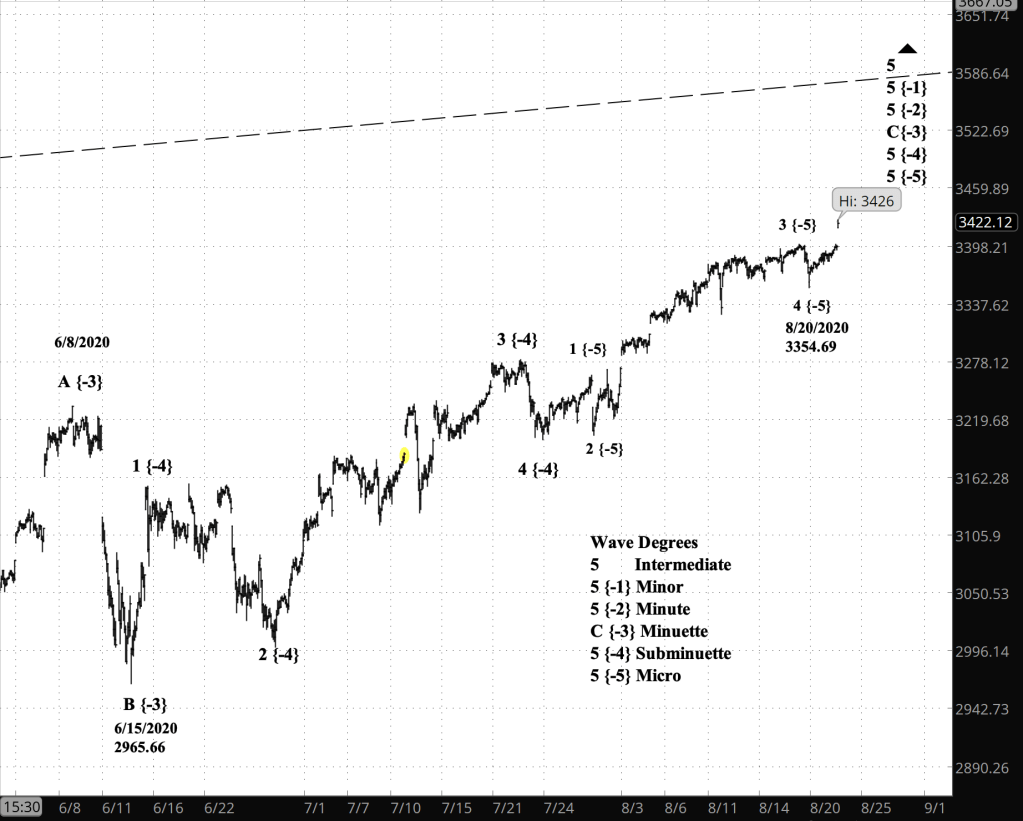
What’s happening now? The S&P 500 index continues to work its way toward the upper boundary of its trend channel, trading at the open about 200 points plus change below the boundary.
What does it mean? The closer the price is to the boundary, the higher the likelihood of a significant reversal to the downside.
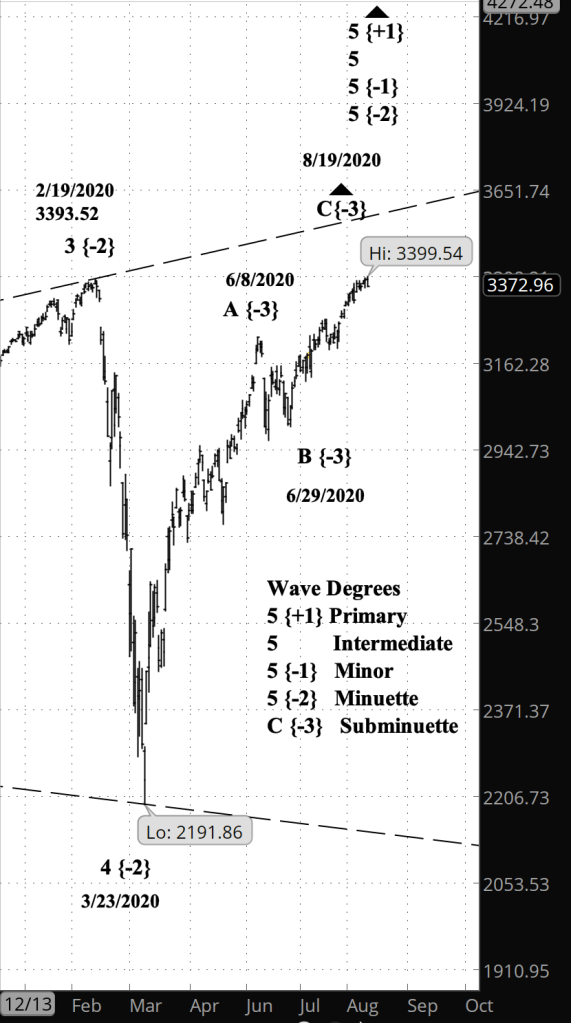
What does Elliott wave theory say? The present wave is Minuette wave C, the final wave up within Minor wave 5 within Intermediate wave 5 within Primary wave 5. Once C is complete, then the whole house of cards collapses into a long-lasting downtrend. Minor wave 5 has taken the form of a Diagonal Triangle, and therefore is likely to reverse before reaching the trend boundary.
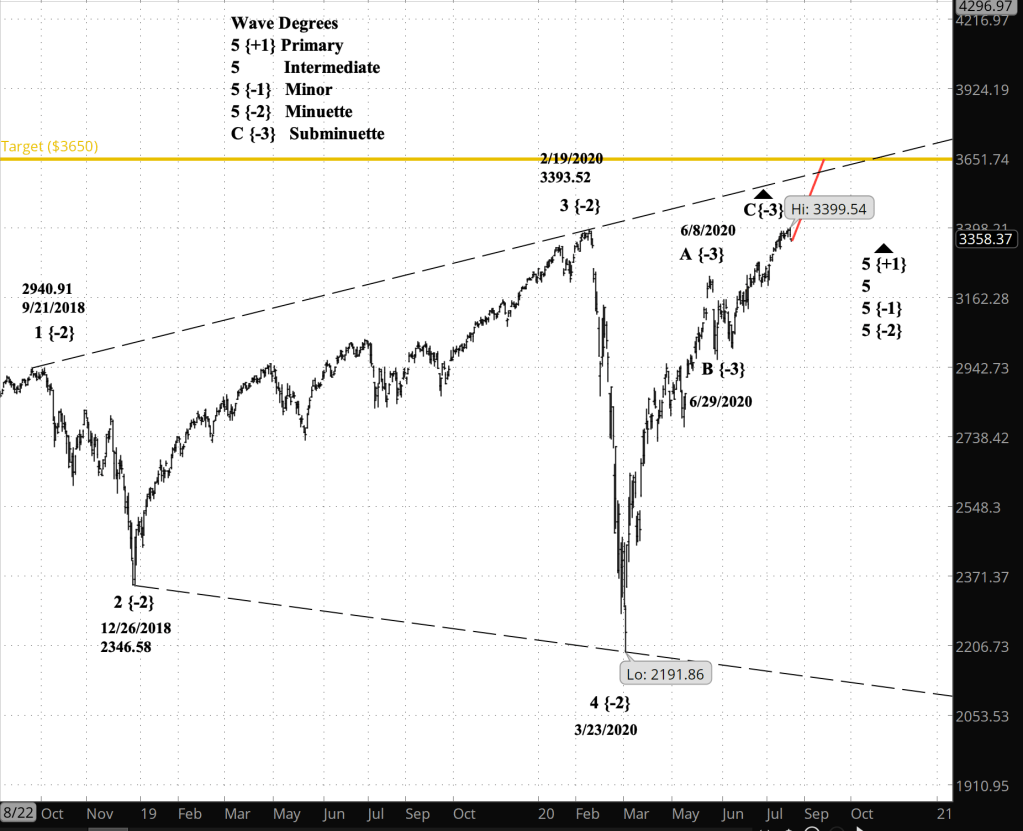
What’s happening now? The S&P 500 index continues its rise toward a trend line boundary that it will approach but likely fail to reach.
What does it mean? The uptrend since March is nearing its end and will soon reverse, beginning a significant downtrend that will eventually fall below 2191.86, the starting point on March 23 of the present rise.
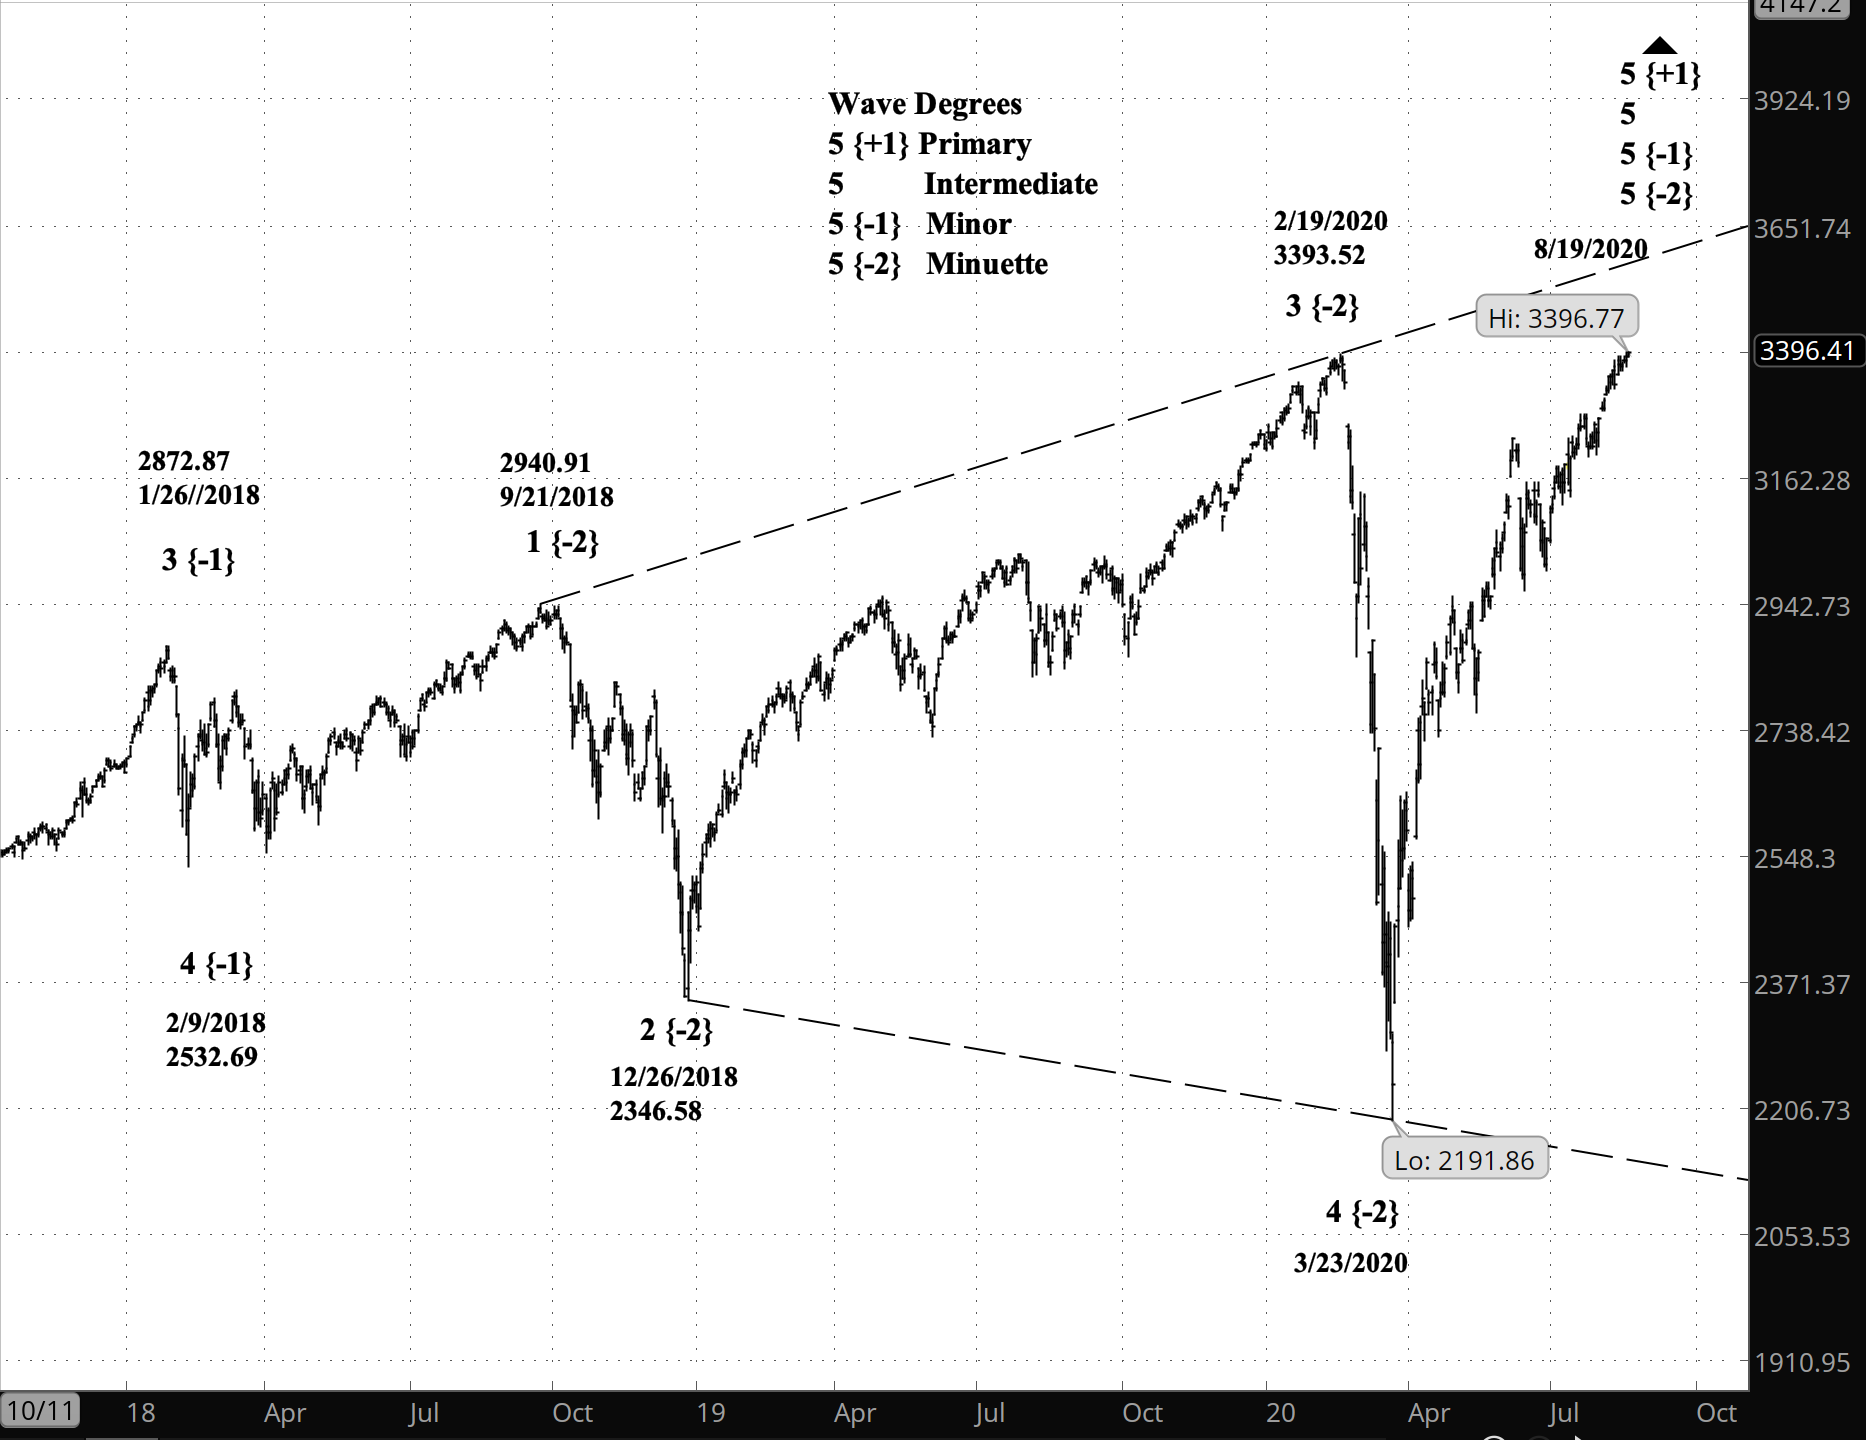
What does Elliott wave theory say? The index is in its final upward movement of Subminuette degree within a Diagonal Triangle of Minuette degree that began in September 2018.
Diagonal Triangles consist of five waves, each broader than its predecessor, each composed of three waves one degree lower. At the Subminuette degree the index is tracing a rising C wave, with a target at the triangle channel’s upper boundary.
The upper boundary of a Diagonal Triangle rises across time. The boundary level today is lower than the boundary level tomorrow.
If, for example, it takes a month for the price to reach the upper level (red line on the chart), then the boundary — the target price — will be at 3650 (gold line on the chart).
Usually, the 5th wave of a Diagonal Triangle approaches but false a bit short of the upper boundary. Also, there are no guarantees that it will take a month for the price to reach the boundary. A month is a reasonable guess.
The Elliott Wave Theory rules governing the triangle’s 5th wave are these: The 5th wave of a diagonal triangle must be longer than the 3rd wave. In this triangle, the 3rd wave ran from 2346.58 in December 2018 to 3393.52 on February 19 of the current year, a distance of 1046.94 points.
The 5th wave began at 2191.86 on March 23, and adding on the distance covered by the 3rd wave, we get a minimum reach for the 5th wave of 3238.80. And it fact it reached that level in mid-July.
The other rule is that the 5th wave must end above the end of the 3rd wave, and it in fact exceeded that level two days ago, on August 18.
What is the alternative? The S&P 500 E-mini futures continue to be out-of-synch with the index, failing to show a clear Diagonal Triangle pattern. The index and the SPY exchange-traded fund both match my principle analysis. The futures don’t.
Under my principle analysis, Cycle wave 1 to the downside will start within months, if not sooner. Under my alternative analysis, Cycle wave 1 began on February 19.
What about my trades? For options, my next window of opportunity are the October monthlies, with an entry window from August 25 through September 8, management of profitable positions on September 21 and expiration on October 16. That should align nicely with the completion of the 5th wave of the triangle. Knock on wood.
For shares, I shall continue to hold my presently losing positions in the expectation that the Cycle wave 5 will return them to profitability.
I’ve done an analysis of the current 5th wave of Minuette degree. We are now in the third, and final, wave of Minor 5: The C wave of Subminuette degree.
10:40 a.m. New York time
What’s happening now? The S&P 500 index rose slightly this morning, reaching a new high of 3395.91.
What does it mean? Each incremental rise lends credence to the conclusion that the previous high, in February, wasn’t the end of the uptrend that began in December 1974. However, the S&P 500 futures remain below the February high, making it impossible to produce a definitive count. For now, I’ll use the index count and treat the E-mini futures count as an alternative.
What does Elliott wave theory say? The S&P 500 index in September 2018 began a diagonal triangle formation, the 5th wave of Intermediate degree within a 5th wave of Primary degree that began in December 1974.
S&P 500 index, daily bars
The decline from February 19 to March 23, coinciding with the beginning of the Covid-19 global pandemic, was the 4th wave of Minuette degree, and its conclusion in March was the beginning of the present Minuette 5th wave that is still underway.
The completion of the Minuette 5th will also be the conclusion of the 5th waves (in ascending order) of Intermediate, Primary and Cycle degrees. A large-scale decline will follow, initially reaching the 2000 level and eventually far below that.
What is the alternative? The fact that the S&P 500 E-mini futures have not yet moved beyond the February high leaves open the possibility that Primary wave 5 ended in February and that the large-scale decline is already underway. If the futures move above their high of February 19, then the discrepancy will be resolved.
Under this count, the futures are nearing the end of Primary wave 2, with a significant Primary 3 decline to follow.
What about my trades? Both the principle count and the alternative count anticipate a large decline soon. I’ll continue to hold my bear shares in SDS, which moves the opposite of the S&P 500 index, and stay out of options until Primary 5 under the principle count is complete.
I’ve done an analysis of the current 5th wave of Minuette degree. We are now in the third, and final, wave of Minor 5: The C wave of Subminuette degree.
10:40 a.m. New York time
What’s happening now? The S&P 500 index rose slightly this morning, reaching a new high of 3395.91.
What does it mean? Each incremental rise lends credence to the conclusion that the previous high, in February, wasn’t the end of the uptrend that began in December 1974. However, the S&P 500 futures remain below the February high, making it impossible to produce a definitive count. For now, I’ll use the index count and treat the E-mini futures count as an alternative.
What does Elliott wave theory say? The S&P 500 index in September 2018 began a diagonal triangle formation, the 5th wave of Intermediate degree within a 5th wave of Primary degree that began in December 1974.
S&P 500 index, daily bars
The decline from February 19 to March 23, coinciding with the beginning of the Covid-19 global pandemic, was the 4th wave of Minuette degree, and its conclusion in March was the beginning of the present Minuette 5th wave that is still underway.
The completion of the Minuette 5th will also be the conclusion of the 5th waves (in ascending order) of Intermediate, Primary and Cycle degrees. A large-scale decline will follow, initially reaching the 2000 level and eventually far below that.
What is the alternative? The fact that the S&P 500 E-mini futures have not yet moved beyond the February high leaves open the possibility that Primary wave 5 ended in February and that the large-scale decline is already underway. If the futures move above their high of February 19, then the discrepancy will be resolved.
Under this count, the futures are nearing the end of Primary wave 2, with a significant Primary 3 decline to follow.
What about my trades? Both the principle count and the alternative count anticipate a large decline soon. I’ll continue to hold my bear shares in SDS, which moves the opposite of the S&P 500 index, and stay out of options until Primary 5 under the principle count is complete.
I’ve saved the blockbuster ending for the last, with a chart. But first, let’s see how we got there.
Here’s what the experts have said about the the Elliott Wave Principle’s Wave 2 rule.
“Wave two rarely cancels all of the ground gained by wave one.” –R.N. Elliott, The Wave Principle (1938)
“Wave 2 never moves beyond the start of wave 1.” –Robert Prechter and Alfred J. Frost (2005 edition)
“Wave 2 can never retrace more than 100% of wave 1.” –Wayne Gorman and Jeffrey Kennedy (2013)
And yet, on Tuesday, August 18, 2020, at 9:48 a.m. New York time, Primary wave 2 of the S&P 500 index, a upward correction within a descending Cycle wave 1, broke the rule, rising above the start of Primary wave 1 — 3393.52 — by 1.54 points.
Perhaps it is a fitting footnote to the 20th year of the 3rd Millennium, an era when broken rules, like promises, littered the social and economic landscape of our lives.
And later in the day, at 2:56 p.m. New York time, as if to thumb its imaginary nose at the norms of Elliott wave analysis, wave 2 did it again, breaking to 3393.81 before reversing back below.
It was soon joined by the most heavily traded member of the family: SPY, an exchange-traded fund tracking the S&P 500. It moved above the start of Primary wave 1 on Tuesday at 3:15 p.m. New York time.
The third major member of the family, the S&P 500 E-mini futures, reached the closing bell while remaining below the beginning of Primary wave 1. The futures trade all night, providing an opportunity for European and Asian traders to have their say.
As I discussed in July, in my post “A Funny Thing Happened“, the S&P 500 is an extended family, although a bit dysfunctional at this point, at least from an Elliott wave standpoint.
The authors of the quotes above have credibility.
R.N. Elliott was the developer of the wave-counting method that bears his name: The Elliott Wave Principle.
Robert Prechter and the late A.J. Frost wrote an updated description of the method in 1978, and it has since gone through many editions, with Prechter as the modern face of Elliott wave analysis.
Wayne Gorman and Jeffrey Kennedy are both analysts at Elliott Wave International, the analysis company Prechter started in Gainesville, Georgia.
They are all expert at Elliott wave analysis, and when they say it’s a rule, I believe them.
Yet, there is that small matter of reality. The index reflects the market second-hand, through the trades of the symbols that make up the index. The futures and the exchange-traded fund SPY trade separately, in their own right. They are managed so as to track the S&P 500, but no system is perfect.
Years ago, when Prechter’s Elliott Wave International was taking questions from subscribers, I asked about discrepancies between the index and the exchange-traded fund. I was told that each analysis applies to the vehicle it is analyzing, without reference to anything else.
Yet, it seems monstrous for three closely related products to diverge for any length of time. My rule in July was that I needed unanimity among the three major vehicles of the S&P 500 family: Index, futures and the ETF.
The difference, I think, comes down to the basic nature of the vehicles.
The E-mini futures contracts represent an expectation of future prices. The index represents the current prices of the underlying stocks.
The exchange-traded fund, SPY, buys and sells shares of the underlying stocks in order to track the index. It’s a process, and so there can be times when the tracking isn’t perfect.
Moreover, the Dow Jones Industrial Average index, which tracks the same blue-chip segment of the markets as the S&P 500 does, remains well below the beginning of Primary wave 1 to the downside. A serious divergence between the Dow and S&P 500 is unthinkable.
So where does this leave us?
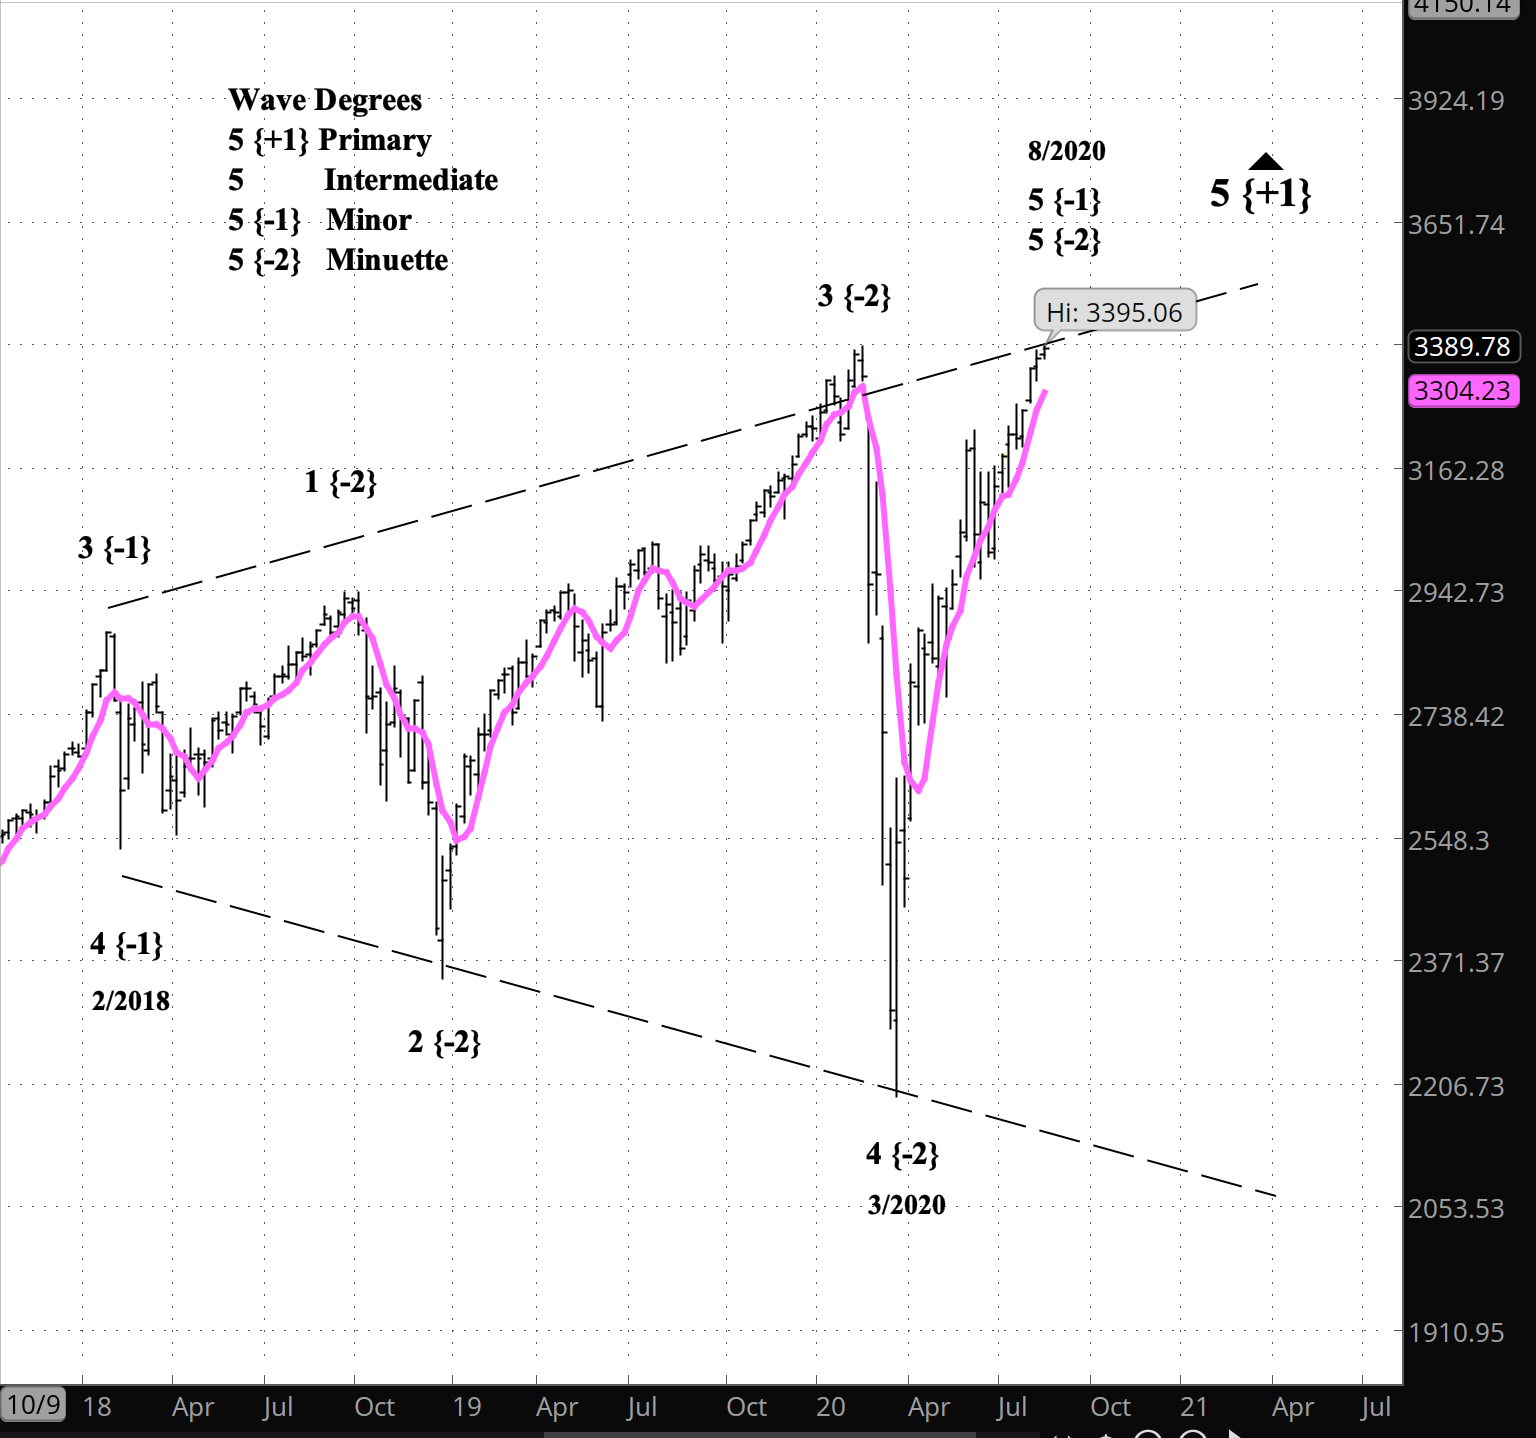
Accepting for a moment the application of the Wave 2 Rule to today’s S&P 500, then the decline from February into March must have been a downward correction to the Primary wave 5 uptrend. I count the index as being within Intermediate wave 5 to the upside, and what happened since February as a 5th wave, probably the final wave of Primary wave 5, in the form of a diagonal triangle. I’ve added a six-week moving average in garish purple as a smoothing device to better see the waves.
S&P 500 index, weekly bars
If this is in fact a correct count of the chart, then the S&P 500 is on the final wave of the triangle, and once that is complete, Primary wave 5 to the upside will be over and the price will drop sharply as Primary wave 1 to the downside begins, not in February as the leading Elliotticians thought, but in August, or maybe September.
The proof of the count, as always, will rely on what the price does next.
As of Tuesday’s closing bell, we don’t have unanimity among all three major members of the S&P 500 family. So, although my prior principle count is no longer valid, neither is the alternate count. We’re left in suspense at “Too close to call”.
Although, I don’t see much that can disprove the message of the count, which is that the downtrend will begin anew in the near future.
If the price continues to rise, then it’s a continuation of the last leg of the triangle, which, at its end, will usher in a major decline. The Wave 2 Rule remains intact.
If the price falls sharply, then February was the end of Primary wave 5, Primary wave 3 to the downside has begun and the Wave 2 Rule needs a caveat.
Either way, it’s seems to me to be a solid expectation that the rise from 1974 is almost over.
And back to the quotes: Elliott did include a caveat in his statement of the Wave 2 Rule. He said “rarely” — “”Wave two rarely cancels all of the ground gained by wave one.” So maybe the principle count since February is still intact, and this is one of those rare occasions when the wave 2 price bumped above the start of wave 1.
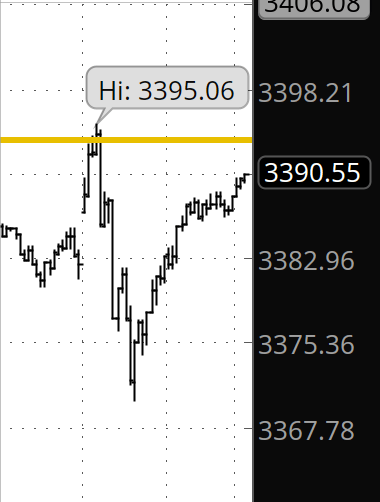
The S&P 500 index has broken above its February 19 high of 3393.52, by 1.54 points, to 3395.06. It quickly pulled back.
S&P 500 index, 5-minute bars
In Elliott wave analysis, the 2nd wave of Primary degree has broken above the 1st wave of Primary degree. Under R.N. Elliott’s rules, if a 2nd wave breaks beyond the start of the preceding 1st wave of the same degree, it’s not a 2nd wave.
As of this writing, the S&P 500 E-mini futures have not broken above the February high, and neither has the exchange-traded fund SPY, which tracks the index.
Here are the numbers:
vehicle
primary 1 start
primary 2 high
breakout
index
3393.52
3395.06
1.54
futures
3397.50
3390
-7.50
etf
339.08
339.07
-0.01
Things were simple when R.N. Elliott was formulating his system of analysis. Charts were daily, nothing shorter. There were no index futures or exchange-traded funds. He analyzed the Dow Jones Industrial Average. It was the major index of his time, and there were no index futures or exchange-traded funds.
Last July I described my rule for analyzing an Elliott wave event when there is a disagreement between S&P 500 vehicles, in my post “A Funny Thing Happened“. And under that rule, the event must be unanimous. In this case, the index, futures and the exchanged-traded fund SPY must all three participate in the Elliott wave event. Otherwise, it’s too close to call.
So I’m in wait-and-see mode.
10:30 a.m. New York time
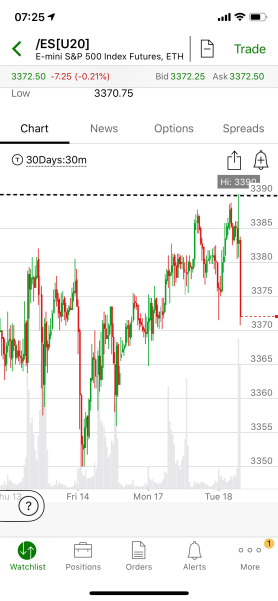
What’s happening now? The S&P 500 E-mini futures quickly ran up to a new high of 3390 at the opening bell today, 7.50 points below the start of the February crash. In the second half hour of trading it declined sharply to just above the 3370 level.
What does it mean? If it’s correct that a major downtrend began in February, and the rise since March has been correction within that downtrend, then there’s very little upside left. The start of the downtrend in February, from 3397.50, sets a ceiling on the correction. If the price bursts through that ceiling, then the February crash, rather than beginning a downtrend, was in fact a correction within an uptrend that began in 1974.
S&P 500 E-mini futures, 30-minute bars
What does Elliott wave theory say? Primary wave 2, the upward correction within a Cycle wave 1 downtrend, is in its final movement — Intermediate wave C. The Minor waves within Intermediate C have completed the five-wave set.
What is the alternative? The caveat that goes with any declaration that a five-wave set is complete goes like this: Unless there’s a new high. In that case, then the Minor waves’ count gets a make-over.
The three Intermediate wave rise from June 15 began at 2923.75, and a drop below that level suggests that Primary wave 3 is indeed underway. Primary wave 2 began on March 22 at 2174, and a drop below that level means that the start of Primary wave 3 is a certainty.
What about my trades? I’m looking for Intermediate wave 3 within Primary wave 3 as my preferred trading point.
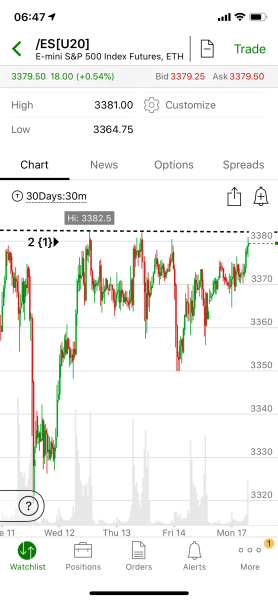
About the chart. The chart is from my iPhone, since TDAmeritrade’s ThinkOrSwim app for laptops and desktops is, for the second day in a row, not working. See Downdetector to track the problem.
What’s happening now? The S&P 500 E-mini futures with this session’s high so far, 3381, having reached a level 1.5 points below the August 11 peak, 3382.50.
What does it mean? The price remains below the upper boundary of the price channel, keeping the interpretation that August 11 was the end of the uptrending correction that began in March and the beginning of the next leg down of a major downtrend that began in February.
S&P 500 E-mini futures, 30-minute bars
What does Elliott wave theory say? The August 11 peak by my count was the end of Primary wave 2. The subsequent three days have been the early, low degree stages of Primary wave 3, which will carry the price 1,000 points or more to the downside.
What is the alternative? The net sideways movement of the last three days could be interpreted as Intermediate wave 4 within Primary 2, meaning that the upward correction may a bit further to go before it’s over. The tip-off will be the price exceeding the August 11 peak, 3382.50
What about my trades? Holding my bear shares, delaying any options trades until Minor wave 3 within Primary wave 3.
(TDAmeritrade’s ThinkOrSwim app on my MacBook won’t launch for some reason, so the chart, from my iPhone, looks a bit different than usual.)
What’s happening now? As the week draws to a close, the S&P 500 E-mini futures continue to bounce along the upper boundary of the price channel since February.
What does it mean? This morning was the fourth charge at the resistance level, and like the three before it, the price failed to break through. Each failed attempt strengthens the analysis that the rise since March is complete.
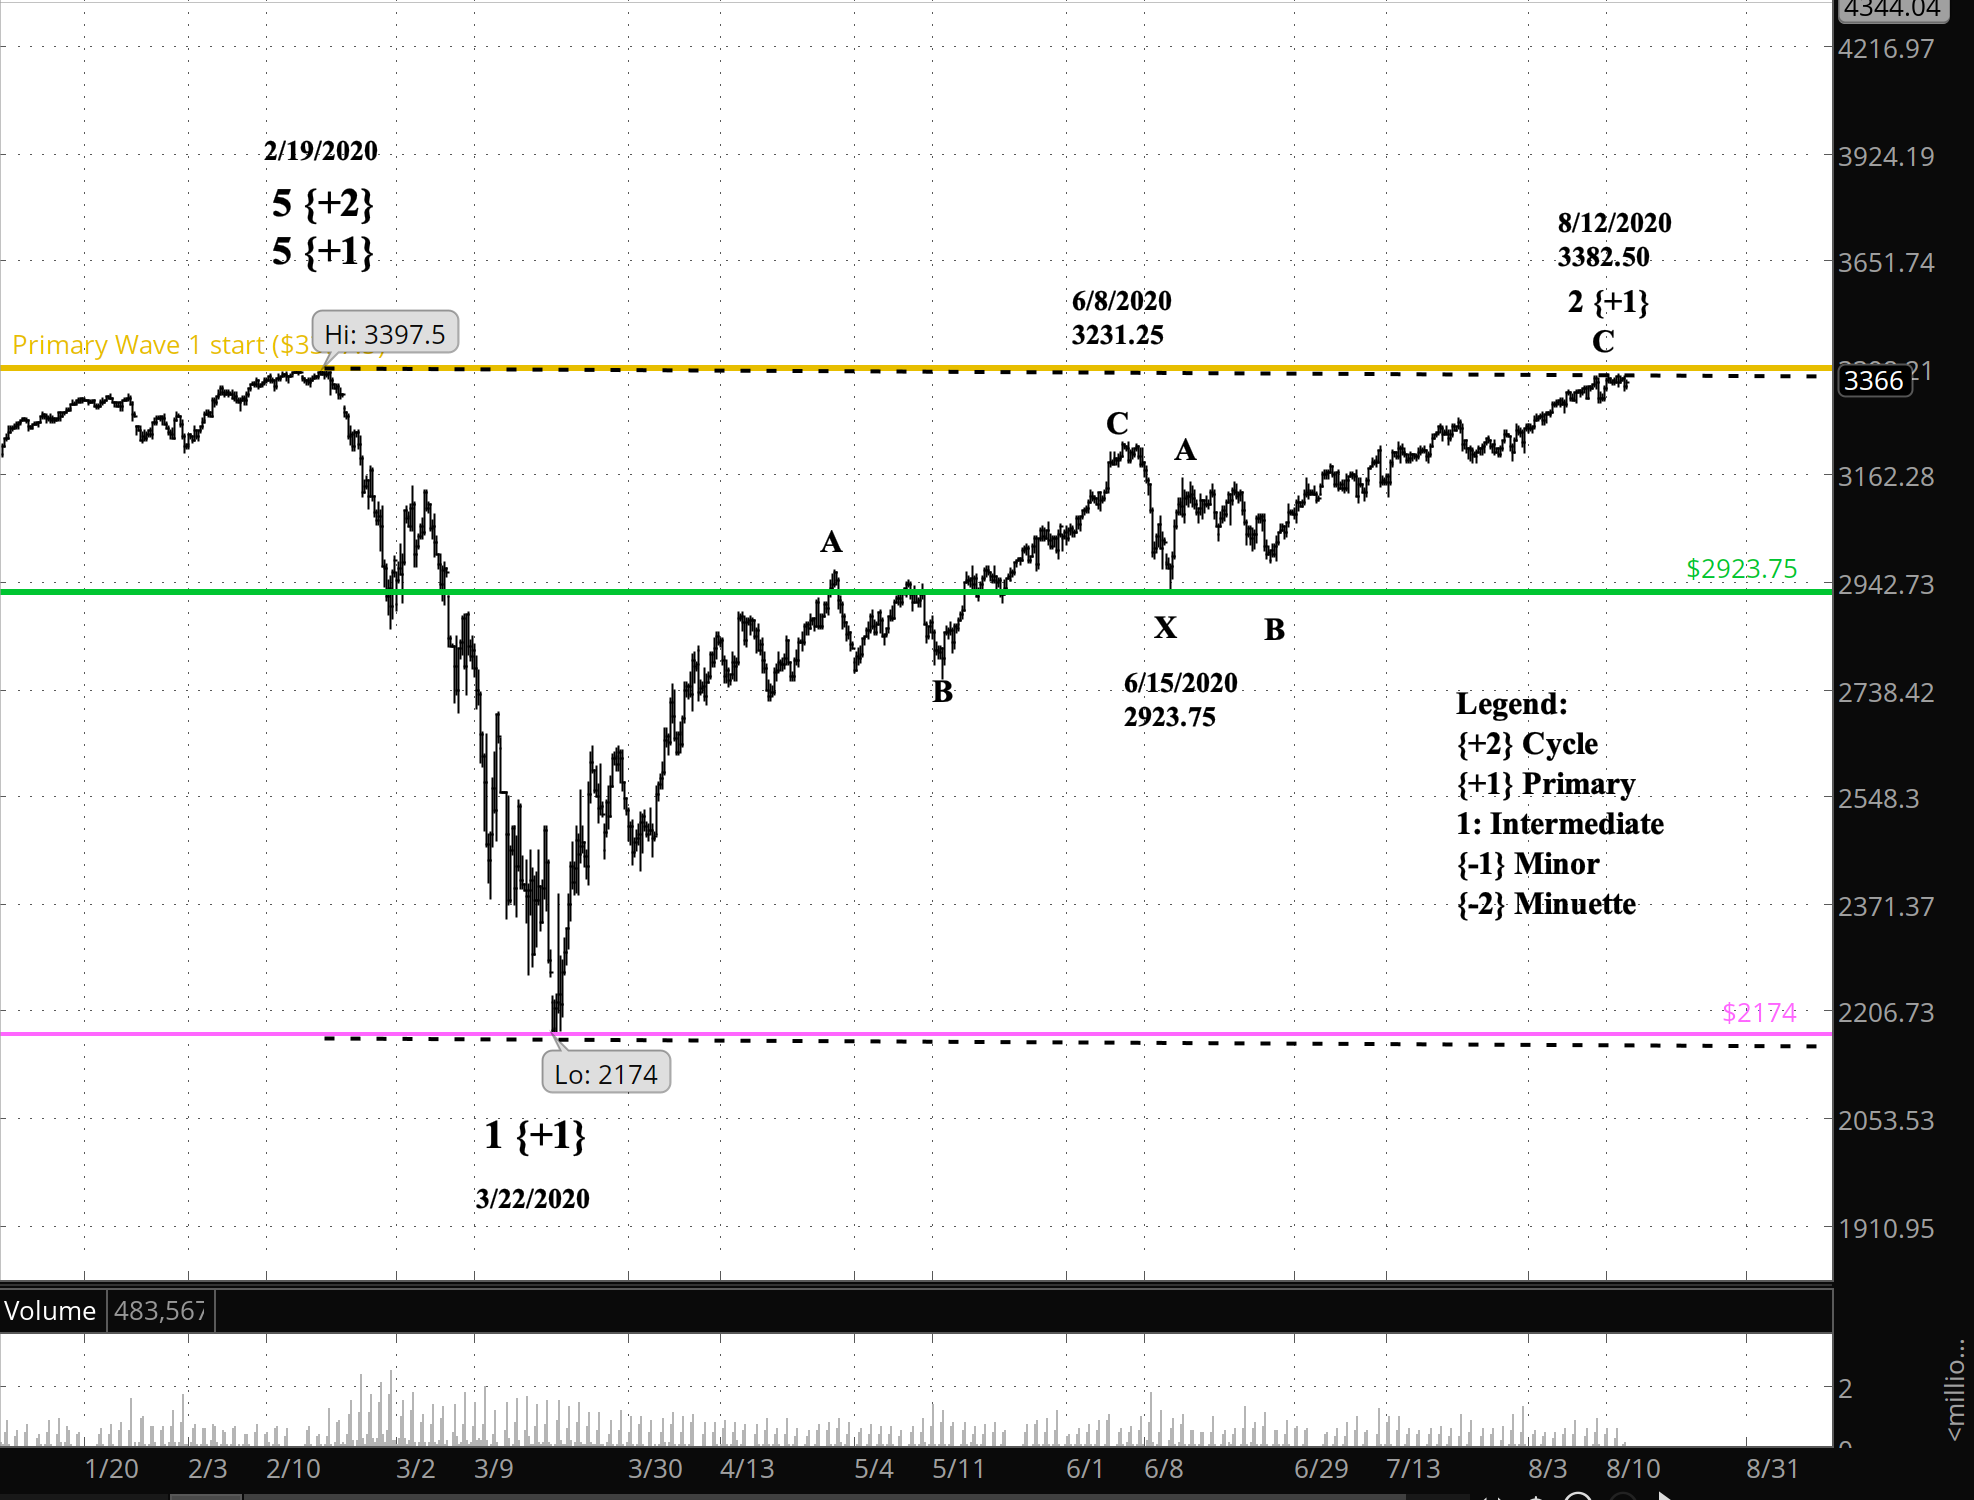
What does Elliott wave theory say? By my analysis, the S&P 500 peak on August 12 at 3382.50 is the end of Primary wave 2 to the upside, which began on March 22 at 2174. Primary 2 internally was divided into two Zigzag of three waves apiece, separated by an X wave.
S&P 500 E-mini futures, 5-hour bars
At the Intermediate degree, one down from Primary, it will take a drop below the X wave terminus, at 2923.75 (green line) to reach a significant finding that the Primary wave 3 decline is truly underway. A drop below the beginning of Primary wave 2, at 2174 (purple line) would confirm that Primary wave 3 has begun. My target for Primary 3 is the lower boundary of the price channel, below 2150 and perhaps significantly below.
Primary wave 3 will play out in this manner: A tentative Intermediate wave 1 to the downside, an Intermediate wave 2 that likely will carry the price back to near its present level, and then a powerful Intermediate wave 3 push to the downside.
What is the alternative? As long as the price is bouncing along the upper boundary of the price channel, then there’s a chance that it will exceed the August 12 peak, and that high would become the new endpoint of Primary wave 2. Moreover, if the price exceeds the beginning of Primary wave 1 on February 19, at 3395.70 (gold line), then the decline that began on that date is a continuation of Primary wave 5, which began in December 1974.
What about my trades? I’ve completed my additional purchases of shares of SDS, an exchange-traded fund based on the S&P 500, except it moves in the opposite direction. So they’re a bear play. No options trading planned yet. I’m looking to catch Intermediate wave 3 within Primary wave 3 for my bear call options spreads trades.


You must be logged in to post a comment.