10:05 a.m. New York time
SPY has opened within yesterday’s range, below the peak, a movement so small as to lead to no conclusions whatsoever. I anticipate no trades today.
By Tim Bovee, Portland, Oregon, Aug. 30, 2018
10:05 a.m. New York time
SPY has opened within yesterday’s range, below the peak, a movement so small as to lead to no conclusions whatsoever. I anticipate no trades today.
By Tim Bovee, Portland, Oregon, Aug. 30, 2018
9:50 a.m. New York time
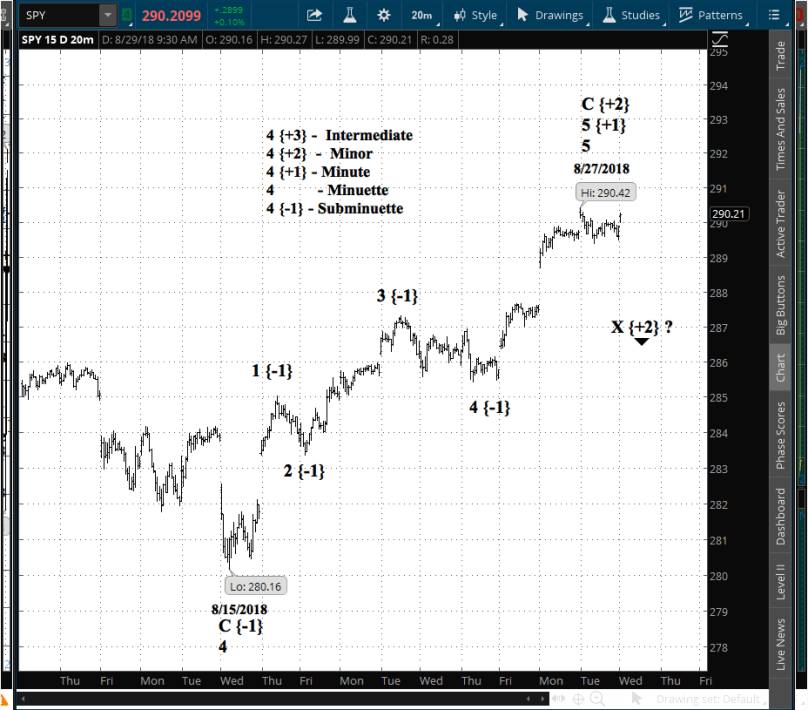
I’ve brought my Elliott wave analysis down to a shorter-term level in an attempt to judge how far the present rise has progressed. There are often ambiguities in a wave count, so this is one of several ways of assessing the rise. It shows that wave C in the Minor degree {+2} was completed on Aug. 27 by wave 5 of the Minute degree {+1}, or nearly so.
It’s also possible to count the peak I have labelled 3 {-1} as 1 {-1}, in the Subminuette degree. If that turns out to be the case, then what I have labelled as wave 5 of the Minuette degree is in fact wave 3 of that degree, and the C wave of the Minor degree {+2} still has a ways to go.
In either case, I see no opportunity to trade back in to SPY today, and so I shall wait for the ambiguities to resolve themselves. That will take a decline off of the Aug. 27 peak, perhaps a sharp one with a gap to signal that the trend has changed.
By Tim Bovee, Portland, Oregon, Aug. 29, 2018
10:15 a.m. New York time
The rise in SPY continues for a third day. My Elliott wave analysis posted yesterday continues to stand, and I anticipate no trades today.
At this point it’s a waiting game. The next trading opportunity by my analysis will be when the rising trend reverses, setting up an X wave to the downside in the Minor degree {+2}.
By Tim Bovee, Portland, Oregon, Aug. 28, 2018
11:35 a.m. New York time
SPY broke above the peak of the bull market, which ended on Jan. 26 — an event that intuitively is filled with paradox. The damage to my Elliott wave analysis, however, is far less than might be imaged.
The SPY chart covers the past year with daily bars.
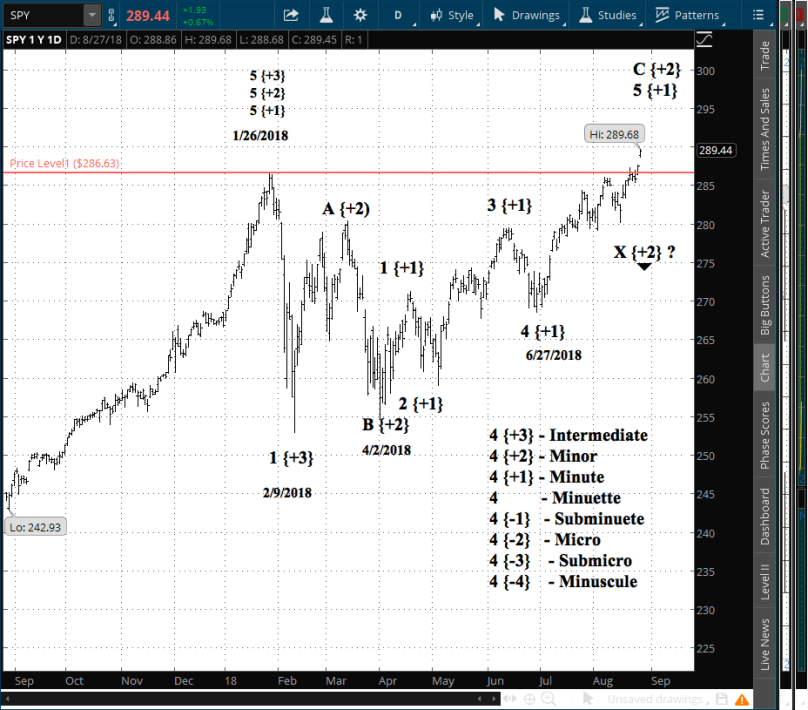
The paradox is how can a price within a bear market be higher than the start of the bear market. A bear market peak means the highest point, and there is no higher than highest.
Except in Elliott, where the form of things always takes precedence over our intuition. Here’s how I see it:
All is fine with the chart from the Minor degree {+3} on down. It is at the Intermediate degree {+3+} where the potential rule violation has occurred.
The peak of the present counter-trend corrective wave would be the 2nd wave of Minor degree {+3}. Elliott has a firm rule that a 2nd wave cannot move beyond the start of the 1st wave of the same degree. Full stop. No appeal. That’s the rule.
So that peak cannot be the end of the 2nd wave Minor degree correction to the upside, to be followed by a 1st wave down of Minor degree {+2} as the first wave of the 3rd wave down of Intermediate degree {+3}. That disallowed count is the most straightforward in my mind, but the markets are often less than straightforward in their course.
The alternative is to label the next wave down, once the Minor C wave is complete, as the 1st wave of Minute degree {+1} within an X wave of Minor degree {+2}.
I referred to that possibility in my analysis of Aug. 23 (although the degree labeling has since changed).
So, bottom line: My bear market analysis remains intact. The coming X wave may be tradable. Although not the beginning of a 3rd wave down, which would certainly carry to significant bear-market lows, it is of a sufficiently high degree to produce a decline that fits in with my goal of trades having lifespans of 30 days to 45 days.
By Tim Bovee, Portland, Oregon, Aug. 27, 2018

Traders get a second look at 2nd quarter gross domestic product on Wednesday at 8:30 a.m. New York time. Perhaps of greater importance in this era of Fed tightening of available credit, the report will include the GDP price index, a deflator used in the reporting that the Federal Open Market Committee uses in preference to the more widely known Consumer price index.
As go prices, so goes the Fed, as goes the Fed, so goes the economy, your job, your paycheck and your family’s ability to eat out this Friday and take a great vacation next summer. High stakes indeed.
Also out during the week, international trade in goods on Tuesday and personal income and outlays on Thursday, each at 8:30 a.m.
10:35 a.m. New York time
SPY is continuing within its range of the three prior days. I have no change in my assessment of the chart and anticipate no trades today.
By Tim Bovee, Portland, Oregon, Aug. 24, 2018

11:05 a.m. New York time
Chart analysis is much like the old-time serial films they used to show in movie theaters, where each episode ended with a cliff-hanger, and the kids had to shell out their nickels again to see what happened.
Having revised my longer-term Elliott Wave analysis of the SPY chart from the Jan. 26 beginning of the bear market, I took a deeper dive into components of the uptrending 4th wave of Minute degree {+1}, which began June 27.
The SPY chart covers 90 days with hourly bars.
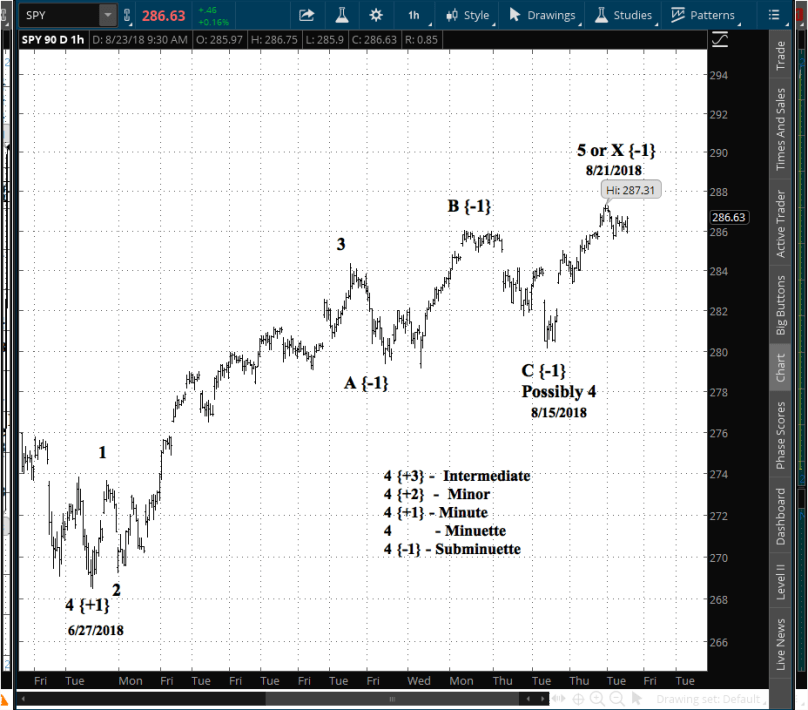
The interesting part is the leg up beginning Aug. 15, a movement that has much ambiguity. A straightforward count shows the C wave down of the Subminuette degree {-1} ended on Aug. 15.
If that wraps up the countertrend correction then that is also the end of the 4th wave and we are now pushing upward on the 5th and final wave of the C wave of Minute degree that began in April. (See the chart posted yesterday.)
However, the subsequent upward move could also prove to be the separating wave of a complex correction, with several zig-zags or flats or other corrective patterns linked to together. In Elliott, the separating waves are labeled X, and in this case it would be an X wave of Subminuette degree.
If the upward move from Aug. 15 is a 5th wave, then it will mean continued upward movement to a greater or lesser extent, followed by a significant down move, wave 3 of the Intermediate degree {+3}.
If the upward move is an X wave, then it has likely completed most its rise, and what follows will be a downward move, but not a major one, with a lower boundary on SPY in the $270s or so.
Bottom line: We don’t know which it will be. It’s a cliffhanger. We’ll need to pony up our nickels to see the next episode.
By Tim Bovee, Portland, Oregon, Aug. 23, 2018
11::10 a.m. New York time
I have re-worked my Elliott Wave analysis of the SPY chart to take of the issue that arose a couple of days ago, as described in the Live post of Aug. 21.
The SPY chart below covers one year with daily bars.
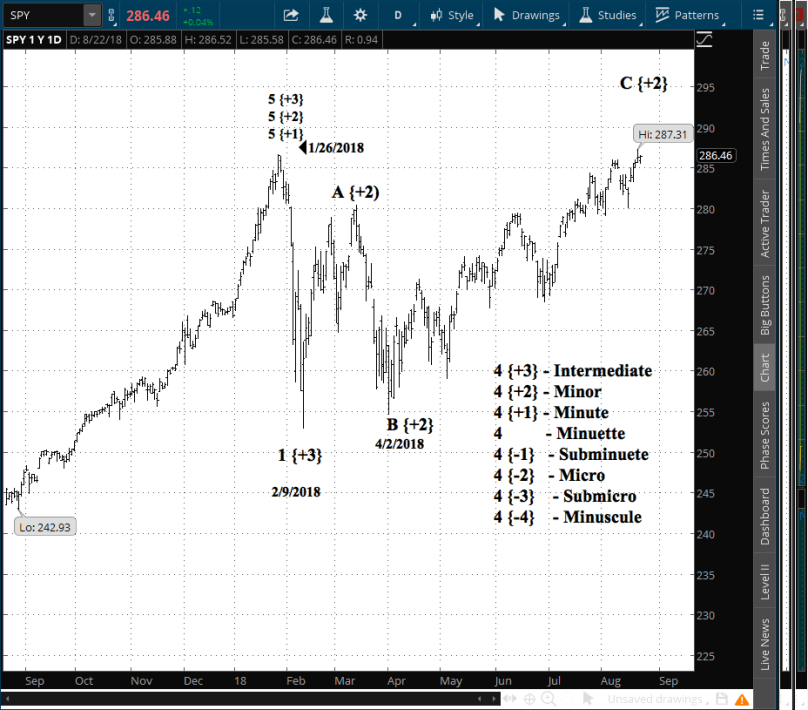
The difficulty came because I had counted the corrected since the bear market began on Jan. 26 as being a Zig-Zag — a directional correction with a 5-wave, 3-wave, 5-wave pattern. As it turns out out, the correction now analyzes as a Flat — a sieways correction — with a 3-wave, 3-wave, 5-wave pattern.
In my experience 2nd wave corrections, like this one, tend to be Zig-Zags. But it’s not a rule, and this one is marching to the beat of its own drummer.
Even so, my conclusion that the C wave is near an end remains intact. Also, my decision to exit yesterday is supported by the new wave count; the C wave may be nearing an end, but it could still have a good distance to go.
Or not. There’s no way to say.
I anticipate no trades today.
By Tim Bovee, Portland, Oregon, Aug. 22, 2018
11:25 a.m. New York time
I have updated SPY with results.
10::10 a.m. New York time
SPY rose this morning, moving higher than the Aug. 7 high, which was the starting point of wave 1. Under the rules of Elliott Wave analysis, a 2nd wave cannot move beyond the base of the 1st wave of identical degree.
The SPY chart covers 15 days with 10-minute bars.
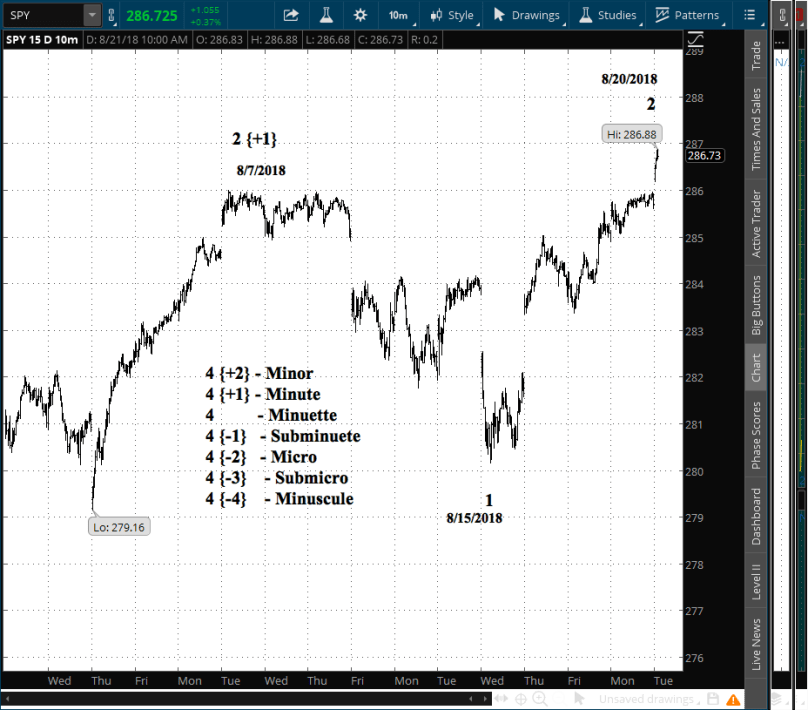
I have exited my position, since the rationale for entry no longer hold, and shall rework the analysis with an eye to determining a new re-entry..
By Tim Bovee, Portland, Oregon, Aug. 21, 2018
Update 8/21/2018: I exited my SPY position a day after entering. The price moved up, my position was based on the hypothesis that the price would move down, and there was no longer any justification for holding.
In the process of rising, SPY on my chart violated a firm rule in Elliott wave analysis: A 2nd wave can’t move beyond the start of the preceding 1st wave of the same degree. The move carried SPY above the Aug. 7 high, which is where wave 1 began.
The SPY chart covers 15 days with 10-minute bars. I’ve marked the Aug. 7 high with a red line.
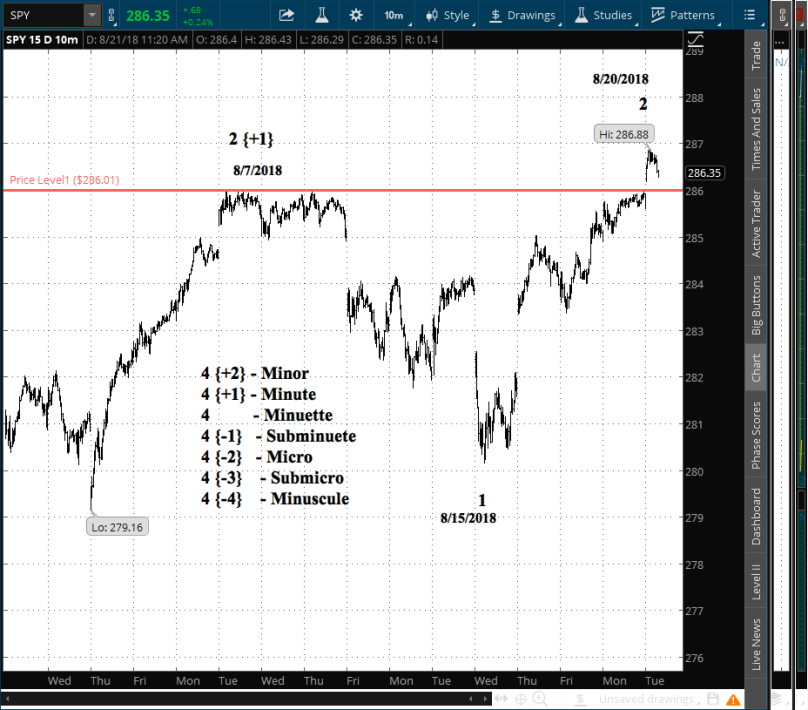
Elliott wave analysis operates like the scientific method: Conclusions are valid for the information available at that time, but new data can invalidate the analysis. That’s what happened here.
That characteristic is one reason I use Elliott in my trading. Unlike other other methods, which provide absolute answers, Elliott explicitly recognizes the limits of what we know and sends us back to form new hypotheses to account for new information.
I exited for a $4.54 debit, a 30-cent loss excluding fees, with shares at $286.78, up 99 cents from entry.
Shares rose by 0.4% over one day for a +126% annual rate. The options position produced a 6.6% loss for a -2,412% annual rate.
I have entered a short vertical spread on SPY, using options that trade for the last time 88 days hence, on Nov. 16. The premium is a $4.24 credit and the stock at the time of entry was priced at $285.79.
I made the decision to enter the trade in my account based on my Elliott wave analysis of the chart. I show SPY completing a corrective wave to the upside, with two possibilities going forward: Resumption of the downward trend or a downwave within the upward countertrend corrective wave.


You must be logged in to post a comment.