Trader’s Notebook

3:30 p.m. New York time

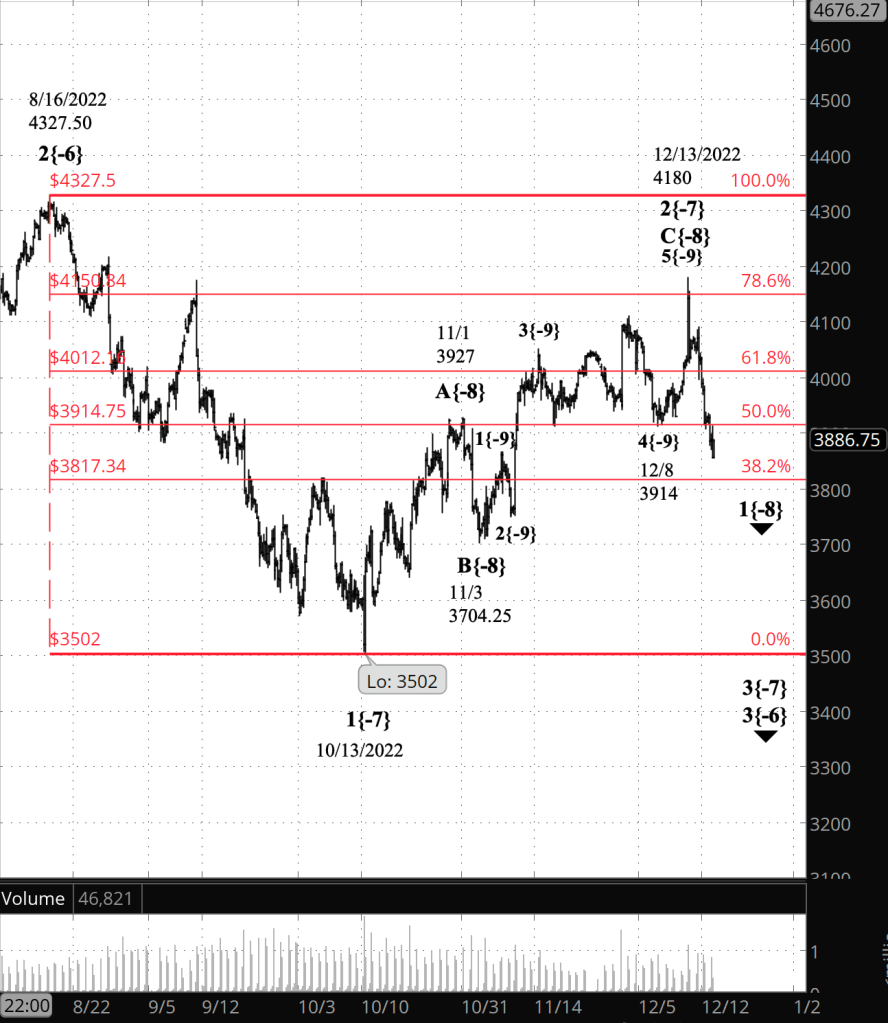
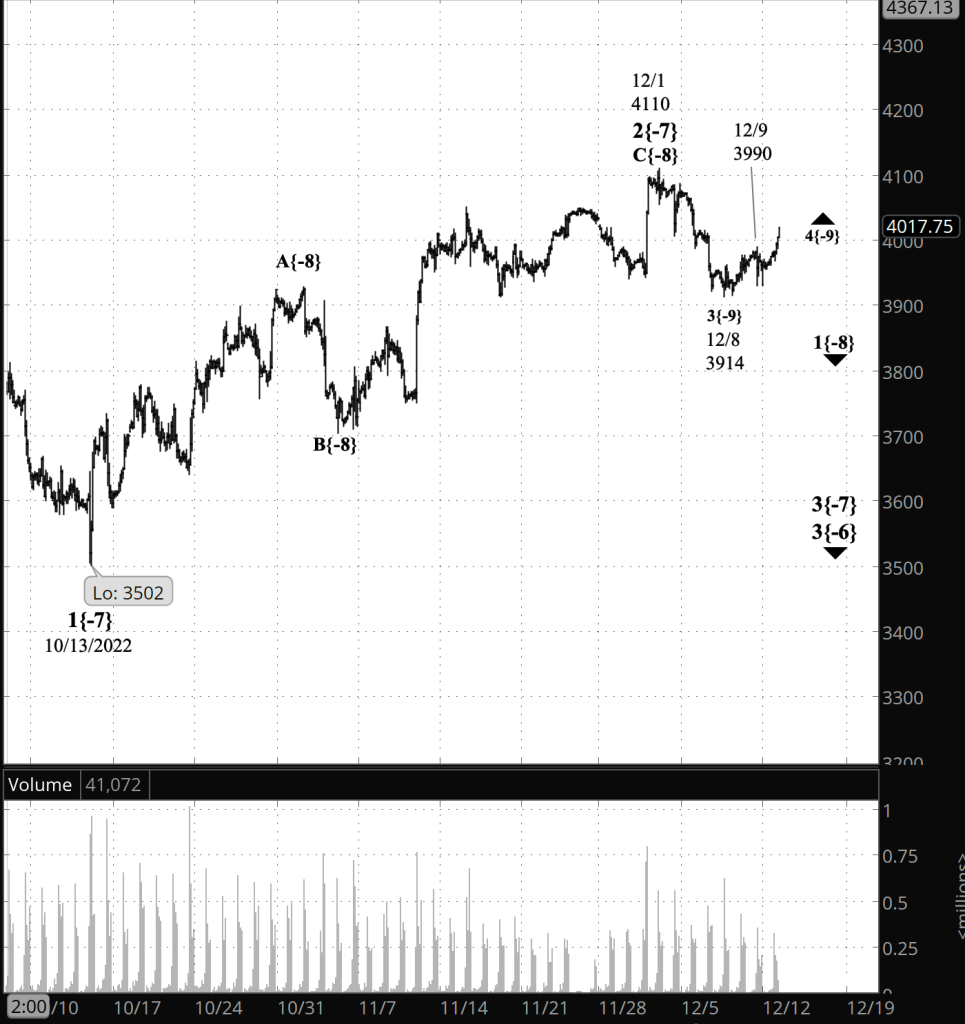
Half an hour before the closing bell. The S&P 500 continued to fall during the session, reaching below Friday’s low, 3855.25, into the 3820s. No change in the analysis. I’ve updated the chart.

10:35 a.m. New York time

SPY bear play entry. I’ve entered a short bear call vertical spread on SPY, using options that trade for the last time on January 20 last year, and have posted a full analysis of the trade.

9:55 a.m. New York time

DRI earnings play exit. DRI beat earnings and yet the price fell, contrary to the direction of my trade. I exited my short bull put options spread after holding the position over the weekend, for a small loss. I’ve updated the trade analysis with full results.

9:35 a.m. New York time

What’s happening now? The S&P 500 E-mini futures rose slightly in overnight trading, remaining above Friday’s low, 3855.25.

What does it mean? The downtrend that began on December 13 continues and internally is in its first of five segments. The overnight rise is a small upward correction within that first segment.

What are the alternatives? There are two.

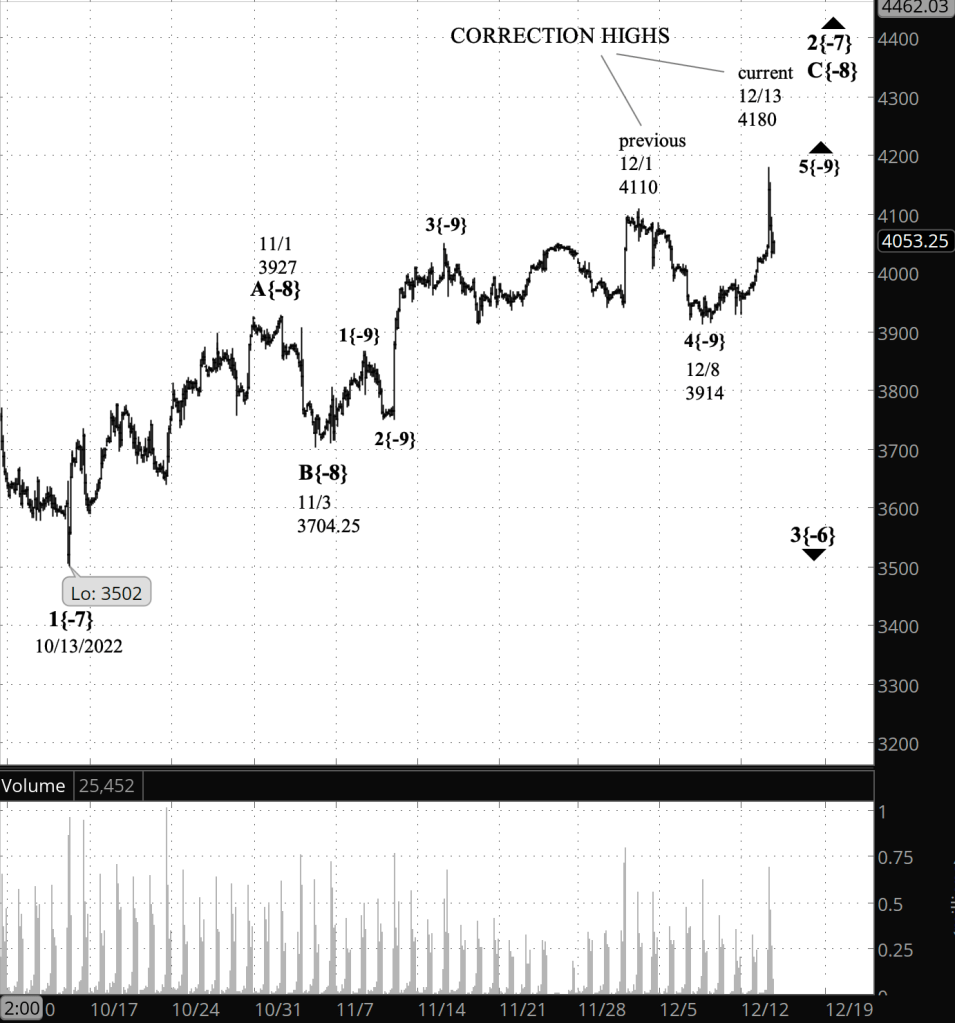
Alternative #1: The upward correction that began on October 13 from 3502 is still underway and the downtrend has not yet begun. The decline that began on December 13 is the second segment within the third and final of the upward correction. This scenario will remain a possibility as long as the wave remains above 3704.25, the starting point of the correction’s final segment, which began on November 3.

Alternative #2: The upward correction is forming a compound structure that will contain two or three corrective patterns. The first pattern, a Zigzag, ended on December 13. The decline that followed is a segment connecting the now complete first corrective pattern with a future second corrective pattern. This possibility won’t be eliminated until the price drops below 3502, the starting point of the upward correction.

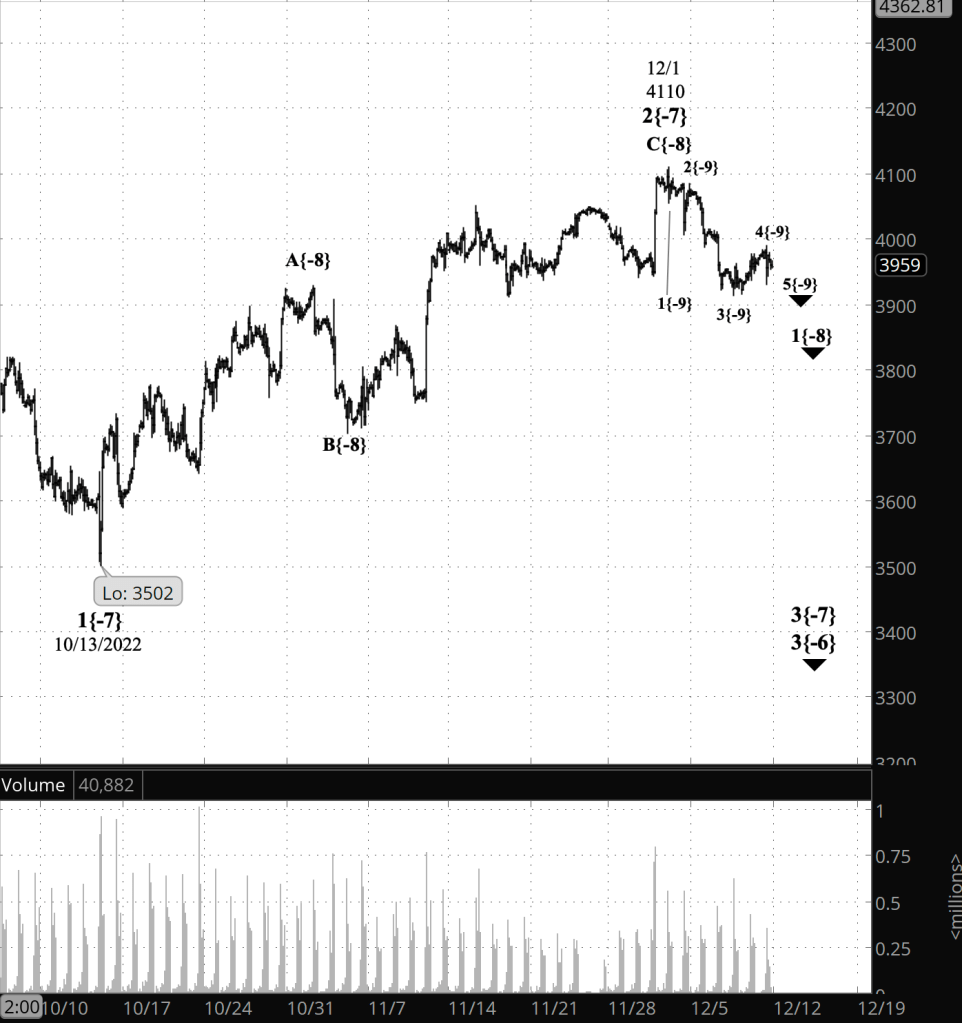
Chart notes. I’ve broadened the chart to include all of the downtrend that began on August 16, the parent trend within which the principal analysis and the two alternatives are happening.

The broader view serves two purposes:

  • It makes it clear that the decline from December 13, which looks massive on a chart focused on the end of the correction and the decline followed, is really fairly small in the general scheme of things. Reading a stock chart is in part about understanding the relative proportions.
  • It provides complete understanding of the timespans that govern my trading. I’m not a day trader, but I’m also not a long-term buy and hold trader. My time horizon is less than a year, often a couple of months or, sometimes, a couple of days. This chart breadth helps me understand the context in which I trade.

[S&P 500 E-mini futures at 3:30 p.m., 345-minute bars, with volume]

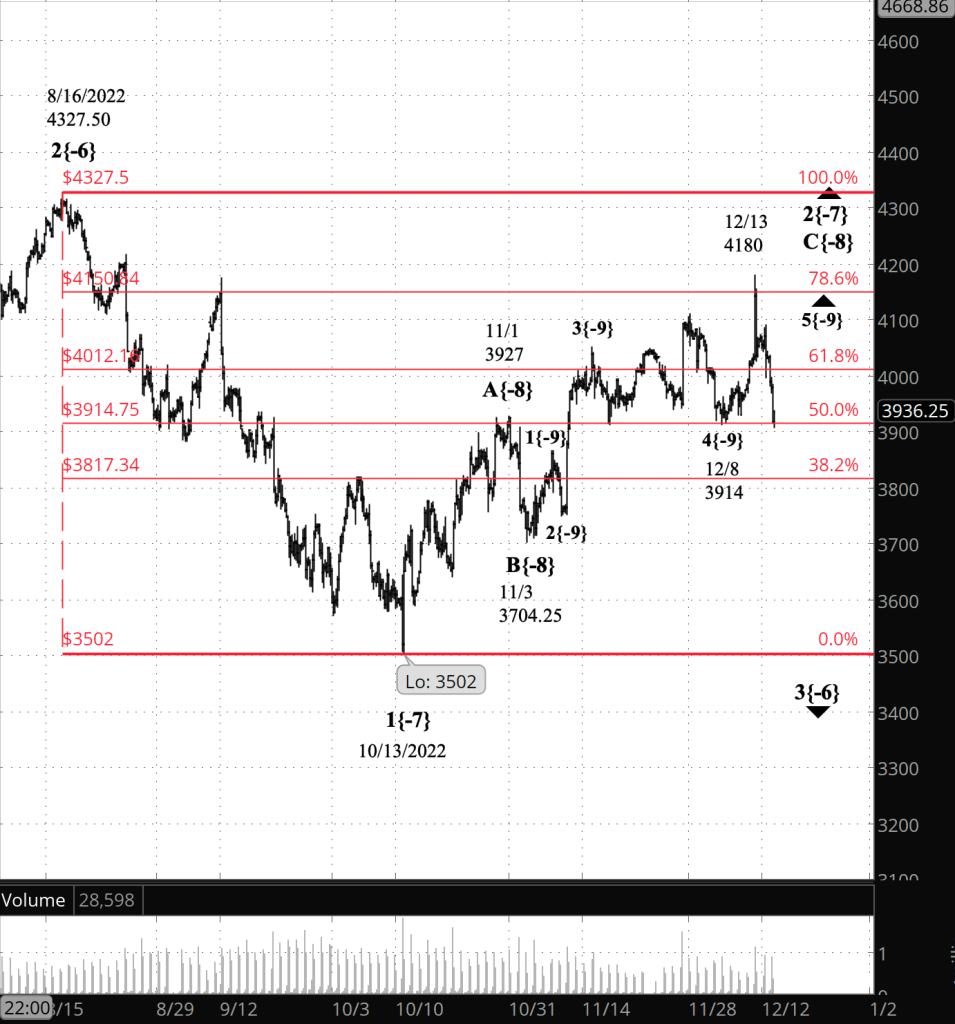
What does Elliott wave theory say? Here are the waves I’m focused on.

Looking first at the principal analysis:

  • The downtrend that began on December 13 is wave 3{-7}.
  • Internally, wave 3{-7} is in its first of five segments, wave 1{-8}.
  • The overnight rise, within wave 1{-8}, is a 4th wave, possibly wave 4{-10} or even smaller.

Looking at the alternatives:

  • The upward correction, which began on October 13, is wave 2{-7}.
  • Under Alternative #1, wave C{-8} within wave 2{-7} is still underway, and the decline that began on December 13 is a correction within wave 2{-7}.
  • Under Alternative #2, the December 13 high is the end of wave C{-8}, and the decline that began on that date is wave X{-8}, connecting the last subwave of the first corrective pattern with the first subwave, A{-8}, of the second corrective pattern.

All of this is happening within wave 3{-6}, a downtrend that began on August 16 from 4327.50.

On the chart and in the discussion above, numbers are used to label trending waves and letters to label corrective waves. The waves on a stock chart are complex, with each wave containing smaller waves and in turn, each wave is the subwave of a still larger wave.

Where a wave stands within that complex structure is called its “degree”, and I’ve numbered each degree with a subscript, contained in curly brackets. I begin the wave numbering at the degree called “Intermediate” by the developer of Elliott wave analysis in the 1930s, an accountant, R.N. Elliott. The subscript for the intermediate degree is {0}. Smaller degrees get a negative subscript, and larger ones, a positive subscript.

We Are Here.

These are the waves currently in progress under my principal analysis. Each line on the list shows the wave number, with the subscript in curly brackets, the traditional degree name, the starting date, the starting price of the S&P 500 E-mini futures, and the direction of the wave.

  • S&P 500 Index:
  • 5{+3} Supercycle, 7/8/1932, 4.40 (up)
  • 5{+2} Cycle, 12/9/1974, 60.96 (up)
  • 5{+1} Primary, 3/6/2009, 666.79 (up)
  • 5{0} Intermediate, 12/26/2018, 2346.58 (up)
  • 4{-1} Minor, 1/4/2022 4818.62 (down)
  • 1{-2} Minute, 1/4/2022 4818.62 (down)
  • S&P 500 Futures and index:
  • 1{-3} Minuette, 1/4/2022, 4808.25 (down) (futures), 4818.62 (down) (index)
  • S&P 500 Futures:
  • 1{-4} Subminuette, 1/4/2022, 4808.25 (down)
  • 1{-5} Micro, 1/4/2022, 4808.25 (down)
  • 3{-6} Submicro, 8/16/2022, 4327.50 (down)
  • 3{-7} Minuscule, 12/1/2022, 4110 (down)
  • 1{-8} Subminuscule, 12/1/2022, 4110 (down)

Learning and other resources. Elliott wave analysis provides context, not prophecy. As the 20th century semanticist Alfred Korzybski put it in his book Science and Sanity (1933), “The map is not the territory … The only usefulness of a map depends on similarity of structure between the empirical world and the map.” And I would add, in the ever-changing markets, we can judge that similarity of structure only after the fact.

See the menu page Analytical Methods for a rundown on where to go for information on Elliott wave analysis.

By Tim Bovee, Portland, Oregon, December 19, 2022

Disclaimer

Tim Bovee, Private Trader tracks the analysis and trades of a private trader for his own accounts. Nothing in this blog constitutes a recommendation to buy or sell stocks, options or any other financial instrument. The only purpose of this blog is to provide education and entertainment.

No trader is ever 100 percent successful in his or her trades. Trading in the stock and option markets is risky and uncertain. Each trader must make trading decisions for his or her own account, and take responsibility for the consequences.

License
Creative Commons License

All content on Tim Bovee, Private Trader by Timothy K. Bovee is licensed under a Creative Commons Attribution-ShareAlike 4.0 International License.

Based on a work at www.timbovee.com.

Trader’s Notebook

3:30 p.m. New York time

Half an hour before the closing bell. The S&P 500 futures have continued to fall during the session, reaching a low so far of 3855.25. No change in the analysis. I’ve updated the chart.

9:35 a.m. New York time

What’s happening now? The S&P 500 E-mini futures continued to fall in overnight trading. The price is now closer to the starting point of the upward correction that began on October 13, from 3502, than it is to the correction’s December 13 peak, 4180,

What does it mean? As has been the case for much of the week, the chart presents two possible interpretations of equal likelihood.

The one I’ve chosen as the principal analysis today sees the upward correction as having ended at the December 13.peak and a significant downtrend as having begun.

What are the alternatives? … and then, there’s…

Alternative #1, which sees the upward correction as still being underway, although it is nearing its end.

So, how to choose between them?

If the price moves below 3502, where the correction began, then it’s sort of a no-brainer — the correction ended on December 13 and the downtrend began on that date.

If the price moves below 3704.25, the beginning of the final segment within the upward correction, that’s a fairly good indication that the downtrend has begun.

Everything above that level? There’s still some uncertainty.

Alternative #2: This is the outlier among possible interpretations. Sometimes corrective waves contain more than one corrective structure. Rather than three waves and it’s done, the wave will trace out a connecting wave, and then go through a second three-wave corrective pattern. And sometimes it will add in a third corrective pattern. A corrective wave with two or three corrective patterns within it is called a compound correction. The present correction is the first within a larger downtrend that began on August 16, and compound corrections are more common within the second correction within a downtrend, so it’s unlikely. Nonetheless, it’s not unheard of and so counts as a genuine alternative scenario.

Chart note. The red structure superimposed on the chart shows levels where reversals or pauses commonly happen, based on how much of the prior trend a correction has retraced. The December 13 peak was slightly above the 78.6% retracement level, which weighs in favor of that peak being the end of the correction. The price fell back through the 61.8% retracement level without pausing, and then did it again with the 50% retracement level. For those reasons, I’m fairly confident that the downtrend has begun.

The retracement levels are based on Fibonacci numbers, a mathematical sequence. Click here for an explanation.

On the chart below, I’ve numbered waves within trending waves and used letters for subwaves within corrections. Waves are fractal in their structure. This means larger waves contain smaller waves, which in turn contain still smaller waves. And a larger waves is a subwave within a still larger wave. And all of those waves, big or small, adhere to the same set of patterns and follow the same rules.

Where a wave sits within the fractal structure of waves bigger and smaller is called its “degree”, meaning its relative size. I’ve used subscripts, in curly brackets, to show the relative degree of each wave on the chart.

[S&P 500 E-mini futures at 3:30 p.m., 4-hour bars, with volume]

What does Elliott wave theory say? Here are the waves that are important to today’s analysis.

Principal analysis:

  • The downtrend that began on December 13 is wave 3{-7}.
  • The current subwave within the downtrend is wave 1{-8}, the first of five waves. So, early days.

Alternative #1:

  • The upward correction, still underway, is wave 2{-7}.
  • The current subwave is wave C{-8}, the last of three subwaves.

Alternative #2:

  • The December 13 peak was the end of the first corrective pattern within an upward correction — waves A{-8}, B{-8} and C{-8} within wave 2[-7}.
  • The ensuing decline is wave X{-8}, which will connect the first corrective pattern with a second corrective pattern.

The principal analysis and the alternatives are happening within wave 3{-6}, a downtrend that began on August 16. That downtrend is a subwave of wave 1{-5}, a larger downtrend that began on January 4.

How far will the wave 3{-7} downtrend go? It’s anyone’s guess, really. Here’s what we know.

  • The downtrend is a 3rd wave, the middle wave, and is likely to be the most power of the five waves in the trend.
  • Wave 3{-7} will, at a minimum, move below the starting point of the correction, 3502.
  • The 3rd wave in a trend is never shorter than both the 1st wave that preceded it and the 5th wave that will follow.
  • The 1st wave — wave 1{-7} — was 825 points in length. Subtract that from the starting point of the wave 3{-7} downtrend, 4180, and we get 3355 as the likely minimum end point of wave 3{-7}. It’s likely to go much further.
  • However, as long as the future 5th is shorter than the present 3rd wave, then the structure is within the rules of Elliott wave analysis. So wave 3{-7} could be shorter than wave 1{-7}, and as long as the future wave 5{-7} is shorter still, then the analysis is valid.

How could this principal analysis be invalidated? If the price reverses and moves above the end point of wave 2{-7}, which is 4180, then the 2nd wave correction has not yet ended and the 3rd wave downtrend has not yet begun.

We Are Here.

These are the waves currently in progress under my principal analysis. Each line on the list shows the wave number, with the subscript in curly brackets, the traditional degree name, the starting date, the starting price of the S&P 500 E-mini futures, and the direction of the wave.

  • S&P 500 Index:
  • 5{+3} Supercycle, 7/8/1932, 4.40 (up)
  • 5{+2} Cycle, 12/9/1974, 60.96 (up)
  • 5{+1} Primary, 3/6/2009, 666.79 (up)
  • 5{0} Intermediate, 12/26/2018, 2346.58 (up)
  • 4{-1} Minor, 1/4/2022 4818.62 (down)
  • 1{-2} Minute, 1/4/2022 4818.62 (down)
  • S&P 500 Futures and index:
  • 1{-3} Minuette, 1/4/2022, 4808.25 (down) (futures), 4818.62 (down) (index)
  • S&P 500 Futures:
  • 1{-4} Subminuette, 1/4/2022, 4808.25 (down)
  • 1{-5} Micro, 1/4/2022, 4808.25 (down)
  • 3{-6} Submicro, 8/16/2022, 4327.50 (down)
  • 3{-7} Minuscule, 12/1/2022, 4110 (down)
  • 1{-8} Subminuscule, 12/1/2022, 4110 (down)

Learning and other resources. Elliott wave analysis provides context, not prophecy. As the 20th century semanticist Alfred Korzybski put it in his book Science and Sanity (1933), “The map is not the territory … The only usefulness of a map depends on similarity of structure between the empirical world and the map.” And I would add, in the ever-changing markets, we can judge that similarity of structure only after the fact.

See the menu page Analytical Methods for a rundown on where to go for information on Elliott wave analysis.

By Tim Bovee, Portland, Oregon, December 16, 2022

Disclaimer

Tim Bovee, Private Trader tracks the analysis and trades of a private trader for his own accounts. Nothing in this blog constitutes a recommendation to buy or sell stocks, options or any other financial instrument. The only purpose of this blog is to provide education and entertainment.

No trader is ever 100 percent successful in his or her trades. Trading in the stock and option markets is risky and uncertain. Each trader must make trading decisions for his or her own account, and take responsibility for the consequences.

License
Creative Commons License

All content on Tim Bovee, Private Trader by Timothy K. Bovee is licensed under a Creative Commons Attribution-ShareAlike 4.0 International License.

Based on a work at www.timbovee.com.

DRI Trade

Darden Restaurants Inc. (DRI)

Lot 2022-3

Update 12/19/2022: I exited my short bull put vertical spread on December 19, 32 days before expiration, for a $2.16 debit per contract/share, a loss before fees of $21 per contract. Shares were trading at $138.54, down $2.51 from the entry level.

The Implied Volatility Rank at exit was 3.7%, down 13.5 points from the entry level.

I exited on the second trading day after entry because the price moved opposite my position and I was able to exit for a small loss.

Shares fell by 1.8% over four days for a +162% annual rate. The options position produced a 9.7% loss for a -887% annual rate.


I have entered a short bull put vertical spread on DRI, using options that trade for the last time 36 days hence, on January 20, 2023. The premium is a $1.95 credit per contract share and the stock at the time of entry was priced at $141.05.

The Implied Volatility Ratio stood a bit low, at 17.2%.

Premium:$1.95Expire OTM
DRI-bull put spreadStrikeOddsDelta
Puts
Long135.0065.0%31
Break-even141.9558.5%37
Short140.0052.0%43

The premium is 78% of the width of the position’s short/long spread. The profit zone covers a 0.6% move to the downside and an unlimited move to the upside.

The risk/reward ratio is 1.6:1, with maximum risk of $305 and maximum reward of $195 per contract.

How I chose the trade. The trade was placed to coincide with DRI’s earnings announcement, before the opening bell on the day after entry. The short strikes were set to coincide with the expected move of $5.55 either way, based on options pricing, which gives a price range of $135.50 to $146.60. The Zacks Investment Research earnings surprise predictor gave DRI a score of 3.55%, with a rank of 3(hold). The analysts’ consensus is that DRI will announce earnings of $1.41 per share.

By Tim Bovee, Portland, Oregon, December 15, 2022

Disclaimer

Tim Bovee, Private Trader tracks the analysis and trades of a private trader for his own accounts. Nothing in this blog constitutes a recommendation to buy or sell stocks, options or any other financial instrument. The only purpose of this blog is to provide education and entertainment.

No trader is ever 100 percent successful in his or her trades. Trading in the stock and option markets is risky and uncertain. Each trader must make trading decisions for his or her own account, and take responsibility for the consequences.

License
Creative Commons License

All content on Tim Bovee, Private Trader by Timothy K. Bovee is licensed under a Creative Commons Attribution-ShareAlike 4.0 International License.

Based on a work at www.timbovee.com.

Trader’s Notebook

3:30 p.m. New York time

Half an hour before the closing bell. The S&P 500 futures has continued to decline during the session, reaching 3908 in a fall that began from 4180. The lower the price falls, the more likely it is that the upward correction that began on October 13 ended on December 13. For now, I’ll continue to mark the chart as though the correction, wave 2{-7}, is still underway. I think it’s just as likely that the correction has ended and a significant downtrend, wave 3{-7}, has begun. I’ve updated the chart.

10:35 a.m. New York time

DRI earnings play entry. I’ve entered a short bull put spread on DRI, using options that trade for the last time on January 20, and have posted an analysis of the trade.

9:35 a.m. New York time

What’s happening now? An overnight decline on the S&P 500 futures, into the 3960s. Is the upward correction still underway, or has a significant downtrend begun? Honestly, it’s a coin toss. Are stocks even worth the effort anymore?

What does it mean? For my principal analysis, I’ve continued with the view that the upward correction that began on October 13 is underway and is in its last leg. However, the sharp decline that began on December 13 adds credence to the first alternative analysis…

What are the alternatives?

Alternative #1: …, which is that the upward correction ended at the December 13 peak and a significant downward correction has begun, one that will carry the price into the 3200s at a minimum and most likely far below that level. At this point, the choice between the principal analysis and the first alternative is a coin toss.

Alternative #2: This far less likely scenario sees the December 13 high as the end of the first corrective pattern within a compound correction that will contain two or three such patterns. The decline of the last two days is a connecting wave between the first and second pattern. The present upward correction is the first correction within a larger downtrend that began on August 16. Compound corrections happen most often in the second correction within a trend.

Chart note. Market corrections tend to pause or reverse at certain points that are known as Fibonacci retracement levels, named after an Italian mathematician on the 12th and 13th centuries, Lionardo Fibonacci. Each number in the Fibonacci sequence, upon which the retracement levels are based, is the sum of the two numbers that come before it in the sequence. The Fibonacci ladder, shown on the chart in red, converts the Fibonacci numbers to the upward movement’s percentage of correction of the prior decline.

On this chart, the December 13 high comes just above the 78.6% retracement level, the last Fibonacci stop before a 100% retracement. The decline that ensued has brought the price below the 61.8% retracement level.

The developer of Elliott wave analysis, R.N. Elliott, used the word “wave” to describe a directional movement of a stock or index. He saw market charts as containing waves within waves, all following the same patterns whatever their relative size, which he called the wave’s degree.

On the chart I number waves within a trend and use letters to label waves within a correction. I show the degree of each wave as a subscript within curly brackets.

[S&P 500 E-mini futures at 3:30 p.m., 4-hour bars, with volume]

What does Elliott wave theory say? Under the principal analysis, wave 2{-7}, an upward correction, is still underway and internally is in its final leg, wave 3[-8}.

Under Alternative #1, wave 2{-7} ended on December 13 and wave 3{-7}, a powerful downtrend, has begun. The downtrend internally is in wave 1{-8}.

Under Alternative #2, wave 2{-7} is forming a compound correction, and the decline that began on December 13 is wave X{-8}, connecting the first corrective pattern that ended with wave C{-8} and a future corrective pattern that will began with wave A{-8}.

All of this is happening within wave 3{-6}, a downtrend that began on August 16. That downtrend is contained within a series of increasingly larger downtrends, up to wave 4{-1}, which began on January 4, giving the markets a distinctively bearish direction.

“Bearish???” Are stocks even worth the effort? It depends upon a trader’s risk aversion and time horizon. As a 76-year-old retiree trading for myself, I’m fairly risk averse and have a shorter time horizon. Younger trader’s can assume more risk within a decades-long time horizon.

Which brings me to yesterday’s Federal Open Market Committee announcement. The FOMC slowed the speed of its interest rate increases, from 75 basis points each meeting to 50 basis points. But the most interesting part of the info they released was committee members’ expectations for interest rates over the next few years.

The Fed Funds Rate, set by the committee, at present is 4.375%. A majority of committee expects the rate in 2023 to be 5.125%, and a plurality see it at 4.125% in 2024.

As a trader who routinely has both wins and losses, a risk-free return of 4%-plus in a declining market is something akin to trading heaven. Treasury bills tend to pay interest close to the Fed Funds Rate, and I’m in the process of transferring the bulk of my trading funds over the 3-month Treasury bills. As the rate declines over the next few years, as it inevitably will, I’ll make decisions about moving funds back into the market, based also on my Elliott wave analysis.

For the Fed Funds Rate projections, see Table 2 on the FOMC’s Projection Materials page.

We Are Here.

These are the waves currently in progress under my principal analysis. Each line on the list shows the wave number, with the subscript in curly brackets, the traditional degree name, the starting date, the starting price of the S&P 500 E-mini futures, and the direction of the wave.

  • S&P 500 Index:
  • 5{+3} Supercycle, 7/8/1932, 4.40 (up)
  • 5{+2} Cycle, 12/9/1974, 60.96 (up)
  • 5{+1} Primary, 3/6/2009, 666.79 (up)
  • 5{0} Intermediate, 12/26/2018, 2346.58 (up)
  • 4{-1} Minor, 1/4/2022 4818.62 (down)
  • 1{-2} Minute, 1/4/2022 4818.62 (down)
  • S&P 500 Futures and index:
  • 1{-3} Minuette, 1/4/2022, 4808.25 (down) (futures), 4818.62 (down) (index)
  • S&P 500 Futures:
  • 1{-4} Subminuette, 1/4/2022, 4808.25 (down)
  • 1{-5} Micro, 1/4/2022, 4808.25 (down)
  • 3{-6} Submicro, 8/16/2022, 4327.50 (down)
  • 2{-7} Minuscule, 10/13/2022, 3502 (up)
  • C{-8} Subminuscule, 11/3/2022, 3704.25 (up)

Learning and other resources. Elliott wave analysis provides context, not prophecy. As the 20th century semanticist Alfred Korzybski put it in his book Science and Sanity (1933), “The map is not the territory … The only usefulness of a map depends on similarity of structure between the empirical world and the map.” And I would add, in the ever-changing markets, we can judge that similarity of structure only after the fact.

See the menu page Analytical Methods for a rundown on where to go for information on Elliott wave analysis.

By Tim Bovee, Portland, Oregon, December 15, 2022

Disclaimer

Tim Bovee, Private Trader tracks the analysis and trades of a private trader for his own accounts. Nothing in this blog constitutes a recommendation to buy or sell stocks, options or any other financial instrument. The only purpose of this blog is to provide education and entertainment.

No trader is ever 100 percent successful in his or her trades. Trading in the stock and option markets is risky and uncertain. Each trader must make trading decisions for his or her own account, and take responsibility for the consequences.

License
Creative Commons License

All content on Tim Bovee, Private Trader by Timothy K. Bovee is licensed under a Creative Commons Attribution-ShareAlike 4.0 International License.

Based on a work at www.timbovee.com.

Trader’s Notebook

3:30 p,m, New York time

Half an hour before the closing bell. The S&P 500 futures fell sharply after the Federal Open Market Committee announced it was doing what everyone has expected for weeks: Lowered the Federal Funds Rate by 50 basis points instead of by 75 bps. It then fell further early in Fed Chairman Jerome Powell’s news conference.

The price has declined in a day from 4180 to 3997.

No change in this morning’s analysis. An upward correction, wave 2{-7}, continues and is in its final leg, wave C{-8}. However, the lower the price declines, the more likely it is that the upward correction ended yesterday, December 13, and that a downtrend, wave 3{-7}, has begun.

I’ve updated the chart.

9:35 a.m. New York time

What’s happening now? The S&P 500 E-mini futures traded in a narrow range overnight, remaining between the 4040s and the 4070s.

What does it mean? An upward correction that began on October 13 is underway and is in its final leg. So far it has has retraced a bit more than 79% of the downtrending wave that preceded it.

What are the alternatives? There are two.

  • Alternative #1: The December 13 peak, 4180, was the end of the upward correction and a significant downtrend has begun.
  • Alternative #2: The December 13 peak ended the first corrective pattern within a compound correction. The subsequent decline will connect the first corrective pattern with a second one, and a third correct pattern might follow.

Chart note. With the upward correction still underway, I have again placed retracement levels on the chart, in red. The lines show levels where prices often will pause or reverse. They are called Fibonacci levels, and the developer of Elliott wave analysis in the 1930s, R.N. Elliott, an accountant, considered them to be important in understanding the chart.

A core concept in Elliott’s analysis is that directional movements — “waves”, as he called them — all follow the same pattern, whether they be large or small. A stock chart is built by waves, with larger waves containing building blocks of smaller waves, and the larger waves being building blocks of still larger waves. The technical term for such a structure is a “fractal” structure.

On the chart, trending waves are numbered, and corrective waves are labeled with letters. In order to show where each wave stands relative to others within the fractal structure, I use subscripts showing each wave’s degree — its relative size.

[S&P 500 E-mini futures at 3:30 p.m., 4-hour bars, with volume]

What does Elliott wave theory say? At this point our analytical task is to figure out where and when the upward correction ends. This is almost always a thankless task that results in several false calls before there’s a success. Unlike a film, the chart has no sign that says “The End”.

There are, however, indicators that give a hint. Those indicators are waves and their internal structures. Here are the one’s I’m relying on.

  • The upward correction that began on October 13 is wave 2{-7}. Most often, a 2nd wave has three subwaves, forming a corrective pattern.
  • Wave 2{-7} is in its third subwave, C{-8}. The C wave has five waves within it and is in its final subwave.
  • The final subwave is wave 5{-9}.

A final subwave within a final subwave — it’s clear that wave 2{-7} is reaching an end.

And then there are the alternative analyses.

  • Alternative #1: Wave 2{-7} and its subwaves ended on December 13 at 4180, and a downtrend, wave 3{-7} has begun.
  • Alternative #2: Wave 2{-7} is forming a compound structure and is presently in wave X{-8}, connecting the now complete first corrective pattern with a future second pattern.

What lies ahead? Whenever wave 2{-7} ends, it will be followed by a significant downtrend, wave 3{-7}. Third waves are almost always the longest and most powerful subwaves within a five-wave trending wave. At a minimum, I expect wave 3{-7} to fall to the 3350s, a level last seen in October 2020. And it will almost certainly fall much farther.

Everything I’ve discussed so far is happening within a still larger wave, 3{-6}, which began on August 16, within an even larger wave, 1{-5}, which began on January 4. They are downtrending waves that are contained within still larger downtrending waves, all the way up to wave 4{-1}, which also began on January 4. Wave 4{-1} is a subwave of wave 5{0} — one degree higher — which began on December 26, 2018.

So yes, the market, as always, will have its ups and downs, and there will be profits to be made trading those fluctuations, but the larger trends for the next years or two and even longer will be down.

We Are Here.

These are the waves currently in progress under my principal analysis. Each line on the list shows the wave number, with the subscript in curly brackets, the traditional degree name, the starting date, the starting price of the S&P 500 E-mini futures, and the direction of the wave.

  • S&P 500 Index:
  • 5{+3} Supercycle, 7/8/1932, 4.40 (up)
  • 5{+2} Cycle, 12/9/1974, 60.96 (up)
  • 5{+1} Primary, 3/6/2009, 666.79 (up)
  • 5{0} Intermediate, 12/26/2018, 2346.58 (up)
  • 4{-1} Minor, 1/4/2022 4818.62 (down)
  • 1{-2} Minute, 1/4/2022 4818.62 (down)
  • S&P 500 Futures and index:
  • 1{-3} Minuette, 1/4/2022, 4808.25 (down) (futures), 4818.62 (down) (index)
  • S&P 500 Futures:
  • 1{-4} Subminuette, 1/4/2022, 4808.25 (down)
  • 1{-5} Micro, 1/4/2022, 4808.25 (down)
  • 3{-6} Submicro, 8/16/2022, 4327.50 (down)
  • 3{-7} Minuscule, 12/1/2022, 4110 (down)
  • 1{-8} Subminuscule, 12/1/2022, 4110 (down)

Learning and other resources. Elliott wave analysis provides context, not prophecy. As the 20th century semanticist Alfred Korzybski put it in his book Science and Sanity (1933), “The map is not the territory … The only usefulness of a map depends on similarity of structure between the empirical world and the map.” And I would add, in the ever-changing markets, we can judge that similarity of structure only after the fact.

See the menu page Analytical Methods for a rundown on where to go for information on Elliott wave analysis.

By Tim Bovee, Portland, Oregon, December 14, 2022

Disclaimer

Tim Bovee, Private Trader tracks the analysis and trades of a private trader for his own accounts. Nothing in this blog constitutes a recommendation to buy or sell stocks, options or any other financial instrument. The only purpose of this blog is to provide education and entertainment.

No trader is ever 100 percent successful in his or her trades. Trading in the stock and option markets is risky and uncertain. Each trader must make trading decisions for his or her own account, and take responsibility for the consequences.

License
Creative Commons License

All content on Tim Bovee, Private Trader by Timothy K. Bovee is licensed under a Creative Commons Attribution-ShareAlike 4.0 International License.

Based on a work at www.timbovee.com.

Trader’s Notebook

3:30 p.m. New York time

Half an hour before the closing bell. The S&P 500 futures declined during the session, falling below the starting point of this morning’s rapid rise. It’s possible that the pre-opening high, 4180, marks the end of the upward correction that began on October 13, but it might not be. I’ll leave the labeling as it was this morning and keep a close eye on the chart patterns. For now, the principal anqlysis is, the upward correction, wave 2{-7}, is underway and is in its their and possibly final subwave, C{-8}, which in turn is in its fifth and final subwave, 5{-9}.

9:35 a.m. New York time

What’s happening now? When November’s inflation numbers were published before the opening bell, the S&P 500 E-mini futures rose 90 points in a single minute, to 4180, and then in several minutes that followed pulled back by 80 points.

What does it mean? The rapid rise brought the price well above the previous peak since an upward correction began on October 13, disqualifying the previous principal analysis and replacing it with yesterday’s Alternative #3: The first corrective pattern within the upward correction is still underway. It is in its third and final subwave.

What are the alternatives? At this point there are none, except the fact that any new peak is a possible end to the correction, although it’s not a certainty.

[S&P 500 E-mini futures at 3:30 p.m., 2-hour bars, with volume]

What does Elliott wave theory say? In line with the major revision to the analysis, these are the waves that I’m watching closely.

  • The upward correction, still underway, is wave 2{-7}.
  • It is in its third internal wave, rising wave C{-8}.
  • Wave C{-8} is in its final phase, rising wave 5{-9}.

The end of wave 5{-9} will also be the end of waves C{-8} and perhaps 2{-7}. At that point, one of two things will happen:

  • Wave 3{-7}, a downtrend, will begin, carrying the price a significant distance below current levels.
  • Or, wave 2{-7} will form a compound structure, containing two or three corrective patterns. After wave C{-8} is complete, a connecting wave, X{-8}, will carry the price down a bit before the second corrective pattern begins.

This is all happening within wave 3{-6}, a downtrend that began on August 16 from 4327.50. That downtrend is a subwave of wave 1{-5}, which began on January 4 from 4808.25.

We Are Here.

These are the waves currently in progress under my principal analysis. Each line on the list shows the wave number, with the subscript in curly brackets, the traditional degree name, the starting date, the starting price of the S&P 500 E-mini futures, and the direction of the wave.

  • S&P 500 Index:
  • 5{+3} Supercycle, 7/8/1932, 4.40 (up)
  • 5{+2} Cycle, 12/9/1974, 60.96 (up)
  • 5{+1} Primary, 3/6/2009, 666.79 (up)
  • 5{0} Intermediate, 12/26/2018, 2346.58 (up)
  • 4{-1} Minor, 1/4/2022 4818.62 (down)
  • 1{-2} Minute, 1/4/2022 4818.62 (down)
  • S&P 500 Futures and index:
  • 1{-3} Minuette, 1/4/2022, 4808.25 (down) (futures), 4818.62 (down) (index)
  • S&P 500 Futures:
  • 1{-4} Subminuette, 1/4/2022, 4808.25 (down)
  • 1{-5} Micro, 1/4/2022, 4808.25 (down)
  • 3{-6} Submicro, 8/16/2022, 4327.50 (down)
  • 2{-7} Minuscule, 10/13/2022, 3502 (up)
  • C{-8} Subminuscule, 11/3/2022, 3704.25 (up)

Learning and other resources. Elliott wave analysis provides context, not prophecy. As the 20th century semanticist Alfred Korzybski put it in his book Science and Sanity (1933), “The map is not the territory … The only usefulness of a map depends on similarity of structure between the empirical world and the map.” And I would add, in the ever-changing markets, we can judge that similarity of structure only after the fact.

See the menu page Analytical Methods for a rundown on where to go for information on Elliott wave analysis.

By Tim Bovee, Portland, Oregon, December 13, 2022

Disclaimer

Tim Bovee, Private Trader tracks the analysis and trades of a private trader for his own accounts. Nothing in this blog constitutes a recommendation to buy or sell stocks, options or any other financial instrument. The only purpose of this blog is to provide education and entertainment.

No trader is ever 100 percent successful in his or her trades. Trading in the stock and option markets is risky and uncertain. Each trader must make trading decisions for his or her own account, and take responsibility for the consequences.

License
Creative Commons License

All content on Tim Bovee, Private Trader by Timothy K. Bovee is licensed under a Creative Commons Attribution-ShareAlike 4.0 International License.

Based on a work at www.timbovee.com.

Trader’s Notebook

3:30 p.m. New York time

Half an hour before the closing bell. The S&P 500 futures rose above Friday’s high of 3990, replacing this morning’s principal analysis with the first alternative analysis: The rising next-to-the-last wave within the first leg of a downtrend that began on December 1 is still underway. In Elliott wave terminology, wave 4{-9} within wave 1{-8} within wave 3{-7} is in progress. I’ve updated the chart.

9:35 a.m. New York time

What’s happening now? The S&P 500 E-mini futures fell to the 3950s in overnight trading and then rose back into the 3980s.

What does it mean? The final decline within the 1st leg of a downtrend that began on December 1 is underway.

What are the alternatives? There are several.

  • Alternative #1: The final decline within the downtrend’s first leg has not yet begun.
  • Alternative #2: The downtrend itself has not yet begun. Instead, the upward correction that preceded it is forming a compound structure, and the decline from December 1 will connect the now complete first corrective pattern with a second corrective pattern that has not yet begun.
  • Alternative #3: The first corrective pattern within the upward correction is still underway.

All three alternatives are based on the fact that the downtrend that began on December 1 hasn’t fallen very far yet — from 4110 to 3914 at the low point since December 1. This creates ambiguity in determining what the pattern on the chart is.

[S&P 500 E-mini futures at 3:30 p.m., 2-hour bars, with volume]

What does Elliott wave theory say? Under R.N. Elliott’s theory of stock chart patterns, each directional movement is called a wave, each wave contains subwaves and is in turn a subwave of a larger wave. And all waves follow the same set of patterns.

A wave in the direction of the trend is an impulse wave and has five numbered subwaves. A wave moving opposite of the trend is a corrective wave and usually has three subwaves designated by letters. Each wave label contains a subscript, in curly brackets, that show its relative size compare to other waves, which Elliott called its “degree”.

These are the waves that are key to today’s analysis.

  • The downtrend that began on December 1 from 4110 is wave 3{-7}.
  • Internally, wave 3{-7} is in its first leg, wave 1{-8}
  • Wave 1{-8} in turn is in its final leg, wave 5{-9}.
  • Wave 3{-7} follows an upward correction, wave 2{-7}, which ended on December 1.
  • If wave 2{-7} is forming a compound correction, then the first corrective pattern ended on December 1 with wave C{-8}, the present decline is a connector, wave X{-8}, and the second corrective pattern will begin afterward with wave A{-8}.
  • All of this is happening within wave 3{-6}, which began on August 16 from 4327.50
  • Wave 3{-6} is a subwave of wave 1{-5}, which began on January 4 from 4808.25, the start of the rise that began on February 23, ending the crash at the start of the COVID-19 pandemic.

Since the decline from the January 4 peak is only in its first of five subwaves, the chart shows that there is much downside ahead before the present downtrend is complete.

We Are Here.

These are the waves currently in progress under my principal analysis. Each line on the list shows the wave number, with the subscript in curly brackets, the traditional degree name, the starting date, the starting price of the S&P 500 E-mini futures, and the direction of the wave.

  • S&P 500 Index:
  • 5{+3} Supercycle, 7/8/1932, 4.40 (up)
  • 5{+2} Cycle, 12/9/1974, 60.96 (up)
  • 5{+1} Primary, 3/6/2009, 666.79 (up)
  • 5{0} Intermediate, 12/26/2018, 2346.58 (up)
  • 4{-1} Minor, 1/4/2022 4818.62 (down)
  • 1{-2} Minute, 1/4/2022 4818.62 (down)
  • S&P 500 Futures and index:
  • 1{-3} Minuette, 1/4/2022, 4808.25 (down) (futures), 4818.62 (down) (index)
  • S&P 500 Futures:
  • 1{-4} Subminuette, 1/4/2022, 4808.25 (down)
  • 1{-5} Micro, 1/4/2022, 4808.25 (down)
  • 3{-6} Submicro, 8/16/2022, 4327.50 (down)
  • 3{-7} Minuscule, 12/1/2022, 4110 (down)
  • 1{-8} Subminuscule, 12/1/2022, 4110 (down)

Learning and other resources. Elliott wave analysis provides context, not prophecy. As the 20th century semanticist Alfred Korzybski put it in his book Science and Sanity (1933), “The map is not the territory … The only usefulness of a map depends on similarity of structure between the empirical world and the map.” And I would add, in the ever-changing markets, we can judge that similarity of structure only after the fact.

See the menu page Analytical Methods for a rundown on where to go for information on Elliott wave analysis.

By Tim Bovee, Portland, Oregon, December 12, 2022

Disclaimer

Tim Bovee, Private Trader tracks the analysis and trades of a private trader for his own accounts. Nothing in this blog constitutes a recommendation to buy or sell stocks, options or any other financial instrument. The only purpose of this blog is to provide education and entertainment.

No trader is ever 100 percent successful in his or her trades. Trading in the stock and option markets is risky and uncertain. Each trader must make trading decisions for his or her own account, and take responsibility for the consequences.

License
Creative Commons License

All content on Tim Bovee, Private Trader by Timothy K. Bovee is licensed under a Creative Commons Attribution-ShareAlike 4.0 International License.

Based on a work at www.timbovee.com.

Trader’s Notebook

3:30 p.m. New York time

Half an hour before the closing bell. The S&P 500 futures spent much of the session in the 3960s and 3970s, in a relatively small upward correction within a larger downtrend. No change in the analysis. I’ve updated the chart.

9:35 a.m. New York time

What’s happening now? The S&P 500 E-mini futures fell sharply an hour before the opening bell, coinciding with the release of Producer Price Index, which came in higher than the consensus had anticipated.

What does it mean? The decline, from the 3990s to the 3930s, began the 5th and final portion within the 1st part of a downtrend that began on December 1 from 4110. The 1st wave within the trend will be followed by an upward correction, and then by a more powerful decline.

What are the alternatives? The two alternatives listed since the downtrend began continue to be possibilities. The lower the price goes, the less likely they become.

Alternative #1: The upward correction that began on October 13 is still underway.

Alternative #2: The upward correction is forming a compound structure, containing two or three corrective patterns. The first corrective pattern ended on December 1, and the decline that followed is a connector that will be followed by a second corrective pattern.

Alternative #3: The 4th portion of the 1st part of the downtrend may still be underway.

Chart notes. The chart’s directional movements, called “waves” in Elliott wave analysis, are consistent with a trend, called an “impulse wave”. An impulse wave has five subwaves, and each subwave in turn contains its own smaller waves.

The trick early in a trend is deciding how the waves on the chart relate to the larger trending wave. The waves within the trend are numbered, and I designate their relative size — their “degree” in Elliott’s terminology — by a subscript shown within curly brackets.

Here’s how the subscripts are distributed on the chart.

  • The trend itself is degree {-7}.
  • The first wave within the trend is degree {-8}.
  • Those still smaller waves are… hard to say. I’ve labeled them as {-9} because that seems roughly consistent in time taken with the initial stage of an earlier 1st wave. But they could be a degree smaller, {-10}. Or even a degree larger, {-8}.

The problem will work itself out as the trend develops. Meanwhile, the degrees are a guess and might well change.

[S&P 500 E-mini futures at 3:30 p.m., 2-hour bars, with volume]

What does Elliott wave theory say? These are waves that I’m tracking at this moment.

  • The downtrend that began on December 1 is wave 3{-7}. It’s a 3rd wave, so the force is strong in this one.
  • The 1st subwave within the downtrend is wave 1{-8}.
  • Wave 1{-8} will have five subwaves internally and is in its 5th and final subwave, numbered 5{-9}.

Wave 5{-9}, when complete, will also be the end of wave 1{-8}, which will be followed by an upward correction, wave 2{-8}, and then by further decline, wave 3{-8}

Wave 3{-7} will be completed by the end of its final wave, 5{-8}, and will be followed by an upward correction, wave 4[-7}. After the correction, the downtrend will resume as wave 5{-7}, carrying the price still lower.

Alternative waves. Here are the significant waves within the three alternatives.

Alternative #1: Wave 2{-7} is still underway and has not yet completed its first corrective pattern.

Alternative #2: Wave 2{-7} has completed its first corrective pattern. The present decline is wave X{-8}, connecting the first corrective pattern to a second one within a compound correction.

Alternative #3: Wave 4{-9} within wave 1{-8} within the downtrend, wave 3{-7}, are underway.

We Are Here.

These are the waves currently in progress under my principal analysis. Each line on the list shows the wave number, with the subscript in curly brackets, the traditional degree name, the starting date, the starting price of the S&P 500 E-mini futures, and the direction of the wave.

  • S&P 500 Index:
  • 5{+3} Supercycle, 7/8/1932, 4.40 (up)
  • 5{+2} Cycle, 12/9/1974, 60.96 (up)
  • 5{+1} Primary, 3/6/2009, 666.79 (up)
  • 5{0} Intermediate, 12/26/2018, 2346.58 (up)
  • 4{-1} Minor, 1/4/2022 4818.62 (down)
  • 1{-2} Minute, 1/4/2022 4818.62 (down)
  • S&P 500 Futures and index:
  • 1{-3} Minuette, 1/4/2022, 4808.25 (down) (futures), 4818.62 (down) (index)
  • S&P 500 Futures:
  • 1{-4} Subminuette, 1/4/2022, 4808.25 (down)
  • 1{-5} Micro, 1/4/2022, 4808.25 (down)
  • 3{-6} Submicro, 8/16/2022, 4327.50 (down)
  • 3{-7} Minuscule, 12/1/2022, 4110 (down)
  • 1{-8} Subminuscule, 12/1/2022, 4110 (down)

Learning and other resources. Elliott wave analysis provides context, not prophecy. As the 20th century semanticist Alfred Korzybski put it in his book Science and Sanity (1933), “The map is not the territory … The only usefulness of a map depends on similarity of structure between the empirical world and the map.” And I would add, in the ever-changing markets, we can judge that similarity of structure only after the fact.

See the menu page Analytical Methods for a rundown on where to go for information on Elliott wave analysis.

By Tim Bovee, Portland, Oregon, December 9, 2022

Disclaimer

Tim Bovee, Private Trader tracks the analysis and trades of a private trader for his own accounts. Nothing in this blog constitutes a recommendation to buy or sell stocks, options or any other financial instrument. The only purpose of this blog is to provide education and entertainment.

No trader is ever 100 percent successful in his or her trades. Trading in the stock and option markets is risky and uncertain. Each trader must make trading decisions for his or her own account, and take responsibility for the consequences.

License
Creative Commons License

All content on Tim Bovee, Private Trader by Timothy K. Bovee is licensed under a Creative Commons Attribution-ShareAlike 4.0 International License.

Based on a work at www.timbovee.com.

Trader’s Notebook

3:30 p.m. New York time

Half an hour before the closing bell. The S&P 500 futures has continued to trade in the 3900s throughout the session. No change in the analysis. I’ve updated the chart.

9:35 a.m. New York time

What’s happening now? The S&P 500 E-mini futures traded in a narrow range overnight, staying in the 3900s.

What does it mean? The sideways movement is a low-level correction within the first leg of a downtrend that began on December 1.

What are the alternatives? There are two, unchanged from the last couple of days. The lower the price goes, the less likely these alternatives become.

  • Alternative #1: The upward correction is still in the third and final wave of its corrective pattern and the price will soon reverse, rising above the December 1 high, 4110.
  • Alternative #2: The upward correction is forming a compound structure, containing two or three corrective patterns, and the present decline is a wave connecting the first corrective pattern with a second one.

Chart note. I’ve moved the chart closer in to better show the scale of the present downtrend, which began on December 1, to the larger downtrend, which began on August 16.

R.N. Elliott, the accountant who developed Elliott wave analysis, called a directional movement on the chart a “wave” and identified two types; An impulse wave, in the direction of a trend, and a corrective wave, moving counter to the trend. Impulse waves have five subwaves, and corrective waves usually have three subwaves.

An upward corrective wave ended on December 1 and a downward impulse wave began. I’ve marked the minimum price target of that downward impulse wave, 3285, with a dashed line. I expect the price to fall significantly below that level.

[S&P 500 E-mini futures at 3:30 p.m., 4-hour bars, with volume]

What does Elliott wave theory say? These are the important waves today.

  • The downtrend that began on December 1 is wave 3{-7}. Third waves tend to be powerful and are almost always the longest of the five subwaves of an impulse pattern.
  • Wave 1{-8}, the first subwave of wave 3{-7}, is now now underway.
  • Wave 3{-7} is a subwave of a larger third wave, 3{-6}, which began on August 16.

Elliott found that waves are built from smaller waves and are in turn the building blocks of larger waves. He called the relative size of a wave compared to others in the hierarchy its “degree”. On the chart, I label the waves with a number, for impulse waves, or a letter, for corrective waves, with a subscript in a curly bracket showing the wave’s degree relative to other waves.

As with all waves, wave 3{-7} will contain smaller impulse waves, trending downward, and small corrective waves, moving upward.

  • Wave 1{-8} will be followed by an upward correction, wave 2{-8}, and then by a powerful downtrend, wave 3{-8}, another upward correction, wave 4{-8}, and then a final push to the downside, wave 5{-8}. All are one degree smaller than wave 3{-7}.
  • Wave 3{-7} will be followed by an upward correction, wave 4{-7}, and then a final push to the downside, wave 5{-7}.
  • One degree higher, wave 3{-6} will follow an identical pattern but with larger swings: A wave 4{-6} upward correction followed by a wave 5{-6} downtrend.

Bull trades are possible even in downtrending markets because it’s possible to trade upward corrections. My favorite wave to trade within an upward correction is the C wave — the 3rd subwave of the correction. Important caveat: the larger the degree of the correction, the more it can support a longer-term position. Smaller degrees require a willingness to rapidly move in and out of a position.

We Are Here.

These are the waves currently in progress under my principal analysis. Each line on the list shows the wave number, with the subscript in curly brackets, the traditional degree name, the starting date, the starting price of the S&P 500 E-mini futures, and the direction of the wave.

  • S&P 500 Index:
  • 5{+3} Supercycle, 7/8/1932, 4.40 (up)
  • 5{+2} Cycle, 12/9/1974, 60.96 (up)
  • 5{+1} Primary, 3/6/2009, 666.79 (up)
  • 5{0} Intermediate, 12/26/2018, 2346.58 (up)
  • 4{-1} Minor, 1/4/2022 4818.62 (down)
  • 1{-2} Minute, 1/4/2022 4818.62 (down)
  • S&P 500 Futures and index:
  • 1{-3} Minuette, 1/4/2022, 4808.25 (down) (futures), 4818.62 (down) (index)
  • S&P 500 Futures:
  • 1{-4} Subminuette, 1/4/2022, 4808.25 (down)
  • 1{-5} Micro, 1/4/2022, 4808.25 (down)
  • 3{-6} Submicro, 8/16/2022, 4327.50 (down)
  • 3{-7} Minuscule, 12/1/2022, 4110 (down)
  • 1{-8} Subminuscule, 12/1/2022, 4110 (down)

Learning and other resources. Elliott wave analysis provides context, not prophecy. As the 20th century semanticist Alfred Korzybski put it in his book Science and Sanity (1933), “The map is not the territory … The only usefulness of a map depends on similarity of structure between the empirical world and the map.” And I would add, in the ever-changing markets, we can judge that similarity of structure only after the fact.

See the menu page Analytical Methods for a rundown on where to go for information on Elliott wave analysis.

By Tim Bovee, Portland, Oregon, December 8, 2022

Disclaimer

Tim Bovee, Private Trader tracks the analysis and trades of a private trader for his own accounts. Nothing in this blog constitutes a recommendation to buy or sell stocks, options or any other financial instrument. The only purpose of this blog is to provide education and entertainment.

No trader is ever 100 percent successful in his or her trades. Trading in the stock and option markets is risky and uncertain. Each trader must make trading decisions for his or her own account, and take responsibility for the consequences.

License
Creative Commons License

All content on Tim Bovee, Private Trader by Timothy K. Bovee is licensed under a Creative Commons Attribution-ShareAlike 4.0 International License.

Based on a work at www.timbovee.com.

Trader’s Notebook

3:30 p.m. New York time

Half an hour before the closing bell. The S&P 500 futures remained above the overnight low, 3914, trading narrowly between the 3950s and the 3930s during the session.

No change in the analysis. I’ve updated the chart.

9:35 a.m. New York time

What’s happening now? The S&P 500 E-mini futures rose slightly overnight and then fell further, to 3914.

What does it mean? A downtrend that began on December 1 is now taking its early steps and will carry the price into the 3400s and likely much lower.

What are the alternatives? There are two:

  • Alternative #1: The upward correction is still in the third and final wave of its corrective pattern and the price will soon reverse, rising above the December 1 high, 4110.
  • Alternative #2: The upward correction is forming a compound structure, containing two or three corrective patterns, and the present decline is a wave connecting the first corrective pattern with a second one.

Chart note. Today’s chart looks at the entire downtrend that began on March 29. That downtrend is wave 1{-5}, and the chart shows that the S&P 500 is presently in the 3rd subwave, wave 3{-6}.

R.N. Elliot used the term “wave” for a directional market movement. He numbered waves within a trend, and used letters to designate counter-trend corrections. Waves form a hierarchy of smaller waves within larger ones, and I use subscripts, in curly brackets, after the wave labels to show where the waves fit in the hierarchy, a position called a wave’s “degree” by Elliott.

[S&P 500 E-mini futures at 3:30 p.m., 8-hour bars, with volume]

What does Elliott wave theory say? These are the waves in play at his point.

  • The downward correction is wave 3{-7}, the middle wave of a downtrend that began on August 16, wave 3{-6}. It follows an upward correction, wave 2[-7}.
  • Internally, wave 3{-7} is in its first wave, 1{-8}.

The rising wave that follows, wave 2{-8}, can be expected to take back much of the 1st wave decline, creating hope that the downtrend has ended. Then downtrending wave 3{-8} will begin. A downtrend within a larger downtrend within a still larger downtrend, all of them 3rd waves, wave 3{-8}will dash all hopes of a quick recovery.

How long will the downtrend last? Wave 1{-7} began on August 16 and lasted 109 days. Wave 3{-7} can be expected to last longer, since 3rd waves cover more territory than 1st waves do.

  • If wave 3{-7} takes the same amount of time as wave 1{-7}, then it would end in March 2023.
  • If it takes twice as long, then it would end in July 2023.
  • If it takes three times as long, then we’re looking at October 2023 as the end of wave 3{-7}.

We Are Here.

These are the waves currently in progress under my principal analysis. Each line on the list shows the wave number, with the subscript in curly brackets, the traditional degree name, the starting date, the starting price of the S&P 500 E-mini futures, and the direction of the wave.

  • S&P 500 Index:
  • 5{+3} Supercycle, 7/8/1932, 4.40 (up)
  • 5{+2} Cycle, 12/9/1974, 60.96 (up)
  • 5{+1} Primary, 3/6/2009, 666.79 (up)
  • 5{0} Intermediate, 12/26/2018, 2346.58 (up)
  • 4{-1} Minor, 1/4/2022 4818.62 (down)
  • 1{-2} Minute, 1/4/2022 4818.62 (down)
  • S&P 500 Futures and index:
  • 1{-3} Minuette, 1/4/2022, 4808.25 (down) (futures), 4818.62 (down) (index)
  • S&P 500 Futures:
  • 1{-4} Subminuette, 1/4/2022, 4808.25 (down)
  • 1{-5} Micro, 1/4/2022, 4808.25 (down)
  • 3{-6} Submicro, 8/16/2022, 4327.50 (down)
  • 3{-7} Minuscule, 12/1/2022, 4110 (down)
  • 1{-8} Subminuscule, 12/1/2022, 4110 (down)

Learning and other resources. Elliott wave analysis provides context, not prophecy. As the 20th century semanticist Alfred Korzybski put it in his book Science and Sanity (1933), “The map is not the territory … The only usefulness of a map depends on similarity of structure between the empirical world and the map.” And I would add, in the ever-changing markets, we can judge that similarity of structure only after the fact.

See the menu page Analytical Methods for a rundown on where to go for information on Elliott wave analysis.

By Tim Bovee, Portland, Oregon, December 7, 2022

Disclaimer

Tim Bovee, Private Trader tracks the analysis and trades of a private trader for his own accounts. Nothing in this blog constitutes a recommendation to buy or sell stocks, options or any other financial instrument. The only purpose of this blog is to provide education and entertainment.

No trader is ever 100 percent successful in his or her trades. Trading in the stock and option markets is risky and uncertain. Each trader must make trading decisions for his or her own account, and take responsibility for the consequences.

License
Creative Commons License

All content on Tim Bovee, Private Trader by Timothy K. Bovee is licensed under a Creative Commons Attribution-ShareAlike 4.0 International License.

Based on a work at www.timbovee.com.